
In our previous post , we introduced PyDeequ , an open-source Python wrapper over Deequ, which enables you to write unit tests on your data to ensure data quality. The use case we ran through was on static, historical data, but most datasets are dynamic, so how can you quantify how your data is changing and detect anomalous changes over time?
At Amazon, we’ve leveraged PyDeequ on AWS Glue to address this problem. AWS Glue is a serverless data integration service that allows you to easily prepare and combine your data for analytics, machine learning (ML), and application development. AWS Glue enables data engineers to build extract, transform, and load (ETL) workflows with ease. By using PyDeequ with AWS Glue, you can create a metrics repository on your data and check for anomalous changes over time inside your ETL workflows. In this post, we share this design pattern with you.
Use cases of PyDeequ on AWS Glue include:
- Identifying and counting mismatched schema items and then immediately correcting them
- Reviewing your incoming data with standard or custom, predefined analytics before storing it for big data validation
- Tracking changes in data distribution by using a data quality metric file
- Immediately identifying and creating useful constraints based on data distribution
The post describes the implementation process and provides a step-by-step tutorial of tracking changes in data quality. It walks you through an example of transforming a large dataset to identify the seasonality of the trends over time. Next, you create, sort, and load a metrics repository using PyDeequ, which allows you to persist your analysis over time. Finally, you create an alert that notifies you when a data point is outside the forecasted range.
Where are the Anomalies?
It can be difficult to immediately find anomalies within your incoming data stream over time. PyDeequ makes it easier to identify changes in data distribution by creating a metrics repository. The repository allows you to store and load a variety of anomaly checks to compare current and past metric values. For this post, you learn about the Holt Winters anomaly detection strategy, one of the various anomaly detection strategies that PyDeequ provides. The Holt Winters model forecasts future datasets based on a repeated periodical pattern (seasonality), a trend (slope), and the average between two corresponding time points.
You can apply the Holt Winters method in many different use cases, such as the following:
- Business problem – Identifying a shift in the demand of a product
- Data pattern – Input data deviates from trend and seasonality
- Business analysis – Detecting changes in profits over time
To demonstrate this anomaly detection strategy, you use the AWS Customer Reviews Dataset, a collection of over 130 million reviews written in Amazon.com marketplace from 1995–2015. Specifically, you narrow down the dataset to focus on the total votes in the jewelry subset from 2013–2015. A graph of this data shows a tight correlation and seasonality with more engagement throughout the winter holidays. However, by 2015, the correlation deviates.
The following graph illustrates February 2015 as divergent from the previous years, with nearly 30% more engagement in votes.
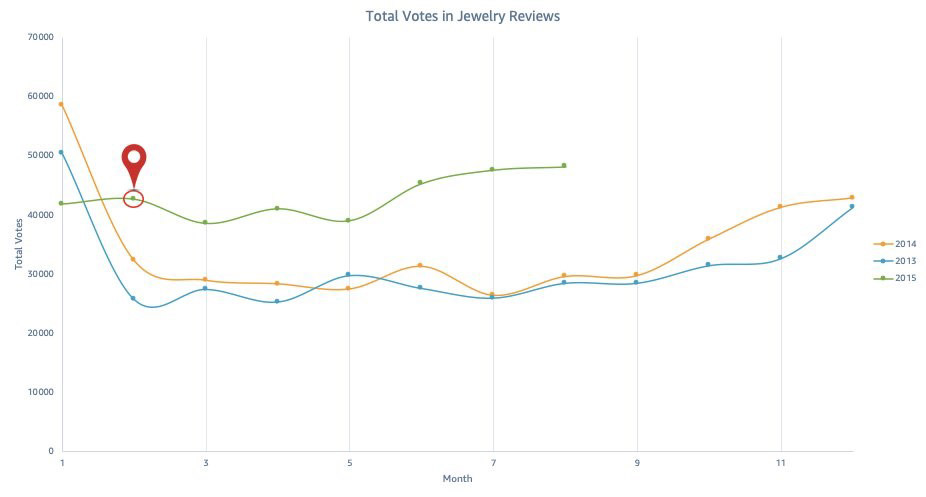
How can we detect similar events like these in new data?
With PyDeequ, you can easily identify anomalies without any visuals. February 2015 is outside the calculated forecast range; therefore, PyDeequ flags the data point as anomalous. This post demonstrates using PyDeequ’s anomaly detection to get email notifications for anomalous events, which look like the following screenshot.

Solution architecture
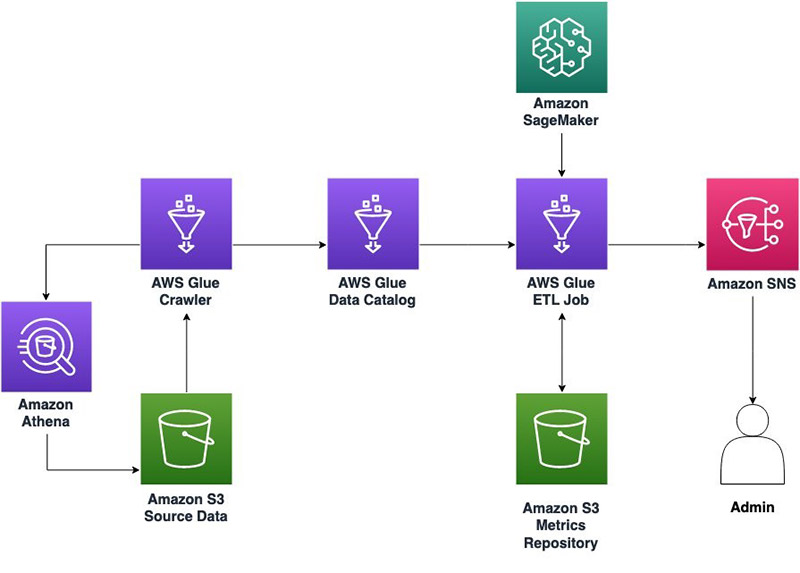
With Amazon Athena and an AWS Glue crawler, you can create an AWS Glue Data Catalog to access the Amazon Simple Storage Service (Amazon S3) data source. This allows the data to be easily queried for usage downstream. You can use an Amazon SageMaker notebook with a configured AWS Glue development endpoint to interact with your AWS Glue ETL jobs. We configure our AWS Glue ETL jobs to use PyDeequ to store results in Amazon S3, and use Amazon Simple Notification Service (Amazon SNS) to notify administrators of any anomalies.
The following diagram illustrates this architecture.
Solution overview
To implement this solution, you complete the following high-level steps:
- Create an SNS topic.
- Upload PyDeequ and Deequ to Amazon S3.
- Create an AWS Identity and Access Management (IAM) role for AWS Glue.
- Crawl, query, and create your dataset.
- Transform the dataset into a table.
- Create an AWS Glue development endpoint.
- Create a SageMaker notebook to interface with the endpoint.
- Create a new AWS Glue session.
- Extract the table.
- Transform the table.
- Use PyDeequ to detect anomalous data points.
Create an SNS topic
Complete the following steps to create your SNS topic:
- On the Amazon SNS console, choose Topics.
- Choose Create topic.
- For Type, choose Standard.
- For Name, enter
jewelry_hw. - For Display name, enter
Holt Winters Anomaly Example.
- Choose Create Topic.
- On the details page for the topic you just created, under Subscription, choose Create subscription.
- For Protocol, choose Email.
- For Endpoint, enter the email you want to receive the notification.
- Choose Create subscription. An email is sent to the entered endpoint.
- Open the email message and choose Confirm subscription.

Upload PyDeequ and Deequ to Amazon S3
In this step, you create an S3 bucket and upload PyDeequ and Deequ.
- On the Amazon S3 console, create a new bucket. We reference it as <__YOUR_BUCKET__> throughout this post.
- Inside your bucket, create a folder called
dependencies. - Download the
deequ-1.0.3.jarfile. - Create a .zip file for PyDeequ by compressing the folder that contains the
__init__.pyfile. - Upload the Deequ and PyDeequ file to your
dependenciesfolder.
If you’re on a *nix operating system or have the AWS Command Line Interface (AWS CLI) configured, you can use the following code:
$ wget https://repo1.maven.org/maven2/com/amazon/deequ/deequ/1.0.3/deequ-1.0.3.jar
$ git clone https://github.com/awslabs/python-deequ.git
$ cd python-deequ && zip -r ../pydeequ.zip pydeequ && cd ../
$ aws s3 cp deequ-1.0.3.jar s3://<__YOUR_BUCKET__>/dependencies/
$ aws s3 cp pydeequ.zip s3://<__YOUR_BUCKET__>/dependencies/
Create an IAM role for AWS Glue
You now create an IAM role for AWS Glue and attach the required policies.
- On the IAM console, choose Roles.
- Choose Create a role.
- For Trusted entity, choose AWS Service.
- For Use case, choose Glue.
- Choose Next.
- Add the following policies to the role:
AWSGlueServiceRoleAWSGlueConsoleSageMakerNotebookFullAccess
- Add an inline policy to the role with the following JSON code.
Be sure to replace the resource values in the code. If you’re unsure what your Athena query outputs location is in Amazon S3, you can find it on the Settings tab on the Athena console.
{
    "Version": "2012-10-17",
    "Statement": [
        {
            "Effect": "Allow",
            "Action": [
                "s3:Put*",
                "s3:Get*",
                "s3:Create*",
                "s3:Delete*"
            ],
            "Resource": [
                "arn:aws:s3:::<__YOUR_BUCKET__>/*",
                "arn:aws:s3:::<__ATHENA_QUERY_OUTPUTS_BUCKET__>/*",
                "arn:aws:s3:::amazon-reviews-pds/parquet/*"
            ]
        },
        {
            "Effect": "Allow",
            "Action": "sns:Publish",
            "Resource": "arn:aws:sns:*:*:jewelry_hw"
        }
    ]
}
Crawl, query, and create the dataset
First, you use an AWS Glue crawler to add the AWS Customer Reviews Dataset to the Data Catalog.
- On the Athena console, choose Connect Data Source.
- For Choose where your data is located, select Query data in Amazon S3.
- For Choose a metadata catalog, select AWS Glue data catalog.

- Choose Set up a crawler in AWS Glue to retrieve schema information automatically.
- Choose Connect to AWS Glue.
- For Crawler Name, enter
jewelry_dataset_crawler. - Choose Next.
- Choose Next again.
- For Crawler Source Type, choose Data stores.
- For Repeat crawls of S3 data stores, choose Crawl all folders.
- Choose Next.
- For Choose a data store, choose S3.
- For Crawl data in, select Specified path in another account.
- For Include path, enter:
s3://amazon-reviews-pds/parquet/.
- Choose Next.
- In the Choose an IAM role section, select Choose an existing IAM role.
- Choose the IAM role we created earlier.
- Choose Next.

- Under Frequency, choose Run on Demand.
Alternatively, to test incoming data in the Data Catalog, you can change the frequency of the crawler.
- Choose Next.
- For Database, choose Add Database and enter
jewelry_db. - Choose Next.
- Review the crawler properties and choose Finish.

- Run the data crawler.
Transform the dataset into a table
Next, we transform the AWS Customer Reviews Dataset into a table with Athena.
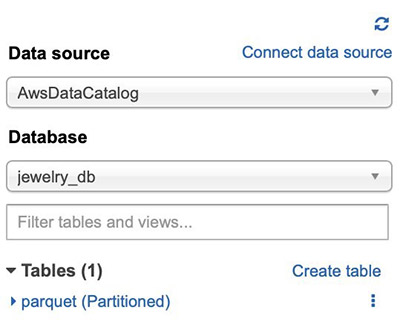
- On the Athena console, under Database, choose the
jewelry_dbtable.
The table parquet(Partitioned) should be listed under Tables. If the database doesn’t show up, choose the refresh icon above Connect data source.
Now let’s create a second table from this dataset. This table includes three columns, which contain where data has a product category jewelry and the marketplace is US. We use US as a filter to closely match holiday seasonal trends.
- Enter the following query:
/*Athena jewelry dataset*/ CREATE TABLE jewelry_db.jewelry_dataset WITH ( format='PARQUET' ) AS SELECT total_votes, year, Date_FORMAT(review_date, '%Y-%c-01') AS review_date FROM parquet WHERE product_category = 'Jewelry' AND marketplace = 'US' ORDER BY review_date DESC - Choose Run Query.
Under Tables, a new data table has been added called jewelry_dataset.

Create an AWS Glue development endpoint
To create your AWs Glue development endpoint, complete the following steps:
- On the AWS Glue console, choose Dev Endpoints.
- Choose Add endpoint.
- For Development endpoint name, enter
jewelry_hw_example. - In the IAM role section, select Choose an existing IAM role and choose the IAM role we created earlier.
- Under Python Library Path, choose the folder icon to navigate to the
pydeequ.zipfile in your S3 bucket.
- Under Dependent Jars Path, choose the folder icon to select the
deequ-1.0.3.jarfile in your S3 bucket.
- For AWS Glue Version, choose Spark 2.4, Python 3 (Glue Version 1.0).

- Choose Next.
- Review your settings and choose Finish.
Create a SageMaker notebook to interface with our endpoint
You’re redirected to the dev endpoint page. Under Provisioning Status, it currently says Provisioning. Wait until that changes to Ready. This may take more than 5 minutes.
- On the AWS Glue console, choose Notebooks.
- Choose Create notebook.
- For Notebook name, enter
jewelry-hw. - For Attach to development endpoint, choose jewelry_hw_example.
- Select Create an IAM Role.
- For IAM role, enter a name for your role.
- Choose Create notebook.

Now we can do our data analysis! You can walk through the following sections in your newly created SageMaker notebook.
Create an AWS Glue session
To create your AWS Glue session, complete the following steps:
- In your SageMaker notebook instance, choose New.
- Choose Sparkmagic (PySpark).
This creates a new notebook for you with a Sparkmagic (PySpark) kernel.
- Create an AWS Glue session using the following code:
import sys from awsglue.utils import getResolvedOptions from pyspark.context import SparkContext from awsglue.context import GlueContext glueContext = GlueContext(SparkContext.getOrCreate()) session = glueContext.spark_session # UPDATE ME: topic_arn = "<__SNS_TOPIC_ARN__>" s3_bucket = "<__S3_BUCKET_NAME__>" region = "<__REGION_YOUR_DEV_ENDPOINT_AND_SNS_TOPIC_ARE_IN__>"
Extract the table

- CRISP DETAIL, CLEAR DISPLAY: Enjoy binge-watching...
- PRO SHOTS WITH EASE: Brilliant sunrises, awesome...
- CHARGE UP AND CHARGE ON: Always be ready for an...
- POWERFUL 5G PERFORMANCE: Do what you love most —...
- NEW LOOK, ADDED DURABILITY: Galaxy A54 5G is...

- Free 6 months of Google One and 3 months of...
- Pure Performance: The OnePlus 12 is powered by the...
- Brilliant Display: The OnePlus 12 has a stunning...
- Powered by Trinity Engine: The OnePlus 12's...
- Powerful, Versatile Camera: Explore the new 4th...
Last update on 2024-04-05 / Affiliate links / Images from Amazon Product Advertising API
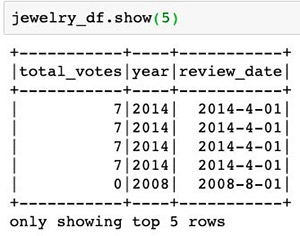
You extract the data table jewelry_dataset and turn it into to a DataFrame so that it can be used with PyDeequ. Next, you use the dropDuplicates method to remove any potential duplicates within the dataset. See the following code:
jewelry_dyf = glueContext.create_dynamic_frame.from_catalog(database="jewelry_db", table_name="jewelry_dataset")
jewelry_df = jewelry_dyf.toDF()
jewelry_df.dropDuplicates()
The following screenshot shows your output.
Transform the table
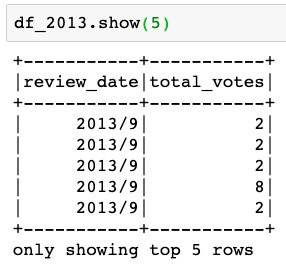
We can further simply the jewelry_df table by using the date_format method to change the column to only show the month and year of total_votes. Afterwards, we can filter jewelry_df2 by year to contain only the two columns needed. See the following code:
import pyspark.sql.functions as f

jewelry_df2 = jewelry_df.withColumn('review_date', f.date_format('review_date', 'yyyy/M'))\
.orderBy('review_date', ascending = False)

df_2013 = jewelry_df2.filter("year ='2013'").select("review_date","total_votes")
df_2014 = jewelry_df2.filter("year ='2013'").select("review_date","total_votes")
df_2015 = jewelry_df2.filter("year ='2013'").select("review_date","total_votes")
We can use df_2013.show(10) to see an iteration of what our data table looks like before iterating through PyDeequ. The following screenshot shows our output.
Use PyDeequ to detect anomalous data points
For this post, we demonstrate detecting anomalous data points with the FileSystemMetricsRepository class. A metrics repository is stored in JSON format to be used as a data quality report over time in Amazon S3, HDFS, or in memory. The variable s3_write_path is where you want your JSON file to be stored within Amazon S3. See the following code:
s3_write_path = f"s3://{s3_bucket}/tmp/holt_winters_tutorial.json"
import pydeequ
from pydeequ.repository import *
metricsRepository = FileSystemMetricsRepository(session,s3_write_path)
We now load the 2013–2014 dataset into metrics.
If your dataset is collected monthly, and follows an annual seasonal trend, use the MetricInterval.Monthly and SeriesSeasonality.Yearly metrics. This selection requires you to collect at least 25 data points. The initial 24 data points are monthly values from 2013–2014, which we use to create the Holt Winters model. The values in 2015 are the forecasted points, which could can concede an anomalous value.
As shown in the following code, we create a for loop that iterates through df_2013. We use month to create a date to later help us query values from df_2013. The filter method allows us create a df data frame that contains the total_votes values by month (for this post, the first iteration is a table of values from January 2013).
Next, each set of metrics that we computed needs be indexed by a ResultKey, which contains a timestamp and supports arbitrary tags in the form of key-value pairs.
Finally, we create a VerificationSuite. We make PyDeequ write and store our metrics in Amazon S3 by adding the useRepository and saveOrAppendResult method. Then we add Holt Winters with a Sum analyzer to calculate monthly total_votes. See the following code:
from pydeequ.verification import *

for year in ['2013','2014']:
    for month in range(1,13):
        date = f"\'{year}/{month}\'"
        df = df_2013.filter(f"review_date = {date}")

        key_tags = {'tag':  date}
        result_key_2013 = ResultKey(session, ResultKey.current_milli_time(), key_tags)

        jewelry_result = VerificationSuite(session).onData(df)\
            .useRepository(metricsRepository) \
            .saveOrAppendResult(result_key_2013) \
            .addAnomalyCheck(HoltWinters(MetricInterval.Monthly, SeriesSeasonality.Yearly), Sum('total_votes'))\
            .run()
Great! We have created the trend for the Holt Winters algorithm. Now it’s time to detect any anomalies within 2015.
Create another Holt Winters anomaly check similar to the 2013–2014 dataset, except iterate only to August (because the dataset only goes to August of 2015). For each month, we check for an anomaly using jewelry_result.status. If it’s not a success, that means an anomaly has been detected. Collect the constraint_message to see the error value. Use publish to create an SNS notification. Include the topicArn that we created in Amazon SNS, a Message, subject, and MessageAttribute. If an anomaly has been detected, break out of the loop. See the following code:
# Use AWS SNS
import boto3
import json

# Topic for AWS SNS
snsClient = boto3.client('sns', region_name = region)

for month in range(1,9):
    date = "\'2015" +'/'+str(month)+"\'"
    df = df_2015.filter("review_date =" + date)
    key_tags = {'tag':  date}
    result_key_2015 = ResultKey(session, ResultKey.current_milli_time(), key_tags)

    jewelry_result = VerificationSuite(session).onData(df)\
        .useRepository(metricsRepository) \
        .saveOrAppendResult(result_key_2015) \
        .addAnomalyCheck(HoltWinters(MetricInterval.Monthly, SeriesSeasonality.Yearly), Sum('total_votes'))\
        .run()

    df = VerificationResult.checkResultsAsDataFrame(session, jewelry_result)

    if (jewelry_result.status != "Success"):
        print("Anomaly for total_votes has been detected")
        print(date)
        message = df.select("constraint_message").collect()
        response = snsClient.publish(TopicArn = topic_arn,
                             Message = "anomaly detected in data frame: \n" + json.dumps(message),
                             Subject = "Anomaly Detected in the jewelry dataset:"+ date,
                             MessageAttributes = {"TransactionType":
                                            {"DataType": "String.Array", "StringValue": "Anomaly Detected in Glue"}})
        break
After completing this tutorial, you should receive an email notification stating an anomaly has been detected for February 2015. This coincides with our hypothesis that PyDeequ will flag the same anomaly from the graph!
More on using AWS Glue and PyDeequ
This post shows how you can start exploring anomaly detection with PyDeequ. This simple tutorial is just the beginning of what you can do with AWS Glue. To add to this tutorial, you can create a time-based schedule for jobs and crawlers to run every time a dataset is appended.
Alternatively, you can use the different modules provided by PyDeequ and its tutorials, or the use case examples provided at the beginning of this post to further understand the dataset.
Resource cleanup

- 【Octa-Core CPU + 128GB Expandable TF Card】...
- 【6.8 HD+ Android 13.0】 This is an Android Cell...
- 【Dual SIM and Global Band 5G Phone】The machine...
- 【6800mAh Long lasting battery】With the 6800mAh...
- 【Business Services】The main additional...

- 【Dimensity 9000 CPU + 128GB Expandable TF...
- 【6.8 HD+ Android 13.0】 This is an Android Cell...
- 【Dual SIM and Global Band 5G Phone】Dual SIM &...
- 【6800mAh Long lasting battery】The I15 Pro MAX...
- 【Business Services】The main additional...

- 🥇【6.8" HD Unlocked Android Phones】Please...
- 💗【Octa-Core CPU+ 256GB Storage】U24 Ultra...
- 💗【Support Global Band 5G Dual SIM】U24 Ultra...
- 💗【80MP Professional Photography】The U24...
- 💗【6800mAh Long Lasting Battery】With the...
Last update on 2024-04-05 / Affiliate links / Images from Amazon Product Advertising API
Clean up the resources created in this post when you’re finished:
- IAM roles – Deleting roles or instance profiles
- IAM policy – Deleting an IAM role (console)
- AWS Glue table – DeleteTable
- AWS Glue crawler – DeleteCrawler
- AWS Glue dev endpoint – DeleteDevEndpoint
- AWS Glue dev endpoint SageMaker notebook – DeleteNotebookInstance
- S3 bucket – Deleting a bucket
- SNS topic – DeleteTopic
Conclusion
This post demonstrates the basics of detecting anomalies using PyDeequ and AWS Glue. Anomaly detection relies on the metrics repository file. This repository can easily be stored within Amazon S3, HDFS, or in memory as a JSON object for future test usage and AWS Glue ETL jobs. In addition to AWS Glue, PyDeequ can function within Amazon EMR and SageMaker in order to best handle the needs of your data pipeline.
This approach allows you to improve the quality and your own knowledge of your dataset. You can also apply this tool to a variety of business scenarios. The contents of this tutorial are for demonstration purposes and not production workloads. Be sure to follow security best practices for handling data at rest and in transit when you adapt PyDeequ into your workflows.
About the Authors
Joan Aoanan is a ProServe Consultant at AWS. With her B.S. Mathematics-Computer Science degree from Gonzaga University, she is interested in integrating her interests in math and science with technology.
Veronika Megler, PhD, is Principal Data Scientist for Amazon.com Consumer Packaging. Until recently she was the Principal Data Scientist for AWS Professional Services. She enjoys adapting innovative big data, AI, and ML technologies to help companies solve new problems, and to solve old problems more efficiently and effectively. Her work has lately been focused more heavily on economic impacts of ML models and exploring causality.
Calvin Wang is a Data Scientist at AWS AI/ML. He holds a B.S. in Computer Science from UC Santa Barbara and loves using machine learning to build cool stuff.