Grafana is a popular open-source analytics platform that you can employ to create, explore, and share your data through flexible dashboards. Its use cases include application and IoT device monitoring, and visualization of operational and business data, among others. You can create your dashboard with your own datasets or publicly available datasets related to your industry.
In November 2021, the AWS team together with Grafana Labs announced the
Athena data source plugin for Grafana. The feature allows you to visualize information on a Grafana dashboard using data stored in Amazon Simple Storage Service (Amazon S3) buckets, with help from Amazon Athena, a serverless interactive query service. In addition, you can provision Grafana dashboards using Amazon Managed Grafana, a fully managed service for open-source Grafana and Enterprise Grafana.
In this post, we show how you can create and configure a dashboard in Amazon Managed Grafana that queries data stored on Amazon S3 using Athena.
Solution overview
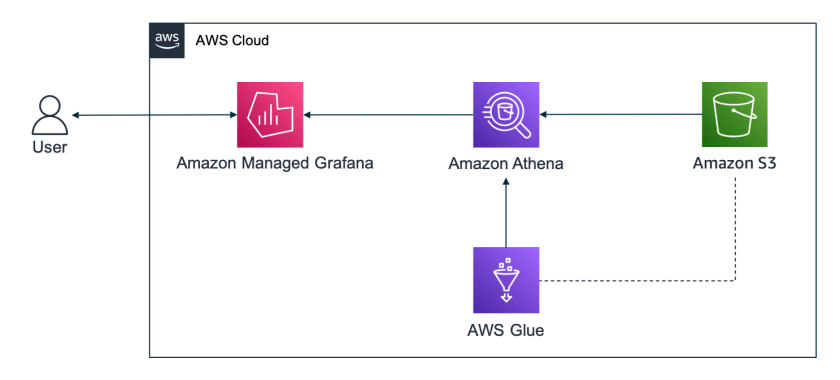
The following diagram is the architecture of the solution.

The solution is comprised of a Grafana dashboard, created in Amazon Managed Grafana, populated with data queried using Athena. Athena runs queries against data stored in Amazon S3 using standard SQL. Athena integrates with the AWS Glue Data Catalog, a metadata store for data in Amazon S3, which includes information such as the table schema.
To implement this solution, you complete the following high-level steps:
- Create and configure an Athena workgroup.
- Configure the dataset in Athena.
- Create and configure a Grafana workspace.
- Create a Grafana dashboard.
Create and configure an Athena workgroup
By default, the AWS Identity and Access Management (IAM) role used by Amazon Managed Grafana has the AmazonGrafanaAthenaAccess IAM policy attached. This policy gives the Grafana workspace access to query all Athena databases and tables. More importantly, it gives the service access to read data written to S3 buckets with the prefix grafana-athena-query-results-. In order for Grafana to be able to read the Athena query results, you have two options:
- Create a bucket named
grafana-athena-query-results-<name>, create a new Athena workgroup, and configure it to write query results to the bucket. - After creating a Grafana workspace, create a separate IAM policy giving the Grafana workspace IAM role access to the bucket used by Athena to output results. This option is not covered in this blog. For more information, refer to Creating policies with the visual editor and Identity-based policy examples for Amazon Managed Grafana.
In this post, we go with the first option. To do that, complete the following steps:
- Create an S3 bucket named
grafana-athena-query-results-<name>. Replace<name>with a unique name of your choice. - On the Athena console, choose Workgroups in the navigation pane.
- Choose Create workgroup.
- Under Workgroup name, enter a unique name of your choice.
- For Query result configuration, choose Browse S3.
- Select the bucket you created and choose Choose.
- For Tags, choose Add new tag.
- Add a tag with the key
GrafanaDataSourceand the valuetrue. - Choose Create workgroup.
It’s important that you add the tag described in steps 7–8. If the tag isn’t present, the workgroup won’t be accessible by Amazon Managed Grafana.
For more information about the Athena query results location, refer to Working with query results, recent queries, and output files.
Configure the dataset in Athena
For this post, we use the NOAA Global Historical Climatology Network Daily (GHCN-D) dataset, from the National Oceanic and Atmospheric Administration (NOAA) agency. The dataset is available in the Registry of Open Data on AWS, a registry that exists to help people discover and share datasets.
The GHCN-D dataset contains meteorological elements such as daily maximum and minimum temperatures. It’s a composite of climate records from numerous locations—some locations contain more than 175 years recorded.
The GHCN-D data is in CSV format and is stored in a public S3 bucket (s3://noaa-ghcn-pds/). You access the data through Athena. To start using Athena, you need to create a database:
- On the Athena console, choose Query editor in the navigation pane.
- Choose the workgroup, created in the previous step, on the top right menu.
- To create a database named
mydatabase, enter the following statement:
CREATE DATABASE mydatabase- Choose Run.
- From the Database list on the left, choose
mydatabaseto make it your current database.
Now that you have a database, you can create a table in the AWS Glue Data Catalog to start querying the GHCN-D dataset.
- In the Athena query editor, run the following query:
CREATE EXTERNAL TABLE `noaa_ghcn_pds`(
  `id` string,
  `year_date` string,
  `element` string,
  `data_value` string,
  `m_flag` string,
  `q_flag` string,
  `s_flag` string,
  `obs_time` string
)
ROW FORMAT SERDE
  'org.apache.hadoop.hive.serde2.OpenCSVSerde'
WITH SERDEPROPERTIES ('separatorChar'=',')
STORED AS INPUTFORMAT 'org.apache.hadoop.mapred.TextInputFormat'
OUTPUTFORMAT 'org.apache.hadoop.hive.ql.io.HiveIgnoreKeyTextOutputFormat'
LOCATION 's3://noaa-ghcn-pds/csv/'
TBLPROPERTIES ('classification'='csv')
After that, the table noaa_ghcn_pds should appear under the list of tables for your database. In the preceding statement, we define columns based on the GHCN-D data structure. For a full description of the variables and data structure, refer to the dataset’s readme file.
With the database and the table configured, you can start running SQL queries against the entire dataset. For the purpose of this post, you create a second table containing a subset of the data: the maximum temperatures of one weather station located in Retiro Park (or simply El Retiro), one of the largest parks of the city of Madrid, Spain. The identification of the station is SP000003195 and the element of interest is TMAX.
- Run the following statement on the Athena console to create the second table:
CREATE TABLE madrid_tmax WITH (format = 'PARQUET') AS
SELECT CAST(data_value AS real) / 10 AS t_max,
  CAST(
    SUBSTR(year_date, 1, 4) || '-' || SUBSTR(year_date, 5, 2) || '-' || SUBSTR(year_date, 7, 2) AS date
  ) AS iso_date
FROM "noaa_ghcn_pds"
WHERE id = 'SP000003195'
  AND element = 'TMAX'
After that, the table madrid_tmax should appear under the list of tables for your database. Note that in the preceding statement, the temperature value is divided by 10. That’s because temperatures are originally recorded in tenths of Celsius degrees. We also adjust the date format. Both adjustments make the consumption of the data easier.
Unlike the noaa_ghcn_pds table, the madrid_tmax table isn’t linked with the original dataset. That means its data won’t reflect updates made to the GHCN-D dataset. Instead, it holds a snapshot of the moment of its creation. That may not be ideal in certain scenarios, but is acceptable here.
Create and configure a Grafana workspace
The next step is to provision and configure a Grafana workspace and assign a user to the workspace.
Create your workspace

- CRISP DETAIL, CLEAR DISPLAY: Enjoy binge-watching...
- PRO SHOTS WITH EASE: Brilliant sunrises, awesome...
- CHARGE UP AND CHARGE ON: Always be ready for an...
- POWERFUL 5G PERFORMANCE: Do what you love most —...
- NEW LOOK, ADDED DURABILITY: Galaxy A54 5G is...

- Free 6 months of Google One and 3 months of...
- Pure Performance: The OnePlus 12 is powered by the...
- Brilliant Display: The OnePlus 12 has a stunning...
- Powered by Trinity Engine: The OnePlus 12's...
- Powerful, Versatile Camera: Explore the new 4th...
In this post, we use the AWS Single Sign-On (AWS SSO) option to set up the users. You can skip this step if you already have a Grafana workspace.
- On the Amazon Managed Grafana console, choose Create Workspace.
- Give your workspace a name, and optionally a description.
- Choose Next.
- Select AWS IAM Identity Center (successor to AWS SSO).
- For Permission type, choose Service Managed and choose Next.
- For Account access, select Current account.
- For Data sources, select Amazon Athena and choose Next.
- Review the details and choose Create workspace.
This starts the creation of the Grafana workspace.
Create a user and assign it to the workspace
The last step of the configuration is to create a user to access the Grafana dashboard. Complete the following steps:
- Create a user for your AWS SSO identity store if you don’t have one already.
- On the Amazon Managed Grafana console, choose All workspaces in the navigation pane.
- Choose your Grafana workspace to open the workspace details.
- On the Authentication tab, choose Assign new user or group.
- Select the user you created and choose Assign users and groups.
- Change the user type by selecting the user and on the Action menu, choose Make admin.
Create a Grafana dashboard
Now that you have Athena and Amazon Managed Grafana configured, create a Grafana dashboard with data fetched from Amazon S3 using Athena. Complete the following steps:
- On the Amazon Managed Grafana console, choose All workspaces in the navigation pane.
- Choose the Grafana workspace URL link.
- Log in with the user you assigned in the previous step.
- In the navigation pane, choose the lower AWS icon (there are two) and then choose Athena on the AWS services tab.
- Choose the Region, database, and workgroup used previously, then choose Add 1 data source.
- Under Provisioned data sources, choose Go to settings on the newly created data source.
- Select Default and then choose Save & test.
- In the navigation pane, hover over the plus sign and then choose Dashboard to create a new dashboard.
- Choose Add a new panel.
- In the query pane, enter the following query:
select iso_date as time, t_max from madrid_tmax where $__dateFilter(iso_date) order by iso_date- Choose Apply.
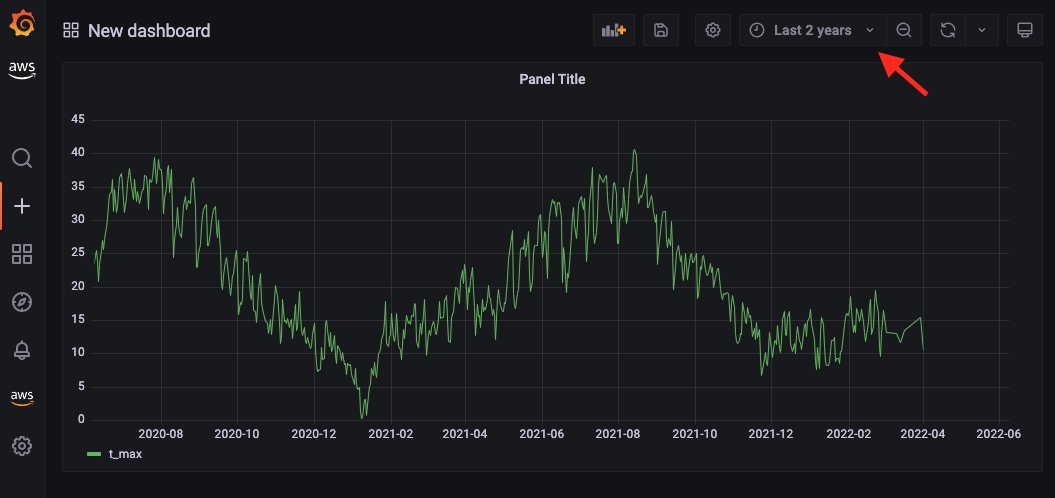
- Change the time range on the top right corner.
For example, if you change to Last 2 years, you should see something similar to the following screenshot.
Now that you’re able to populate your Grafana dashboard with data fetched from Amazon S3 using Athena, you can experiment with different visualizations and configurations. Grafana provides lots of options, and you can adjust your dashboard to your preferences, as shown in the following example screenshot of daily maximum temperatures.
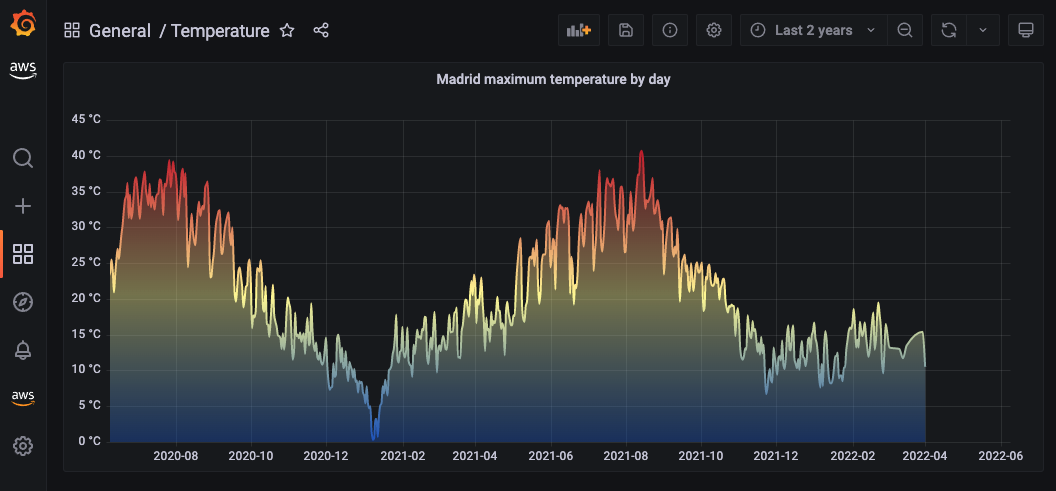
As you can see in this visualization, Madrid can get really hot on the summer!
For more information on how to customize Grafana visualizations, refer to Visualization panels.
Clean up

- 【Octa-Core CPU + 128GB Expandable TF Card】...
- 【6.8 HD+ Android 13.0】 This is an Android Cell...
- 【Dual SIM and Global Band 5G Phone】The machine...
- 【6800mAh Long lasting battery】With the 6800mAh...
- 【Business Services】The main additional...

- 【Dimensity 9000 CPU + 128GB Expandable TF...
- 【6.8 HD+ Android 13.0】 This is an Android Cell...
- 【Dual SIM and Global Band 5G Phone】Dual SIM &...
- 【6800mAh Long lasting battery】The I15 Pro MAX...
- 【Business Services】The main additional...

- 🥇【6.8" HD Unlocked Android Phones】Please...
- 💗【Octa-Core CPU+ 256GB Storage】U24 Ultra...
- 💗【Support Global Band 5G Dual SIM】U24 Ultra...
- 💗【80MP Professional Photography】The U24...
- 💗【6800mAh Long Lasting Battery】With the...
If you followed the instructions in this post in your own AWS account, don’t forget to clean up the created resources to avoid further charges.
Conclusion
In this post, you learned how to use Amazon Managed Grafana in conjunction with Athena to query data stored in an S3 bucket. As an example, we used a subset of the GHCN-D dataset, available in the Registry of Open Data on AWS.
Check out Amazon Managed Grafana and start creating other dashboards using your own data or other publicly available datasets stored in Amazon S3.
About the authors
Pedro Pimentel is a Prototyping Architect working on the AWS Cloud Engineering and Prototyping team, based in Brazil. He works with AWS customers to innovate using new technologies and services. In his spare time, Pedro enjoys traveling and cycling.
Rafael Werneck is a Senior Prototyping Architect at AWS Cloud Engineering and Prototyping, based in Brazil. Previously, he worked as a Software Development Engineer on Amazon.com.br and Amazon RDS Performance Insights.