
Dataflow is the industry-leading unified platform offering batch and stream processing. It is a fully managed service that comes with flexible development options (from Flex Templates & Notebooks to Apache Beam SDKs for Java, Python and Go) and a rich set of built-in management tools. It comes with seamless integrations with all Google Cloud products, such as Pub/Sub, BigQuery, VertexAI, GCS, Spanner, and BigTable, as well as third-party services and products, such as Kafka and AWS S3, to best meet your data movement use cases.
While our customers value these capabilities, they continue to push us to innovate and provide more value as the best batch and streaming data processing service to meet their ever-changing business needs.
Observability is a key area where the Dataflow team continues to invest more based on customer feedback. Adequate visibility into the state and performance of the Dataflow jobs is essential for business critical production pipelines.
In this post, we will review Dataflow’s key observability capabilities:
- Job visualizers – job graphs and execution details
- New metrics & logs
- New troubleshooting tools – error reporting, profiling, insights
- New Datadog dashboards & monitors
Dataflow observability at a glance
There is no need to configure or manually set up anything; Dataflow offers observability out of the box within the Google Cloud Console, from the time you deploy your job. Observability capabilities are seamlessly integrated with Google Cloud Monitoring and Logging along with other GCP products. This integration gives you a one-stop shop for observability across multiple GCP products, which you can use to meet your technical challenges and business goals.
Understanding your job’s execution: job visualizers
Questions: What does my pipeline look like? What’s happening in each step? Where’s the time spent?
Solution: Dataflow’s Job graph and Execution details tabs answer these questions to help you understand the performance of various stages and steps within the job
Job graph illustrates the steps involved in the execution of your job, in the default Graph view. The graph gives you a view of how Dataflow has optimized your pipeline’s code for execution, after fusing (optimizing) steps to stages. TheTable view informs you more about each step and the associated fused stages and time spent in each step and their statuses as the pipeline continues execution. Each step in the graph displays more information, such as the input and output collections and output data freshness; these help you analyze the amount of work done at this step (elements processed) and the throughput for it.
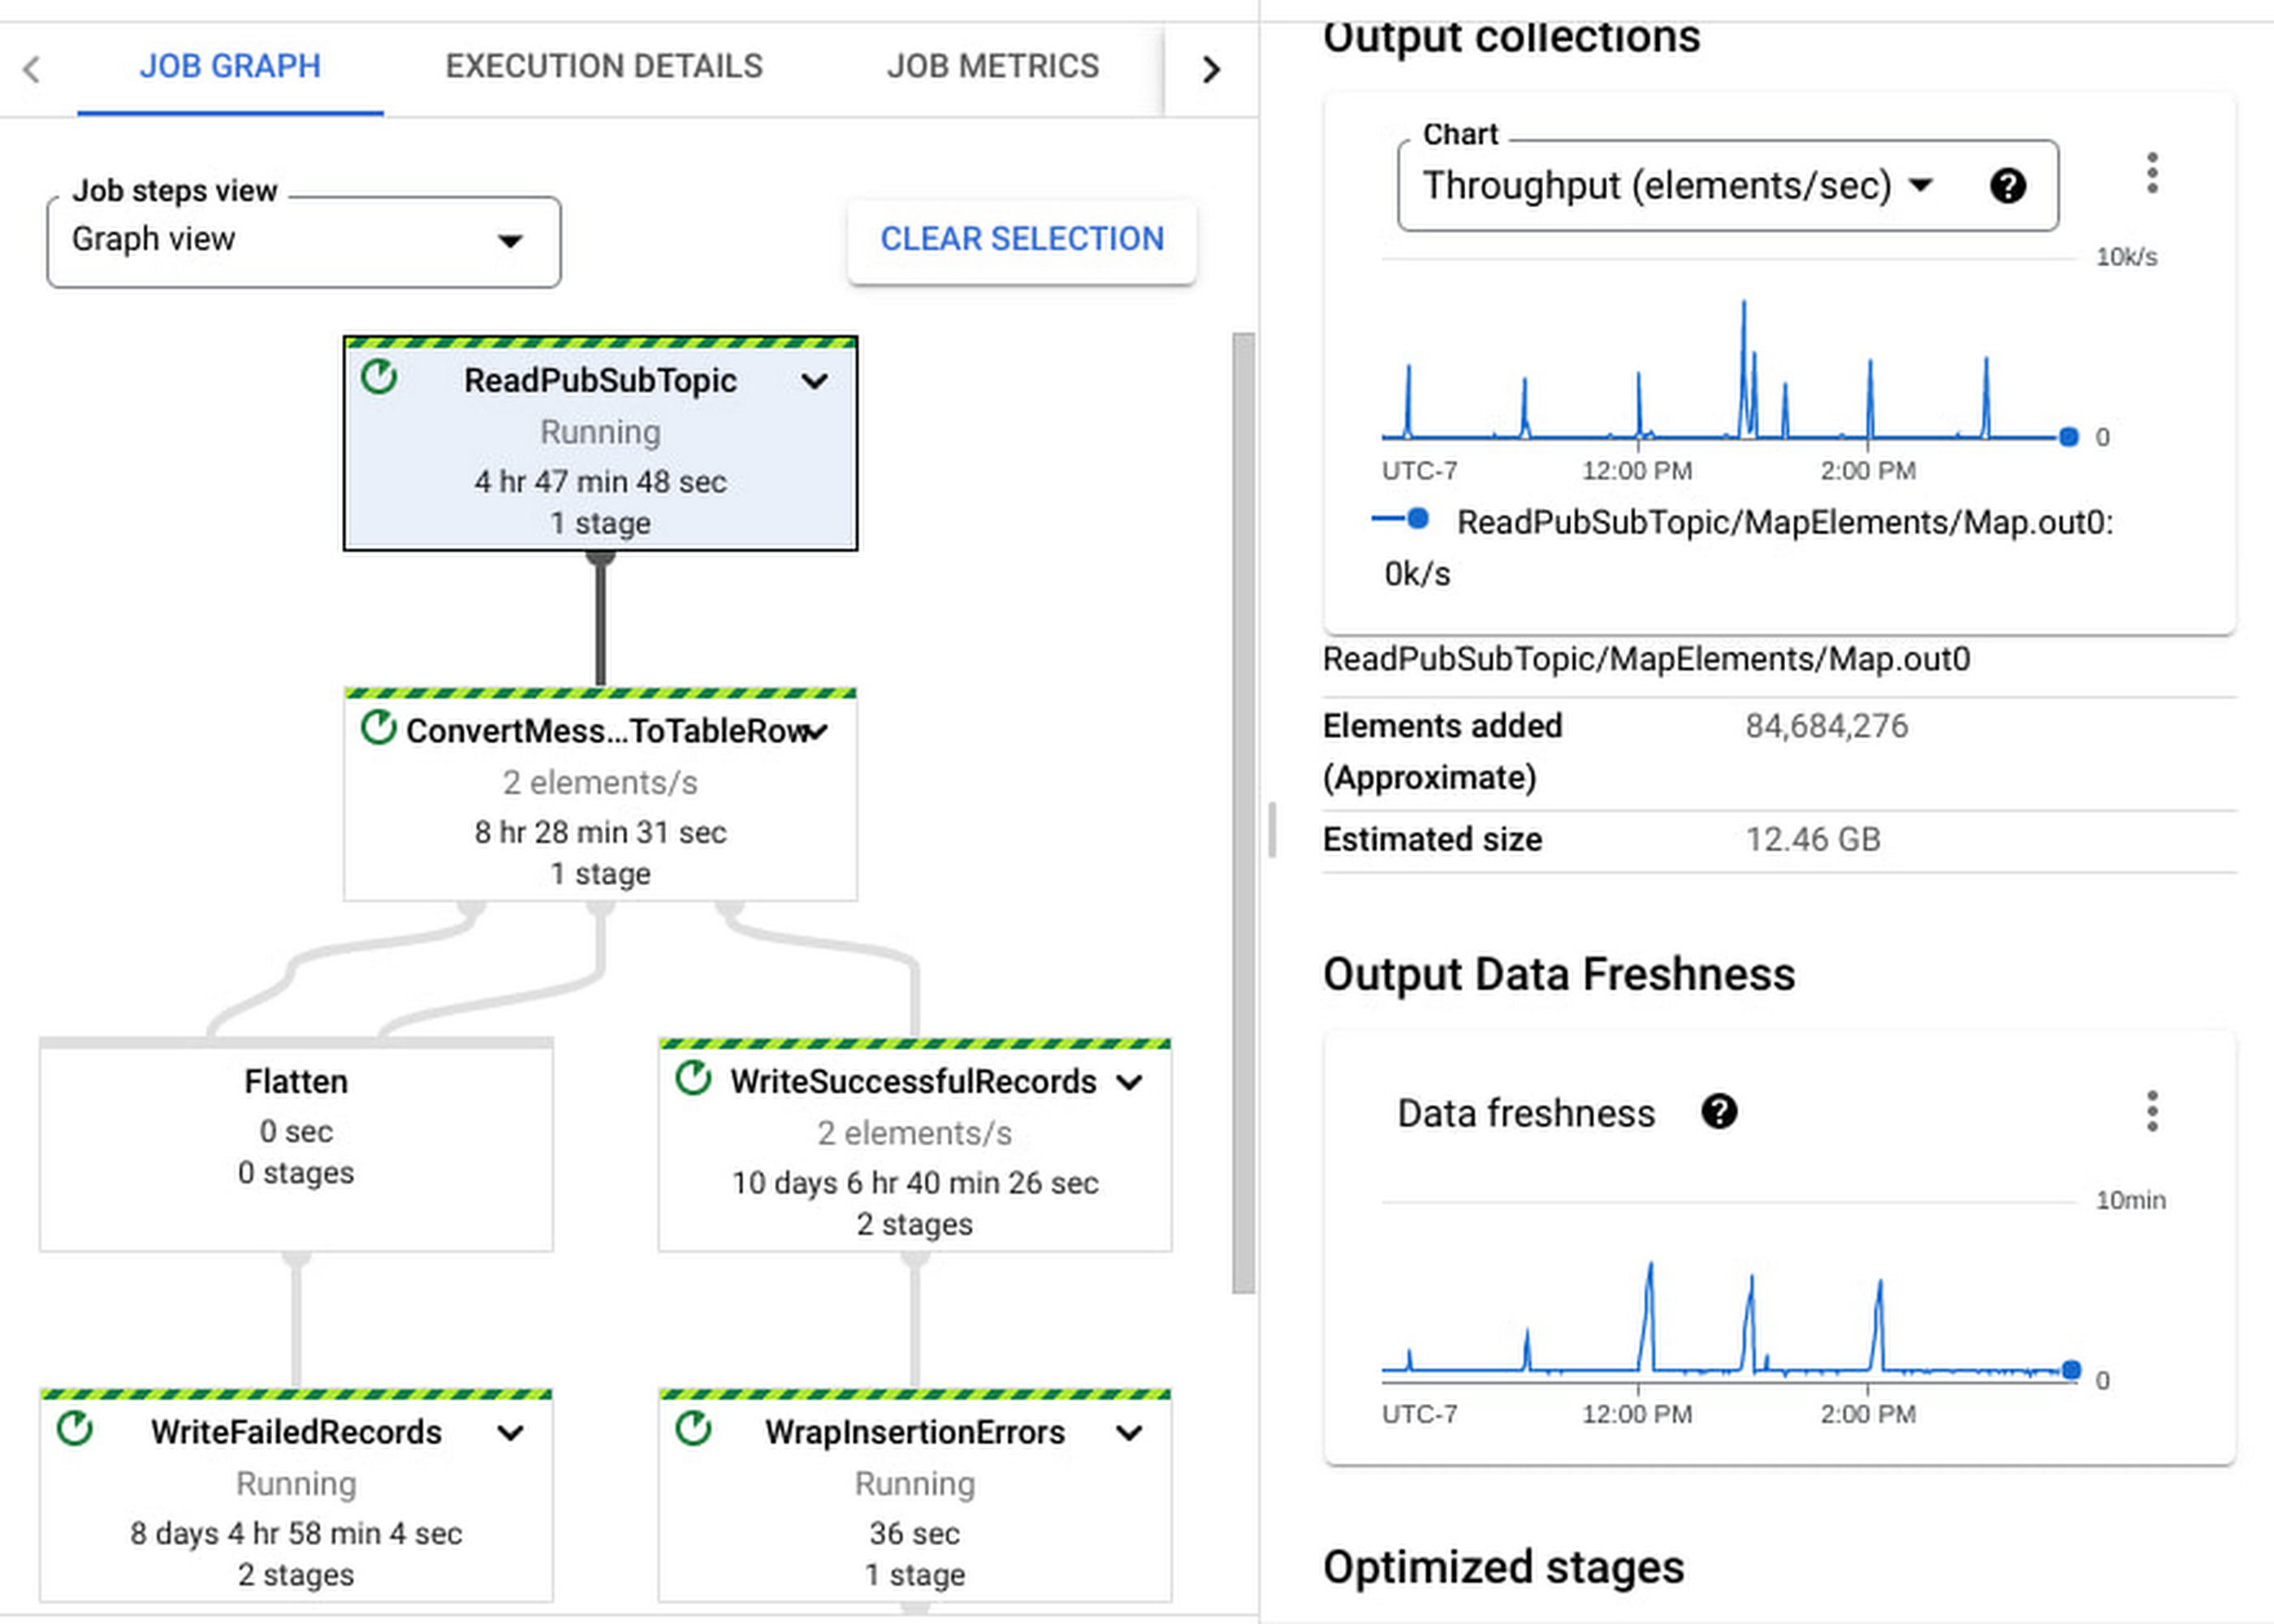
Execution Details has all the information to help you understand and debug the progress of each stage within your job. In the case of streaming jobs, you can view the data freshness of each stage. The Data freshness by stages chart includes anomaly detection: it highlights “potential slowness” and “potential stuckness” to help you narrow down your investigation to a particular stage. Learn more about using the Execution details tab for batch and streaming here.

Monitor your job with metrics and logs
Questions: What’s the state and performance of my jobs? Are they healthy? Are there any errors?
Solution: Dataflow offers several metrics to help you monitor your jobs.
A full list of Dataflow job metrics can be found in our metrics reference documentation. In addition to the Dataflow service metrics, you can view worker metrics, such as CPU utilization and memory usage. Lastly, you can generate Apache Beam custom metrics from your code.
Job metrics is the one-stop shop to access the most important metrics for reviewing the performance of a job or troubleshooting a job. Alternatively, you can access this data from the Metrics Explorer to build your own Cloud Monitoring dashboards and alerts.
Job and worker Logs are one of the first things that you can look at when you deploy a pipeline. You can access both these log types in the Logs panel on the Job details page.
Job logs include information about startup tasks, fusion operations, autoscaling events, worker allocation, and more. Worker logs include information about work processed by each worker within each step in your pipeline.
You can configure and modify the logging level and route the logs using the guidance provided in our pipeline log documentation.
Logs are seamlessly integrated into Cloud Logging. You can write Cloud Logging queries, create log-based metrics, and create alerts on these metrics.
New: Metrics for streaming Jobs
Questions: Is my pipeline slowing down or getting stuck? I want to understand how my code is impacting the job’s performance. I want to see how my sources and sinks are performing with respect to my job
Solution: We have introduced several new metrics for Streaming Engine jobs that help answer these questions. Notable metrics are listed below. All of these are now instantly accessible from the Job metrics tab.

The engineering teams at the Renault Group have been using Dataflow for their streaming pipelines as a core part of their digital transformation journey.
“Deeper observability of our data pipelines is critical to track our application SLOs,”said Elvio Borrelli, Tech Lead – Big Data at the Renault Digital Transformation & Data team. “The new metrics, such as backlog seconds and data freshness by stage, now provide much better visibility about our end-to-end pipeline latencies and areas of bottlenecks. We can now focus more on tuning our pipeline code and data sources for the necessary throughput and lower latency”.
To learn more about using these metrics in the Cloud console, please see the Dataflow monitoring interface documentation.

To learn how to use these metrics to troubleshoot common symptoms within your jobs, watch this webinar on Dataflow Observability: Dataflow Observability, Monitoring, and Troubleshooting
Debug job health using Cloud Error Reporting
Problem: There are a couple of errors in my Dataflow job. Is it my code, data, or something else? How frequently are these happening?
Solution: Dataflow offers native integration with Google Cloud Error Reporting to help you identify and manage errors that impact your job’s performance.
- This Certified Refurbished product is tested and...
- HP Elite 6200 Small Form Factor Desktop PC, Intel...
- Includes: USB Keyboard & Mouse, WiFi Adapter,...
- Ports: USB 2.0, DisplayPort, VGA, PS/2 keyboard,...
- Operating System: Windows 10 64 Bit –...

- 【High Speed RAM And Enormous Space】16GB DDR4...
- 【Processor】Intel Celeron J4025 processor (2...
- 【Display】21.5" diagonal FHD VA ZBD anti-glare...
- 【Tech Specs】2 x SuperSpeed USB Type-A 5Gbps...
- 【Authorized KKE Mousepad】Include KKE Mousepad
In the Logs panel on the Job details page, the Diagnostics tab tracks the most frequently occurring errors. This is integrated with Google Cloud Error Reporting, enabling you to manage errors by creating bugs or work items or by setting up notifications. For certain types of Dataflow errors, Error Reporting provides a link to troubleshooting guides and solutions.

New: Troubleshoot performance bottlenecks using Cloud Profiler
Problem: What part of my code is taking more time to process the data? What operations are consuming more CPU cycles or memory?
Solution: Dataflow offers native integration with Google Cloud Profiler, which lets you profile your jobs to understand the performance bottlenecks using CPU, memory, and I/O operation profiling support.
Is my pipeline’s latency high? Is it CPU intensive or is it spent time waiting for I/O operations? Or is it memory intensive? If so, which operations are driving this up? The flame graph helps you find answers to these questions. You can enable profiling for your Dataflow jobs by specifying a flag during job creation or while updating your job. To learn more see the Monitor pipeline performance documentation.

New: Optimize your jobs using Dataflow insights
Problem: What can Dataflow tell me about improving my job performance or reducing its costs?
Solution: You can review Dataflow Insights to improve performance or to reduce costs. Insights are enabled by default on your batch and streaming jobs; they are generated by auto-analyzing your jobs’ executions.
Dataflow insights is powered by the Google Active Assist’s Recommender service. It is automatically enabled for all jobs and is available free of charge. Insights include recommendations such as enabling autoscaling, increasing maximum workers, and increasing parallelism. Learn more about Dataflow insights in the Dataflow Insights documentation.

New: Datadog Dashboards & Recommended Monitors
Problem: I would like to monitor Dataflow in my existing monitoring tools, such as Datadog.
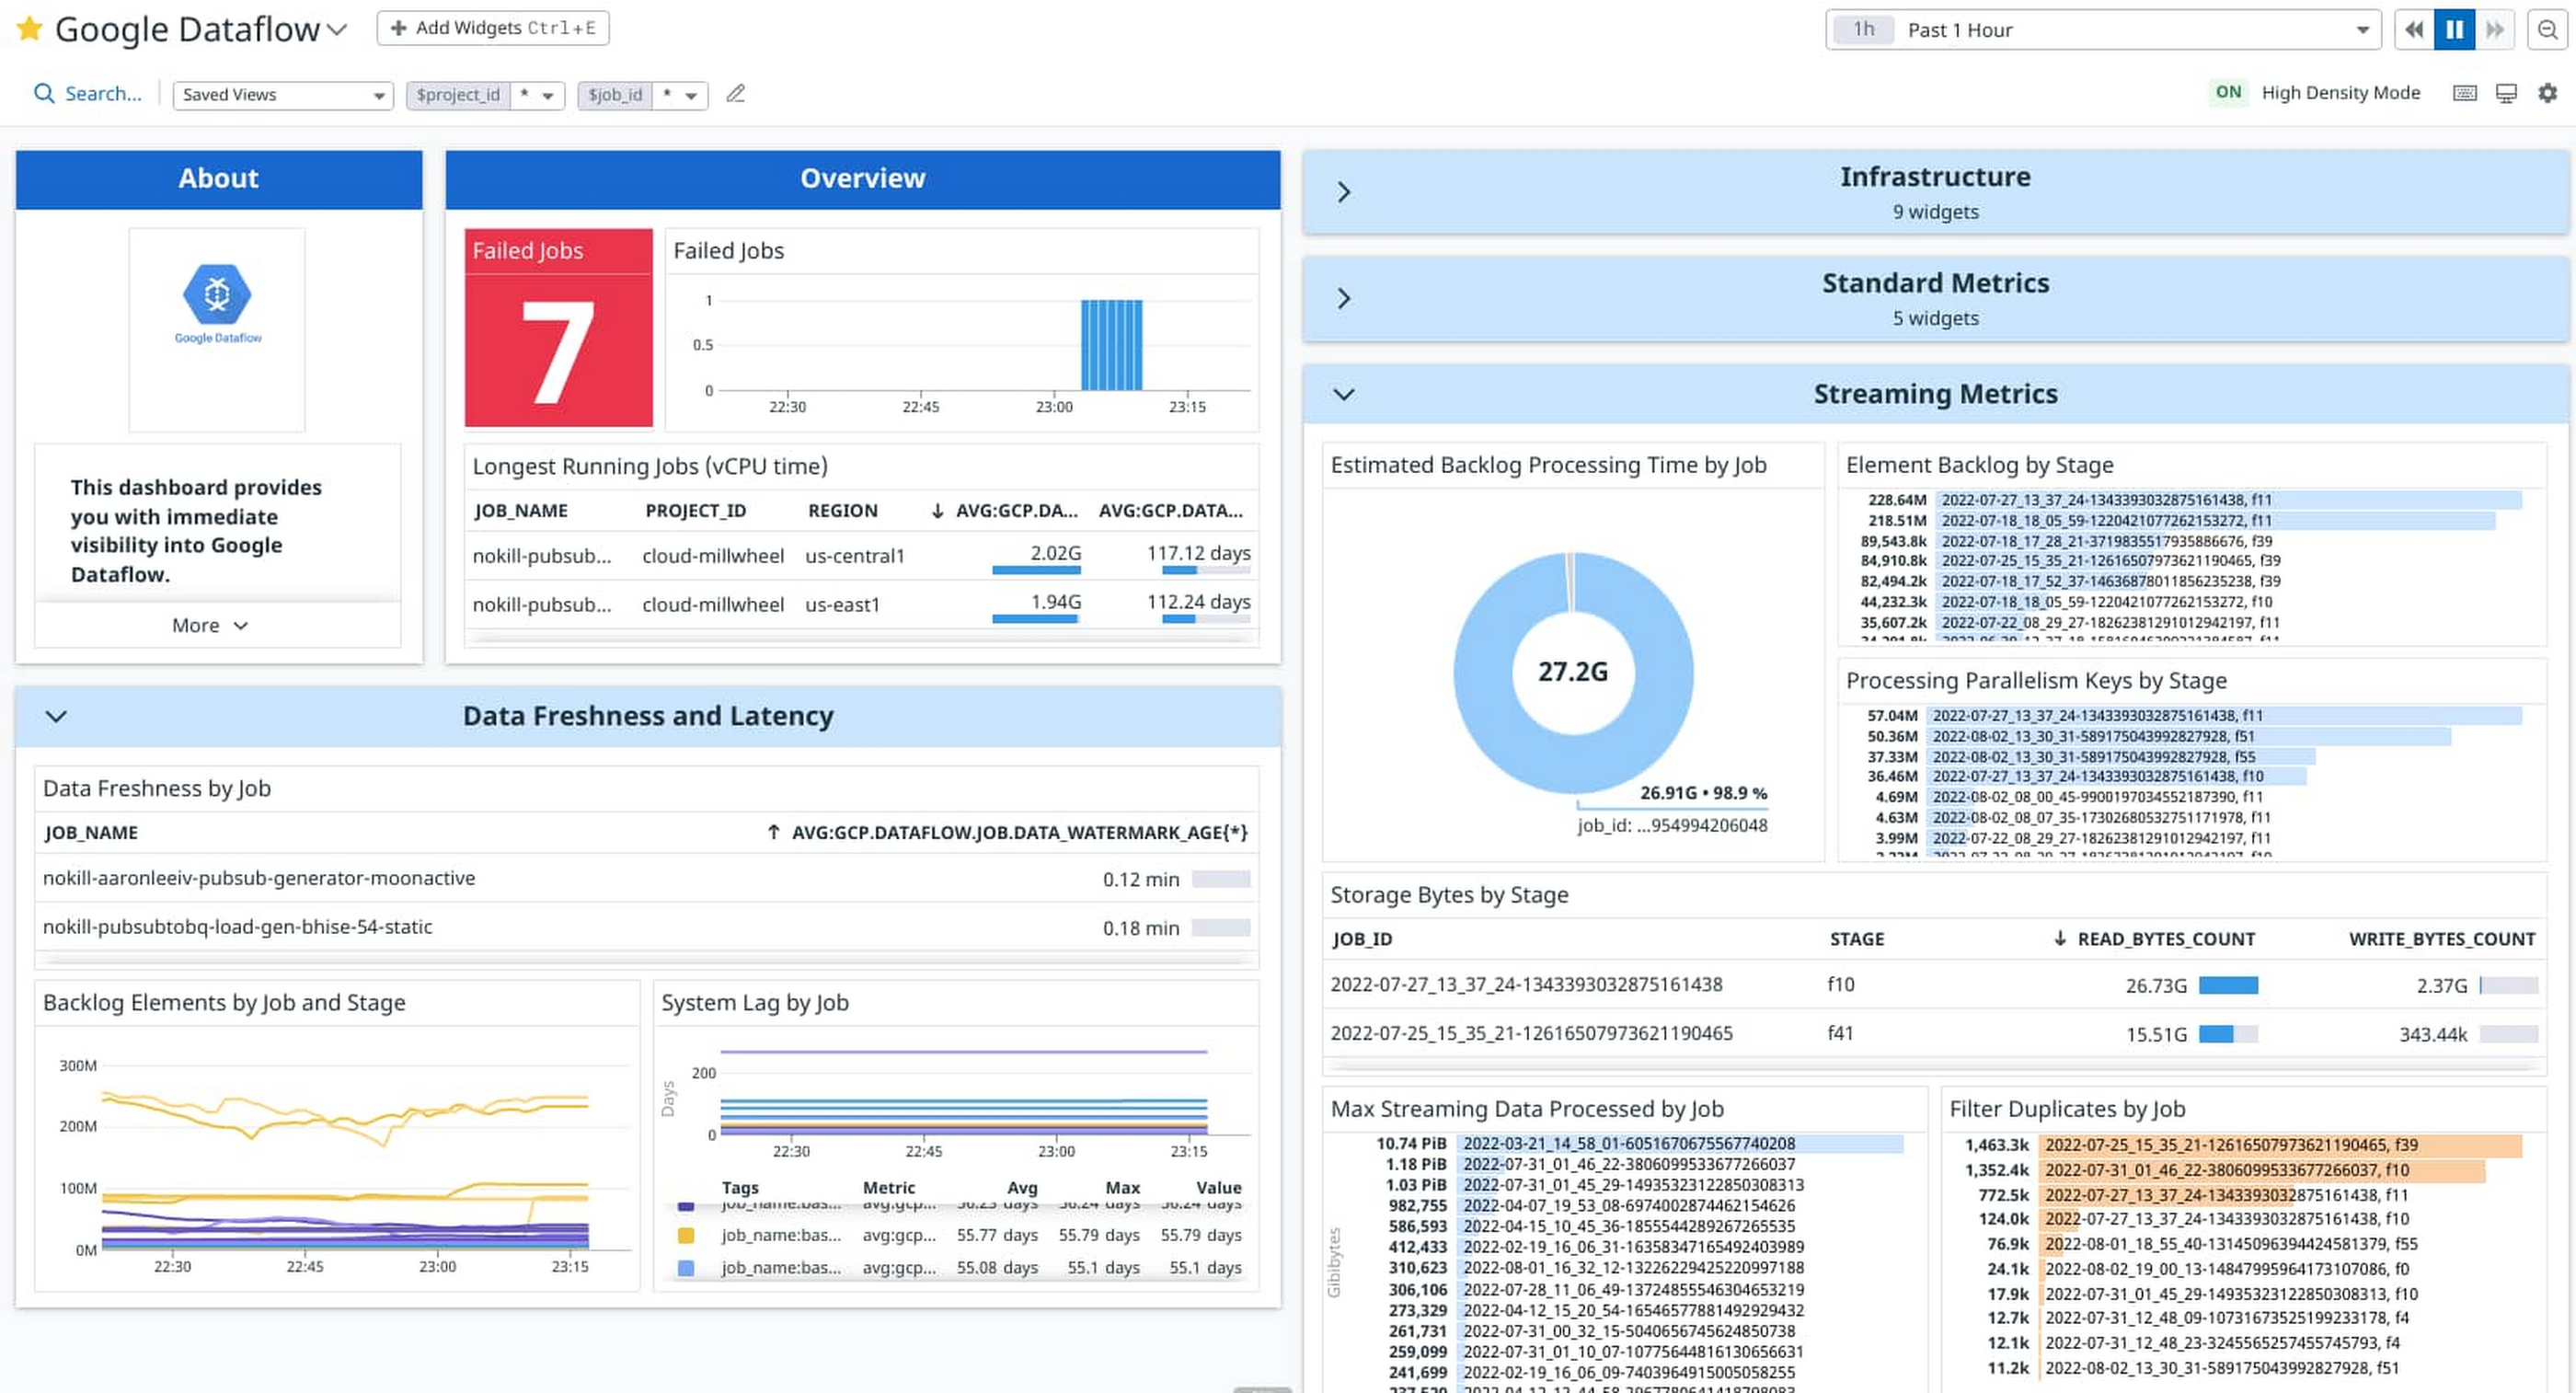
Solution: Dataflow’s metrics and logs are accessible in observability tools of your choice, via Google Cloud Monitoring and Logging APIs. Customers using Datadog can now leverage the out of the box Dataflow dashboards and recommended monitors to monitor their Dataflow jobs alongside other applications within the Datadog console. Learn more about Dataflow Dashboards and Recommended Monitors in their blog post on how to monitor your Dataflow pipelines with Datadog.
ZoomInfo, a global leader in modern go-to-market software, data, and intelligence, is partnering with Google Cloud to enable customers to easily integrate their business-to-business data into Google BigQuery. Dataflow is a critical piece of this data movement journey.
“We manage several hundreds of concurrent Dataflow jobs,” said Hasmik Sarkezians, ZoomInfo Engineering Fellow. “Datadog’s dashboards and monitors allow us to easily monitor all the jobs at scale in one place. And when we need to dig deeper into a particular job, we leverage the detailed troubleshooting tools in Dataflow such as Execution details, worker logs and job metrics to investigate and resolve the issues.”
What’s Next
Dataflow is leading the batch and streaming data processing industry with the best in class observability experiences.

- 【Processor】Intel Celeron N4120, 4 Cores & 4...
- 【Display】14.0-inch diagonal, HD (1366 x 768),...
- 【Storage】16GB high-bandwidth DDR4 Memory (2400...
- 【Connectivity】1 x USB 3.1 Type-C ports, 2 x...
- 【System】Windows 11 Home in S mode operating...
- Configured with AMD Ryzen 5 5600G Processor and...
- 8GB GeForce RTX 4060 GDDR6 dedicated graphics card...
- Liquid cooling system keeps internal components at...
- Integrated PCIE Wi-Fi provides excellent wireless...
- Includes USB Gaming RGB Mechanical Keyboard, Mouse...

- ✔【Display】 15.6" FHD (1920x1080) TN 220nits...
- ✔【Memory & Storage】RAM Size 16GB 3200MHz...
- ✔【Connectivity】 1x USB 2.0, 1x USB 3.2 Gen...
- ✔【Processor & Graphics】 12th Generation...
- ✔【Operating System】 Windows 11
But we are just getting started. Over the next several months, we plan to introduce more capabilities such as:
- Memory observability to detect and prevent potential out of memory errors.
- Metrics for sources & sinks, end-to-end latency, bytes being processed by a PTransform, and more.
- More insights – quota, memory usage, worker configurations & sizes.
- Pipeline validation before job submission.
- Debugging user-code and data issues using data sampling.
- Autoscaling observability improvements.
- Project-level monitoring, sample dashboards, and recommended alerts.
Got feedback or ideas? Shoot them over, or take this short survey.
Getting Started
To get started with Dataflow see the Cloud Dataflow quickstarts.
To learn more about Dataflow observability, review these articles: