
In the first post in our series , we discussed setting up a microservice observability architecture and application troubleshooting steps using log and trace correlation with Amazon OpenSearch Service. In this post, we discuss using PPL to create visualizations in operational panels, and creating a simple incident report using notebooks.
To try out the solution yourself, start from part 1 of the series.
Microservice observability with Amazon OpenSearch Service
|
Piped Processing Language (PPL)
PPL is a new query language for OpenSearch. It’s simpler and more straightforward to use than query DSL (Domain Specific Language), and a better fit for DevOps than ODFE SQL. PPL handles semi-structured data and uses a sequence of commands delimited by pipes (|). For more information about PPL, refer to Using pipes to explore, discover and find data in Amazon OpenSearch Service with Piped Processing Language.
The following PPL query retrieves the same record as our search on the Discover page in our previous post. If you’re following along, use your trace ID in place of <Trace-ID>:
source = sample_app_logs | where stream = 'stderr' and locate(‘<Trace-ID>’,`log`) > 0The query has the following components:
|separates commands in the statement.Source=sample_app_logsmeans that we’re searchingsample_app_logs.where stream = ‘stderr’, stream is a field insample_app_logs. We’re matching the value tostderr.- The locate function allows us to search for a string in a field. For our query, we search for the
trace_idin thelogfield. Thelocatefunction returns 0 if the string is not found, otherwise the character number where it is found. We’re testing thattrace_idis in the log field. This lets us find the entry that has the paymenttrace_idwith the error.
Note that log is PPL keyword, but also a field in our log file. We put backquotes around a field name if it’s also a keyword if we need to reference it in a PPL statement.
To start using PPL, complete the following steps:
- On OpenSearch Dashboards, choose Observability in the navigation pane.

- Choose Event analytics.

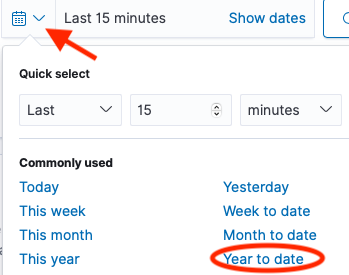
- Choose the calendar icon, then choose the time period you want for your query (for this post, Year to date).
- Enter your PPL statement.

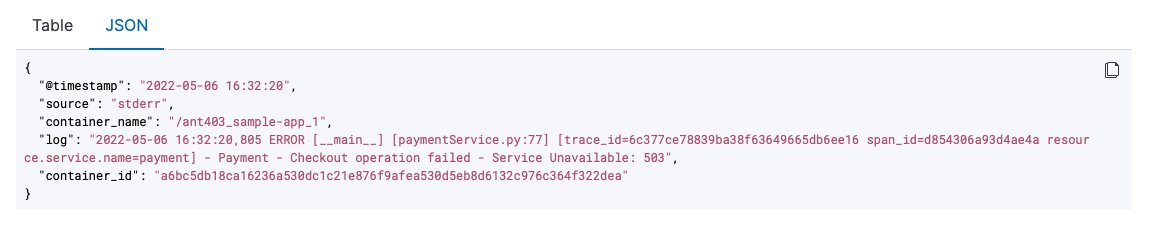
Note that results are shown in table format by default, but you can also choose to view them in JSON format.
Monitor your services using visualizations
We can use the PPL on the Event analytics page to create real-time visualizations. We now use these visualizations to create a dashboard for real-time monitoring of our microservices on the Operational panels page.
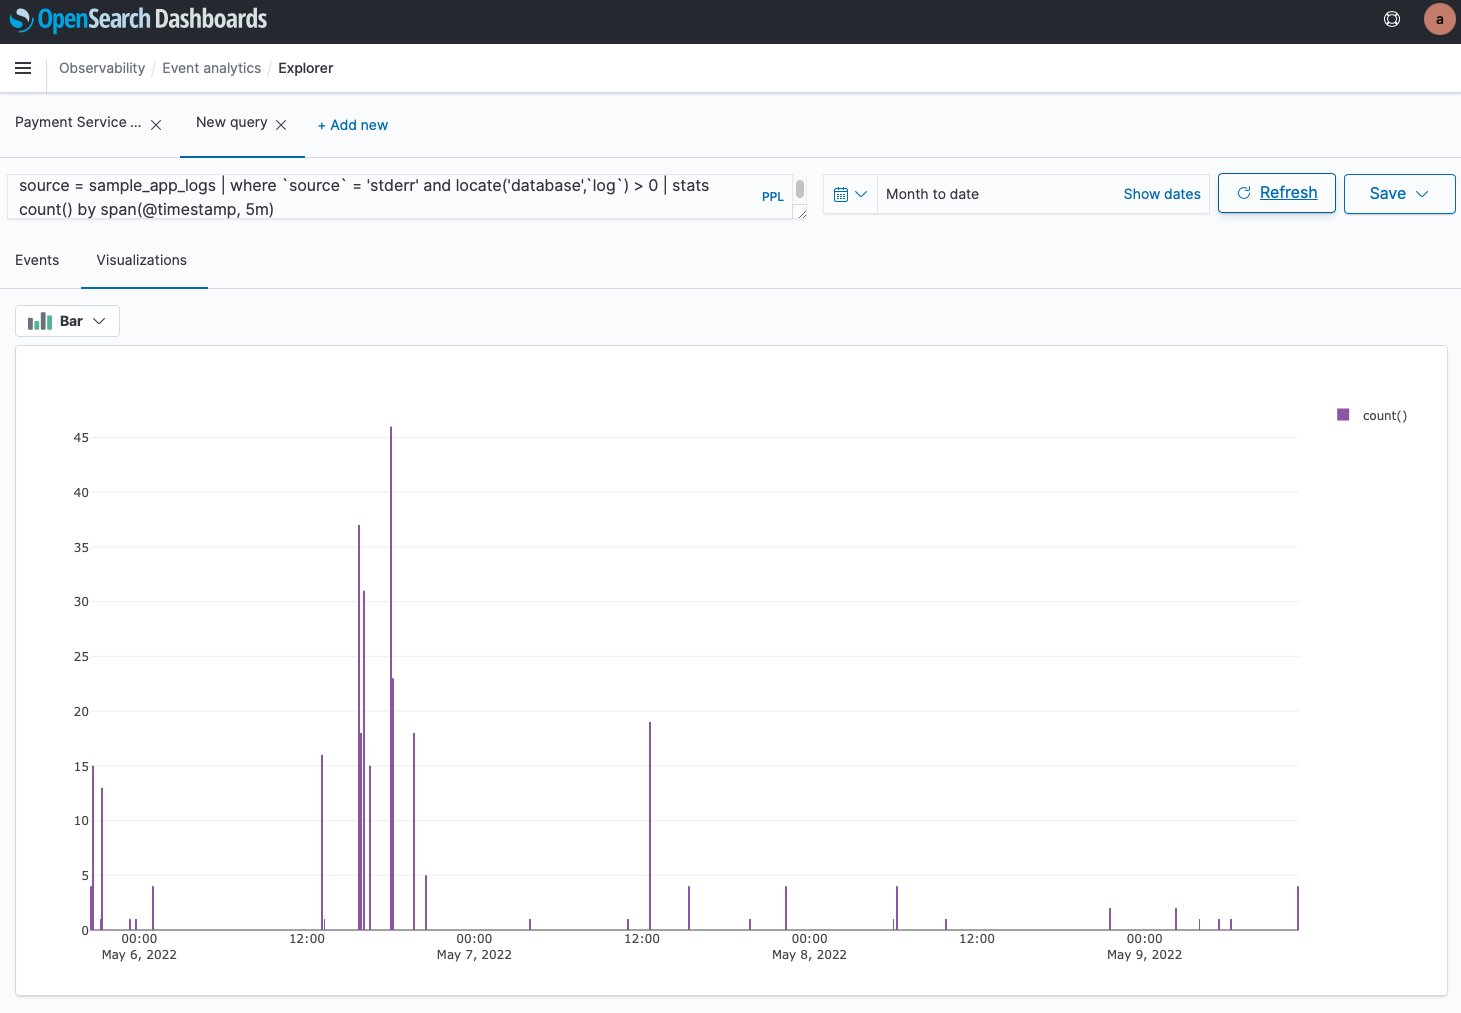
Event analytics has two modes: events and visualizations. With events, we’re looking at the query results as a table or JSON. With visualizations, the results are shown as a graph. For this post, we create a PPL query that monitors a value over time, and see the results in a graph. We can then save the graph to use in our dashboard. See the following code:
source = sample_app_logs | where stream = 'stderr' and locate('payment',`log`) > 0 | stats count() by span(time, 5m)This code is similar to the PPL we used earlier, with two key differences:
- We specify the name of our service in the log field (for this post, payment).
- We use the aggregation function
stats count() by span(time, 5m). We take the count of matches in the log field and aggregate by 5-minute intervals.
The following screenshot shows the visualization.
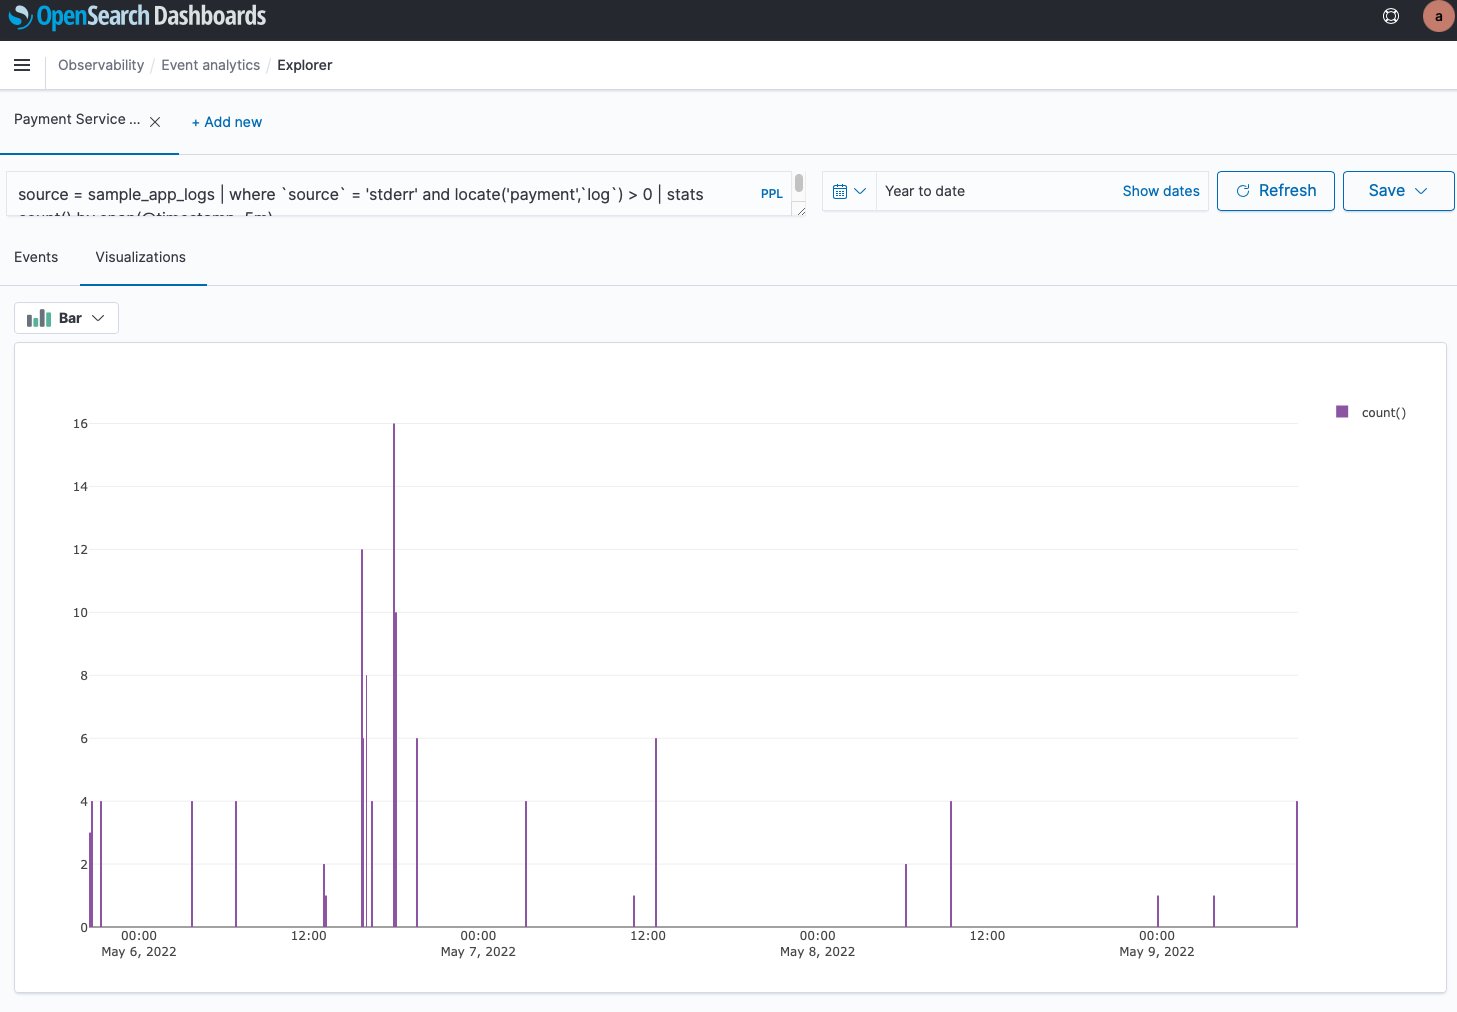
OpenSearch Service offers a choice of several different visualizations, such as line, bar, and pie charts.
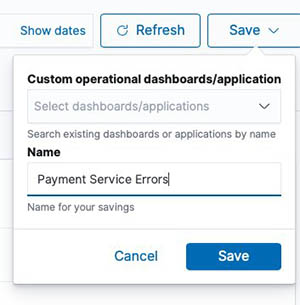
We now save the results as a visualization, giving it the name Payment Service Errors.
We want to create and save a visualization for each of the five services. To create a new visualization, choose Add new, then modify the query by changing the service name.
We save this one and repeat the process by choosing Add new again for each of the five micro-services. Each microservice is now available on its own tab.

Create an operational panel

- CRISP DETAIL, CLEAR DISPLAY: Enjoy binge-watching...
- PRO SHOTS WITH EASE: Brilliant sunrises, awesome...
- CHARGE UP AND CHARGE ON: Always be ready for an...
- POWERFUL 5G PERFORMANCE: Do what you love most —...
- NEW LOOK, ADDED DURABILITY: Galaxy A54 5G is...

- Free 6 months of Google One and 3 months of...
- Pure Performance: The OnePlus 12 is powered by the...
- Brilliant Display: The OnePlus 12 has a stunning...
- Powered by Trinity Engine: The OnePlus 12's...
- Powerful, Versatile Camera: Explore the new 4th...
Last update on 2024-04-05 / Affiliate links / Images from Amazon Product Advertising API
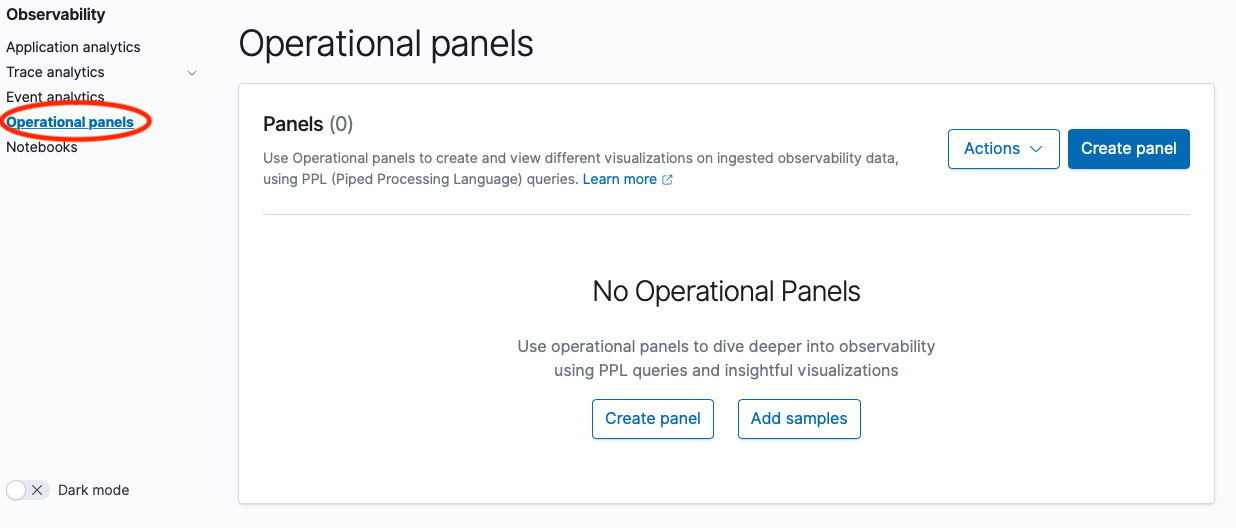
Operational panels in OpenSearch Dashboards are collections of visualizations created using PPL queries. Now that we have created the visualizations in the Event analytics dashboard, we can create a new operational panel.
- On the Operational panel page, choose Create panel.
- For Name, enter
e-Commerce Error Monitoring.
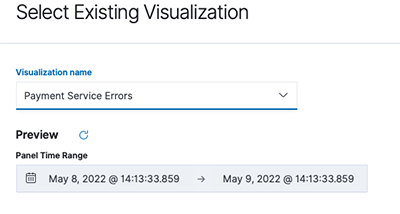
- Open that panel and choose Add Visualization.

- Choose Payment Service Errors.
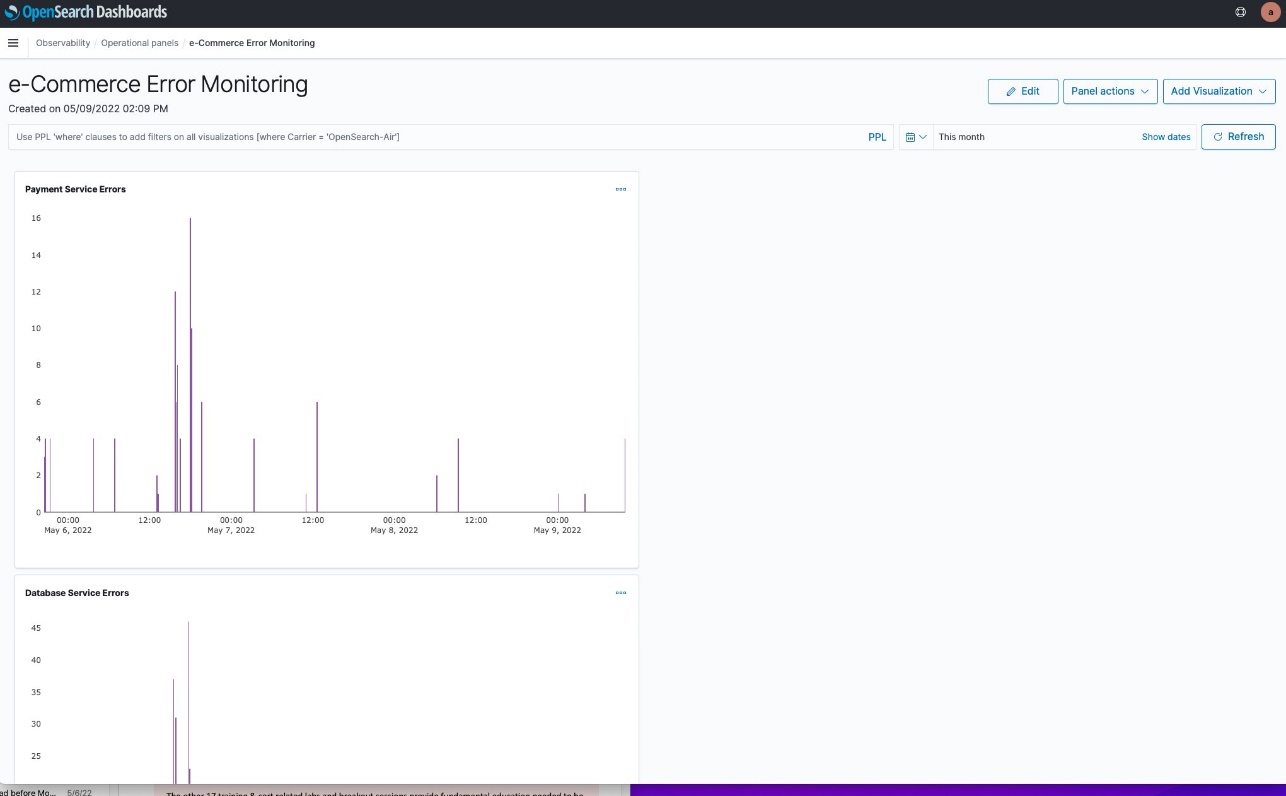
The following screenshot shows our visualization.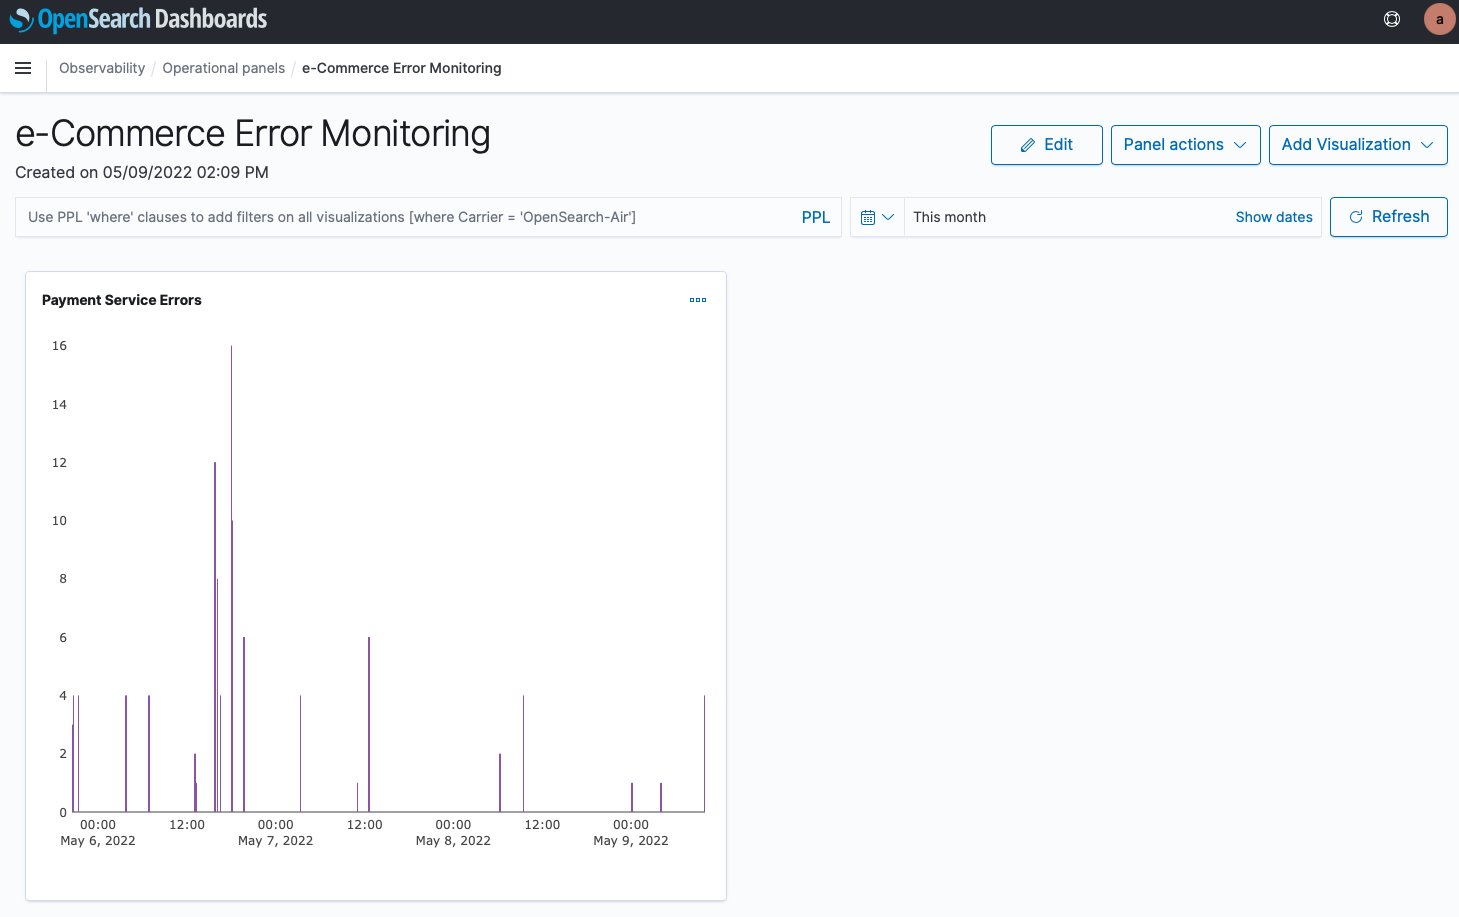
We now repeat the process for our other four services. However, the layout isn’t good. The graphs are too big, and laid out vertically, so they can’t all be seen at once.
We can choose Edit to adjust the size of each visualization and move them around. We end up with the layout in the following screenshot.
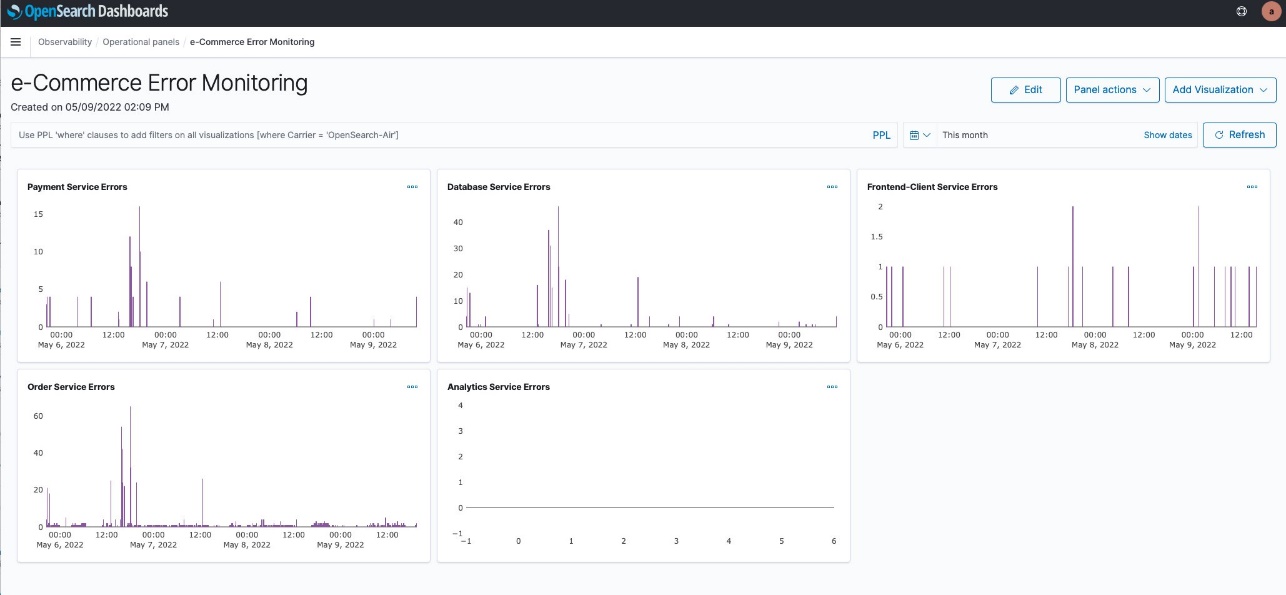
We can now monitor errors over time for all of our services. Notice that the y axis of each service visualization adjusts based on the error count.
This will be a useful tool for monitoring our services in the future.
Next, we create an incident report on the error that we found.
Create an OpenSearch incident report
The e-Commerce Error Monitoring panel can help us monitor our application in the future. However, we want to send out an incident report to our developers about our current findings. We do this by using OpenSearch PPL and Notebooks features introduced in OpenSearch Service 1.3 to create an incident report. A notebook can be downloaded as a PDF. An incident report is useful to share our findings with others.
First, we need to create a new notebook.
- Under Observability in the navigation pane, choose Notebooks.
- Choose Create notebook.
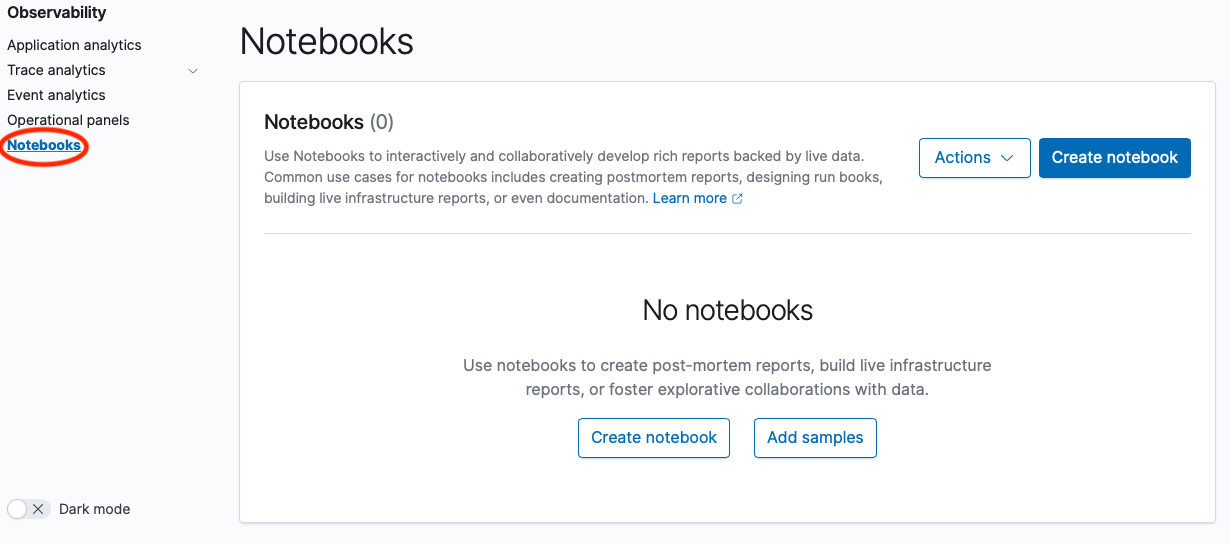
- For Name, enter
e-Commerce Error Report. - Choose Create.

The following screenshot shows our new notebook page.
A notebook consists of code blocks: narrative, PPL, and SQL, and visualizations created on the Event analytics page with PPL. - Choose Add code block.
We can now write a new code block.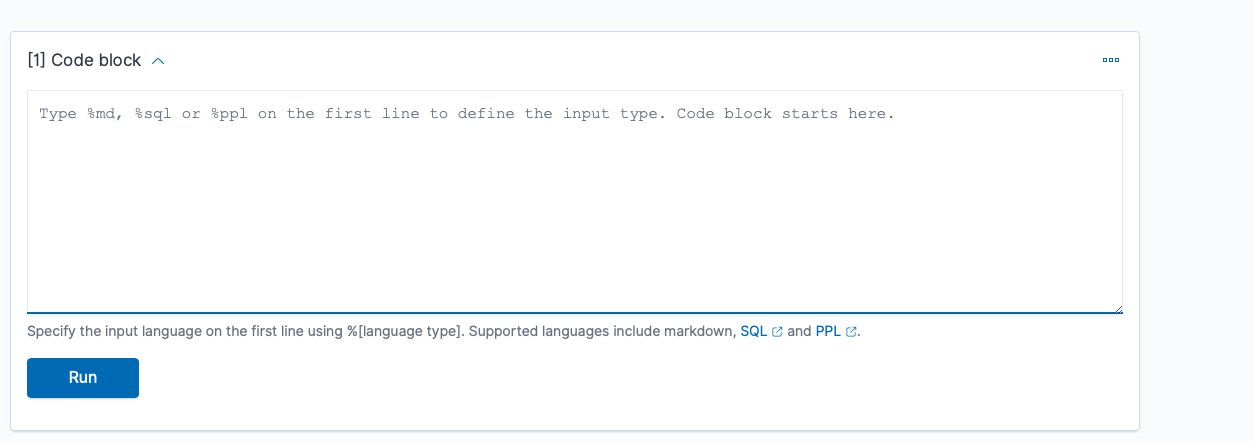
We can use%md,%sql, or%pplto add code. In this first block, we just enter text. - Use
%mdto add narrative text. - Choose Run to see the output.

The following screenshot shows our code block.
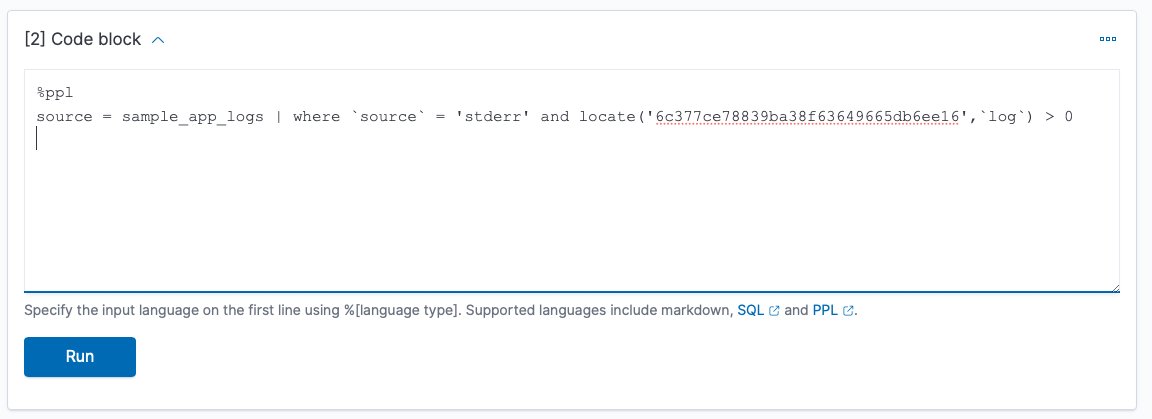
Now we want to add our PPL query to show the error we found earlier. - On the Add paragraph menu, choose Code block.

- Enter our PPL query, then choose Run.
The following screenshot shows our output.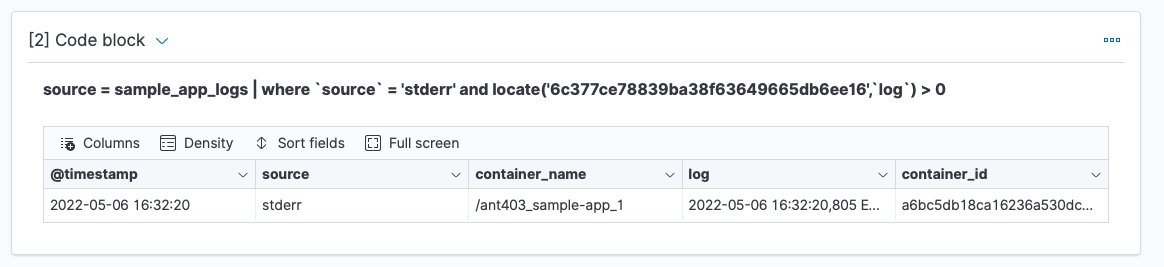
Let’s drill down on thelogfield to get details of the error. We could have many narrative and code blocks, as well as visualizations of PPL queries. Let’s add a visualization.
 - On the Add paragraph menu, choose Visualization.

- Choose Payment Service Errors to view the report we created earlier.

This visualization shows a pattern of payment service errors this afternoon. Note that we chose a date range because we’re focusing on today’s errors to communicate with the development team.
Notebook visualizations can be refreshed to provide updated information. The following screenshot shows our visualization an hour later. We’re now going to take our completed notebook and export it as a PDF report to share with other teams.
 - Choose Output only to make the view cleaner to share.

- On the Reporting actions menu, choose Download PDF.

We can send this PDF report to the developers supporting the payment service.
Summary

- 【Octa-Core CPU + 128GB Expandable TF Card】...
- 【6.8 HD+ Android 13.0】 This is an Android Cell...
- 【Dual SIM and Global Band 5G Phone】The machine...
- 【6800mAh Long lasting battery】With the 6800mAh...
- 【Business Services】The main additional...

- 【Dimensity 9000 CPU + 128GB Expandable TF...
- 【6.8 HD+ Android 13.0】 This is an Android Cell...
- 【Dual SIM and Global Band 5G Phone】Dual SIM &...
- 【6800mAh Long lasting battery】The I15 Pro MAX...
- 【Business Services】The main additional...

- 🥇【6.8" HD Unlocked Android Phones】Please...
- 💗【Octa-Core CPU+ 256GB Storage】U24 Ultra...
- 💗【Support Global Band 5G Dual SIM】U24 Ultra...
- 💗【80MP Professional Photography】The U24...
- 💗【6800mAh Long Lasting Battery】With the...
Last update on 2024-04-05 / Affiliate links / Images from Amazon Product Advertising API
In this post, we used OpenSearch Service v1.3 to create a dashboard to monitor errors in our microservices application. We then created a notebook to use a PPL query on a specific trace ID for a payment service error to provide details, and a graph of payment service errors to visualize the pattern of errors. Finally, we saved our notebook as a PDF to share with the payment service development team. If you would like to explore these features further check out the latest Amazon OpenSearch Observability documentation or, for open source, OpenSearch Observability latest open source documentation. You can also contact your AWS Solutions Architects, who can be of assistance alongside your innovation journey.
About the Authors
Marvin Gersho is a Senior Solutions Architect at AWS based in New York City. He works with a wide range of startup customers. He previously worked for many years in engineering leadership and hands-on application development, and now focuses on helping customers architect secure and scalable workloads on AWS with a minimum of operational overhead. In his free time, Marvin enjoys cycling and strategy board games.
Subham Rakshit is a Streaming Specialist Solutions Architect for Analytics at AWS based in the UK. He works with customers to design and build search and streaming data platforms that help them achieve their business objective. Outside of work, he enjoys spending time solving jigsaw puzzles with his daughter.
Rafael Gumiero is a Senior Analytics Specialist Solutions Architect at AWS. An open-source and distributed systems enthusiast, he provides guidance to customers who develop their solutions with AWS Analytics services, helping them optimize the value of their solutions.