
Much of the focus of this month’s outlook will be on portfolio positioning given the current economic backdrop. While we are closely following the Ukrainian crisis dominating the headlines, we believe the economic effects, at least in the U.S., will ultimately pale in comparison to the humanitarian impact we are seeing. Our hearts go out to all those affected.
While geopolitical risks and global unrest can roil markets, a historical perspective and a robust investment process can help guide investors through volatility and inform our investment decisions.
The U.S. economy is one of the most independent economies in the world. Among the Organization for Economic Cooperation and Development (OECD) members, no country relies less on the foreign trade of goods and services than the U.S. relative to the size of their respective economies (exhibit 1). The lack of foreign trade relative to the size of the overall economy helps shelter the U.S. from stresses overseas.

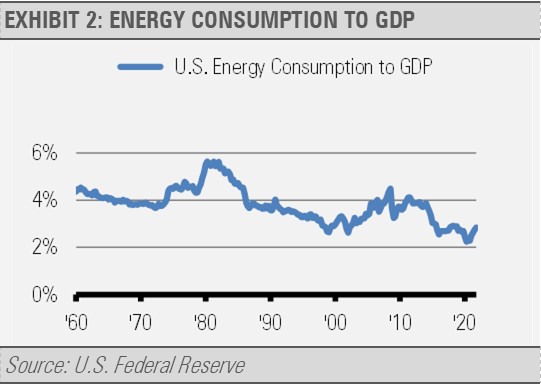
Today, as opposed to the 1970s and early 1980s, that lack of reliance on foreign trade extends to the U.S. energy complex as well.
Not only has the U.S. economy become more energy efficient over the decades, but the U.S. overall has become less dependent on foreign sources of energy.
Comparisons to the 1970s and early 1980s are just not very relevant today. As exhibit 2 shows, the U.S. economy was much more energy intensive and less efficient in the 1970s and early 1980s than it is today. Per dollar of economic activity, the U.S. uses roughly half of the amount of the energy required 40 or 50 years ago.
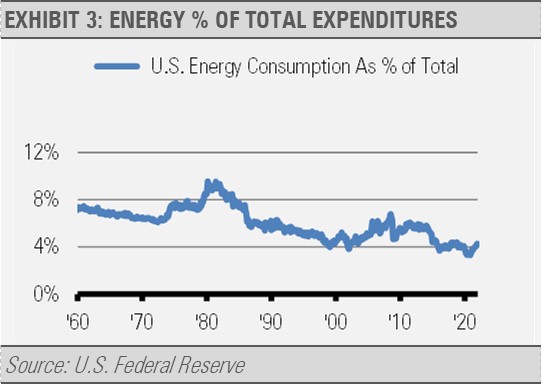
The same can be said of household spending on energy. While no one likes to pay more at the pump, spending on energy relative to total personal consumption has fallen from nearly 10% in June 1981 to just over 4% in January 2022.
In addition, the U.S. imported significantly more oil in the 1970s. Today, energy imports are a small fraction of total consumption. In fact, according to the U.S. Energy Information Administration, the U.S. was a net exporter of petroleum products and natural gas, as well as coal and coal charcoal in 2020 (exhibit 4). The U.S. imported only a negligible amount of crude oil on net, primarily from Canada.

While the prices of oil and gasoline have risen, these increases are not anywhere near as serious as in the 1970s and early 1980s. Perhaps that is why the economy was able to withstand the oil price spikes in 1987, 1996, 2011, and 2018 without experiencing economic contraction. Additionally, the Gulf War oil price spike of 1990 came two months after that recession began.
Recessions typically begin with a Fed policy error that that hurts liquidity growth and drives spending, lending, and investing to a halt. Therefore, U.S. Federal Reserve policy is far more important than oil to our economic outlook. We expect the Fed to raise short-term interest rates multiple times this year and begin to reduce the size of its balance sheet, a process known as quantitative tightening (QT).
The Fed is likely well behind the curve on interest rate increases and QT. We think that the Fed should have started this process months ago to begin offsetting the inflationary pressures coming from the massive amounts of stimulus that has overwhelmed our economy’s capacity to absorb so much liquidity. We estimate that there is approximately $4.5 trillion of excess liquidity (money) sloshing around the U.S. economy looking for productive uses. That amounts to nearly 20% of the size of the U.S. economy (exhibit 5). We think that so much excess liquidity is inflationary, but also creates a sizable cushion to soften blows to the economy.
- 5.1-channel 80-Watt powerful surround sound system
- 4K60, 4K120AB and 8K60B HDMI 2.1 with HDCP 2.3 and...
- Dolby Vision, Hybrid Log-Gamma and BT.2020
- Supports enhanced media and gaming - ALLM, VRR
- YPAO automatic room calibration

- Low-Profile Modern Design - Clean silhouettes,...
- Powerful Performance - Brilliant clarity,...
- Simple Setup, Streaming & Control - Get setup and...
- 5.1-Channel Sound - Experience a powerful...
- 6 Total Speakers - Full-range drivers deliver...
Last update on 2024-04-05 / Affiliate links / Images from Amazon Product Advertising API

We expect the Fed to keep hiking interest rates and working through QT until inflationary pressures ease. This should occur as the amount of money in the system relative to the size of the economy declines to more normal levels. This is a process that will likely take years, not months, to complete. As reflected in the strong jobs growth, the relatively low number of layoffs, and the high number of open jobs, we think the U.S. economy has plenty of momentum to weather any headwinds coming from COVID, oil prices, geopolitical risks, and the shifts in Fed policy.
INVESTMENT IMPLICATIONS
Recent equity market price declines offer attractive investment opportunities in our view. We are finding attractive prices in U.S. financials, health care, information technology, and small cap value stocks, as well as global natural resource companies.
We think that interest rates will move higher across the yield curve in the months to come. Our fixed income allocations are positioned to be relatively sheltered from rising interest rates while potentially offering attractive current income and protecting against equity market volatility. In this area, we favor short- and intermediate-duration investment grade corporate bonds and asset-backed securities as well as bank loans and collateralized loan obligations.
THE CASH INDICATOR
The Cash Indicator (CI) process has been useful for helping us judge volatility, especially in times of crisis. After months of suggesting market complacency, the CI has moved higher that historical average levels, which reflects stresses in both equity and credit markets. However, the CI remains below the levels that would indicate that markets are breaking down. Therefore, we remain fully invested and view market declines as an opportunity.

DISCLOSURES
Any forecasts, figures, opinions or investment techniques and strategies explained are Stringer Asset Management, LLC’s as of the date of publication. They are considered to be accurate at the time of writing, but no warranty of accuracy is given and no liability in respect to error or omission is accepted. They are subject to change without reference or notification. The views contained herein are not be taken as an advice or a recommendation to buy or sell any investment and the material should not be relied upon as containing sufficient information to support an investment decision. It should be noted that the value of investments and the income from them may fluctuate in accordance with market conditions and taxation agreements and investors may not get back the full amount invested.

- SAMSUNG USA AUTHORIZED - Includes 2 Year Extended...
- Samsung 85 Inch DU8000 Crystal UHD LED 4K Smart TV...
- UHD Dimming | Auto Game Mode (ALLM) | Alexa...
- SAMSUNG TIZEN OS: Stream your favorite shows, play...
- BUNDLE INCLUDES: Samsung DU8000 Series 4K HDR...
- SAMSUNG USA AUTHORIZED - Includes 2 Year Extended...
- Samsung 75 Inch DU8000 Crystal UHD LED 4K Smart TV...
- UHD Dimming | Auto Game Mode (ALLM) | Alexa...
- SAMSUNG TIZEN OS: Stream your favorite shows, play...
- BUNDLE INCLUDES: Samsung DU8000 Series 4K HDR...

Last update on 2024-04-05 / Affiliate links / Images from Amazon Product Advertising API
Past performance and yield may not be a reliable guide to future performance. Current performance may be higher or lower than the performance quoted.
The securities identified and described may not represent all of the securities purchased, sold or recommended for client accounts. The reader should not assume that an investment in the securities identified was or will be profitable.
Data is provided by various sources and prepared by Stringer Asset Management, LLC and has not been verified or audited by an independent accountant.