WKLY is similar to TGIF with its twist being the weekly dividend payment. While TGIF focuses on fixed income, WKLY is the equity focused ETF. WKLY is also passively managed with an index it tracks rather than the actively managed TGIF.
WKLY ETF: The Weekly Paying Dividend ETF
SoFi Weekly Dividend ETF (NYSEARCA:WKLY) is the other weekly paying dividend ETF, the cousin to the SoFi Weekly Income ETF (TGIF). We covered TGIF recently. As far as I'm aware, these are the only two weekly paying dividend ETFs. I like the idea of the weekly dividends, but in the end, it doesn't change anything fundamentally.
Where TGIF falls short is its rather low yield. Basically, my main takeaway from TGIF is it's an investment-grade and high-yield bond fund. However, it correlates closer to high-yield bonds but pays a yield closer to investment grade. If I'm taking a higher risk, I want a higher yield. They recently bumped up their dividend, which I discussed as a positive.
WKLY also might seem like it pays a low yield, but it isn't too far off from similar equity funds. Equity funds aren't particularly known for their incredibly high yields anyway unless you start getting leverage or an options strategy.
In this case, it comes in at 2.25% based on the $0.02 paid weekly. Due to one of its tilts towards higher-yielding investments in its index selection process, it is better than the SPDR S&P 500 (SPY) with its 1.66% yield.
However, you can look at ETFs such as ProShares S&P 500 Dividend Aristocrats ETF (NOBL), with its ~2% yield that's relatively close. The iShares Core Dividend Growth ETF (DGRO) also pays a current yield of 2.35%. Of course, NOBL and DGRO pay quarterly dividends that are variable. These two ETFs are also more focused on U.S.-based holdings, with WKLY being global. The big theme of WKLY is the weekly dividend that is fixed for extended periods of time.
Another big difference between TGIF and WKLY is that WKLY is passively managed, based on replicating the SoFi Sustainable Dividend Index. TGIF is an actively managed ETF.
The Basics
- Dividend Frequency: Weekly
- Dividend Yield: 2.25%
- Expense Ratio: 0.49%
- Leverage: N/A
- Managed Assets: $9.24 million
- Structure: Index ETF (SoFi Sustainable Dividend Index)
WKLY's investment objective is “consistent income.” To achieve this, they will “track the SoFi Sustainable Dividend Index, made up of the most consistent dividend-paying companies globally.”
An interesting side note is that they charge an expense ratio of 0.49% for this index-based ETF. However, TGIF's expense ratio isn't too much higher, and it is an actively managed ETF with an expense ratio of 0.59%. Regardless, the average index equity ETF expense ratio in 2021 came to 0.16%. That puts WKLY on the higher end. DGRO's expense ratio was 0.08%, and NOBL is 0.35% for some further context.
The fund is incredibly small, and that can be a huge issue. Particularly with the average trading volume. WKLY has an average trading volume of just 1769 shares a day. That means the spreads between bid/ask can be quite wide. Limit orders can be your best friend in these types of low-volume ETFs. This could also be the reason why the expense ratio is significantly higher than the average.
Additionally, as I've mentioned for TGIF also being a smaller ETF, if they were a larger asset manager, they may not let these ETFs linger around long before shutting them down. Due to being a relatively newer financial institution, they might be more willing to let smaller funds hang around. This is especially true for an index-based ETF that takes minimal overhead.
As an ETF that tracks an index, it's important to understand how this index is constructed. The prospectus lays out the entire selection in more detail, but I'll just highlight the key points to consider in its construction. It all starts initially with selecting the securities within the Solactive GBS Developed Markets Large & Mid Cap USD Index (“GBS universe.”) From there:
- Companies must have a minimum average daily value traded of $5 million or higher.
- Companies must have a minimum free-float market capitalization of $1 billion or higher.
- Companies must have paid a regular dividend for the preceding 12-month period and expect to over the next 12 months.
- The payout ratio of the dividend must be between 0 and 100%.
- Companies must have a debt/equity ratio that is not in the top 10% of companies in the GBS universe.
- The price return over the last 1-year cannot rank in the bottom 5%.
- The companies that make it through the above will then be screened for those with 1.2x the weighted average dividend yield of the GBS Universe. The additional wrinkle here is that if less than 100 companies meet that eligibility, additional companies will be selected based on the highest dividend yield until at least 100 constituents are selected.
That last criterion is where it gets a bit of its higher yield tilt relative to, say, SPY.
There are a couple of other factors in constructing the index to keep it more diversified, too. No security can have more than a 5% weight, nor can any individual sector comprise 30%+ of the index weighting.
Mostly, these are all fairly strong considerations that can present a well-balanced and strong index.
Performance – Looking Relatively Strong YTD
In looking at the results on a YTD basis, WKLY has outperformed SPY by a huge margin. In fact, the only ETF it hadn't beaten out in comparison below was NOBL. WKLY just narrowly outperformed DGRO. That's both on a price return only and a total price return basis.
I've also included iShares MSCI World ETF (URTH) in there to highlight some context of an ETF with an international tilt.
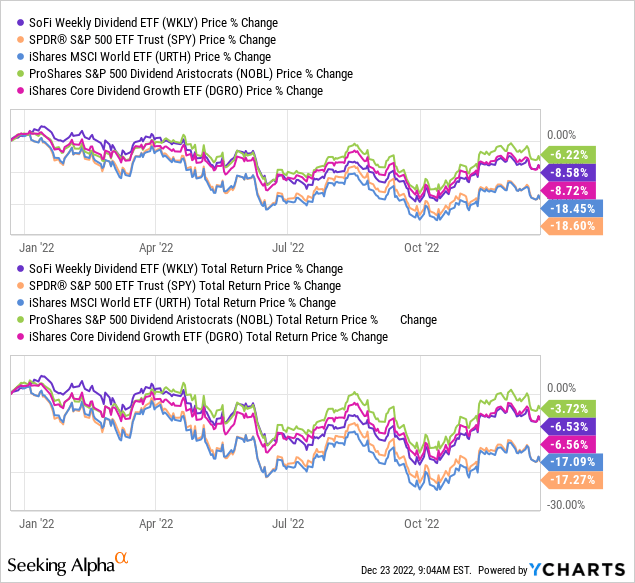
In that regard, I think it's quite impressive. When looking at its portfolio, this will make more sense. They are invested in more defensive sectors with very limited exposure to technology, which tends to make sense due to the index selection process that this fund tracks. Both URTH and SPY suffer from overweight allocations to tech-related securities.
Dividend – Paid Weekly
I've mentioned it before, but I would like to reiterate that one shouldn't make any investment decision based on the frequency of a dividend payment. That means weekly, monthly, quarterly, semi-annually or annually – shouldn't make a difference in your investment choices. (Okay, I'm not going to count semi or annual payers as income plays. I'll draw the line there!)
Admittedly, the weekly dividend-paying frequency sounds alluring. However, it still has to make sense for the exposure you are getting at the end of the day (i.e., being comfortable with the underlying portfolio.)
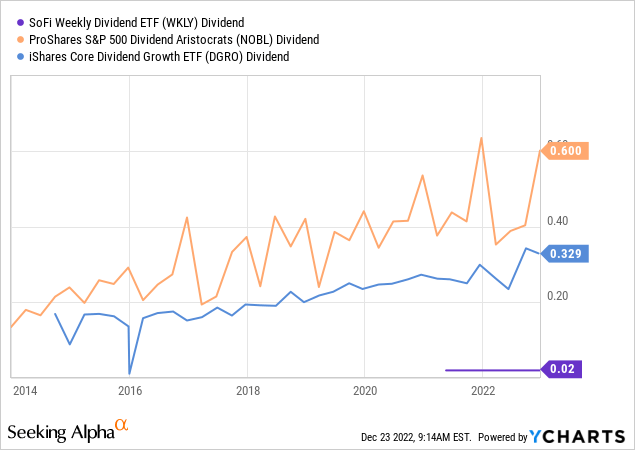
With that being said, I think there is an edge or benefit to investing in an income play that pays consistently. That's where WKLY – after being comfortable with the underlying holdings – can be a big winner. They've paid the same $0.02 every week since launch. NOBL and DGRO pay variable quarterly dividends. That can make it a bit harder if you are on a fixed income or a retiree that wants reliable and mostly predictable cash flows.
- Tobias, Andrew (Author)
- English (Publication Language)
- 320 Pages - 04/19/2022 (Publication Date) - Harper...
- Reference Guide, Investment Lawyer's (Author)
- English (Publication Language)
- 46 Pages - 07/12/2019 (Publication Date) -...
When looking at their latest semi-annual report, it looks like the fund is earning more than enough in net investment income to cover its dividend. In fact, on this current trajectory, a bump up in the payout could be warranted as NII coverage came in at 175%. Similar to what we saw with TGIF, they paid out a large year-end dividend to help compensate for these excessive earnings the fund had.
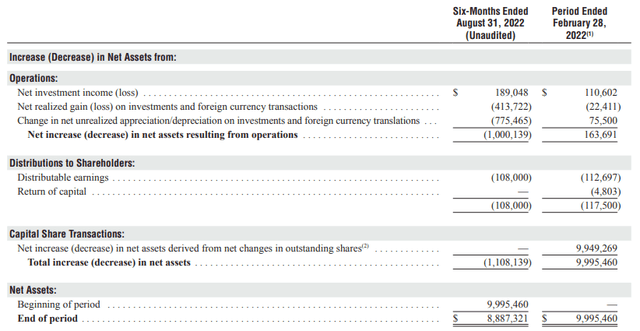
That high coverage is reflected in the 3.97% ratio of NII to average NAV. At the same time, the fund's current dividend works out to 2.25%. So there is definitely capacity in their tank to up it from here.
WKLY's Portfolio
As of September 30th, 2022, here is what the overall portfolio looks like. They listed 468 total positions.
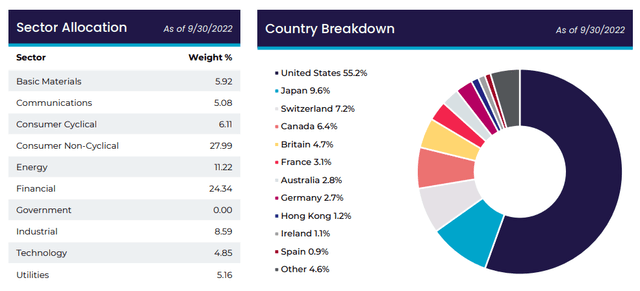
Worth noting on the country breakdown is that the largest weighting is still to U.S. holdings. However, that isn't that unusual, even for globally focused funds. The U.S. is a large and dominant economic force, which will naturally have a significant draw, with most of the world's largest companies being located there. Of course, while being allocated to the U.S., they are holding mega multinational corporations that have exposure all around the globe.
Also worth noting is that, for the most part, there is heavier exposure to Western Europe countries. With Russia's invasion of Ukraine, that is probably a good thing to stay further away from the conflict. Again, with more economic activity in the western portion of Europe, that's also going to have a natural pull that way.
We also see those sector weightings listed above are heaviest in consumer staples and financials. Energy also makes up a double-digit weighting. We know that energy has been a huge winner this year, helping to provide WKLY with a better relative performance.
Financials, while not particularly strong, is still coming in somewhere in the middle regarding sector performance on a YTD basis. They're down -13.55% as of this writing, using the Financial Select Sector SPDR ETF (XLF).
That's a much better off than the tech sector, consumer discretionary and communication services. Those underperforming sectors combined for WKLY come to only 16.04%. That's where we can start to see exactly why WKLY has performed so much better on a YTD basis relative to SPY and URTH.
In my opinion, looking at a more recent top ten indicates that the sector weightings will still be relatively similar.
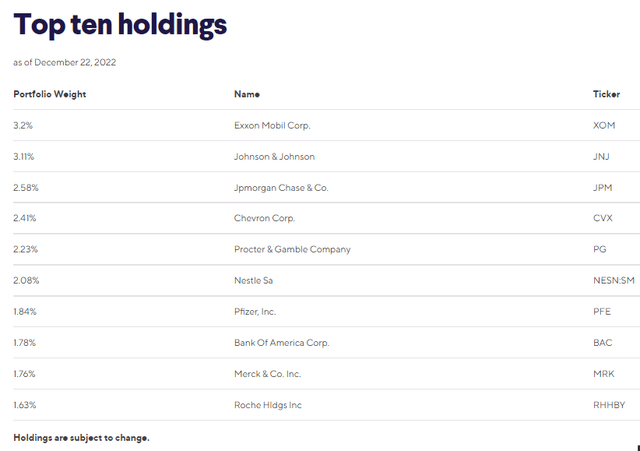
We have the big names leading the way in Exxon Mobil (XOM) representing energy and Johnson & Johnson (JNJ) as the second largest position representing the defensive healthcare space. We then have JPMorgan (JPM) as the ETF's largest financial exposure, followed by another energy play with Chevron (Original Post>
If you recall above, DGRO had almost identical performance to WKLY. It is no wonder, as they share quite a bit of overlap in their top positions. In total, we have five overlapping positions; JPM, JNJ, Procter & Gamble (PG), Merck (MRK) and Pfizer (PFE). If WKLY didn't have a global position such as Nestle (trading as (OTCPK:NSRGY) on the pink sheets in the U.S.) and Roche Holding (OTCQX:RHHBY), that might be even a couple more opportunities to have overlap in their portfolio.
Conclusion
WKLY has offered a strong relative performance YTD compared to SPY. Its value-oriented tilt helped this with a greater focus on dividend payers and reduced tech exposure.
This ETF, while some will call it a low yielder, is paying right around what you might expect for these sorts of straight-equity-focused ETFs. The twist or unique piece to WKLY is that they take what others might be paying quarterly as dividends and set it at a consistent weekly rate. In fact, they could bump up what they're currently paying if their last report is any indication.
At the end of the day, if you are comfortable with holding DGRO, you should be fairly comfortable with WKLY. Despite having ~45% invested outside the U.S., the performance on a YTD basis was nearly identical. The downside would be the higher expense ratio; was it similar to DGRO's incredibly low cost, it actually would have shown even more outperformance.
Editor's Note: This article discusses one or more securities that do not trade on a major U.S. exchange. Please be aware of the risks associated with these stocks.


