
In Part I, I laid out a series of general principles describing the relationship between innovation, war, and financial markets, and the hope in subsequent installments is to lay out convincing evidence to back those claims up. Those claims can be condensed further:
- Equity yields, real commodity prices, and deaths in violent conflicts appear to have been positively correlated over the last two centuries, and these tend to rise and fall in somewhat regular waves (50-60 years during the gold standard and 30 years under a fiat system).
- Clusters of disruptive innovations appear to burst onto the scene at the trough of these waves and grow extremely rapidly as a given wave rises.
- Near the peak of one of these market/political waves, these innovation clusters tend to shift rapidly from high-growth/low-diffusion to low-growth/high-diffusion regimes.
- Mass diffusion of disruptive innovations tends to occur during “secular” downswings in equity yields, real commodity prices, and deaths in conflict.
- Stock markets (including, or perhaps especially, tech stocks), by definition, underperform earnings growth during these periods of rising yields and, by extension, rising commodity prices and increased violence, not to mention the emergence and rapid growth of disruptive innovations.
- Stock markets tend to do well primarily during the mass diffusion of disruptive innovations, with the exception of the worst bear market in history, the Great Depression.
- Waves in commodity prices, consumer inflation, equity and bond yields, stock market booms and busts, and innovation disruptions appear to occur even against a background of high and steady technological progress.
Many of these relationships were graphed out in Part 1. In terms most relevant to a discussion of asset prices, we can claim that stock prices (in fiat monetary systems) and commodity prices tend to behave in the following manners in relation to disruptive innovation waves.
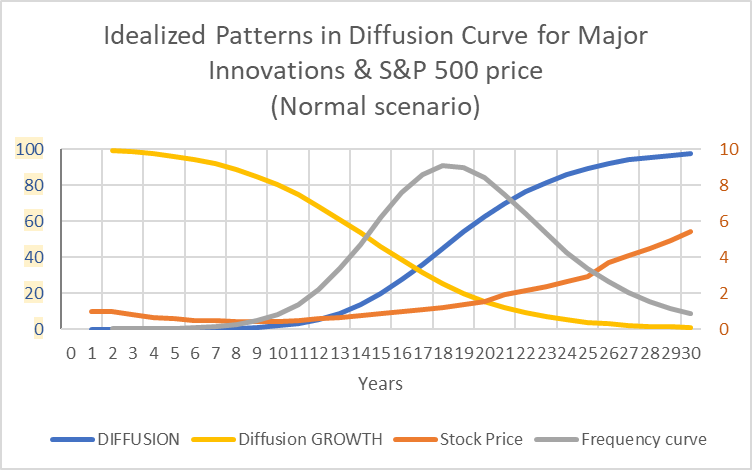
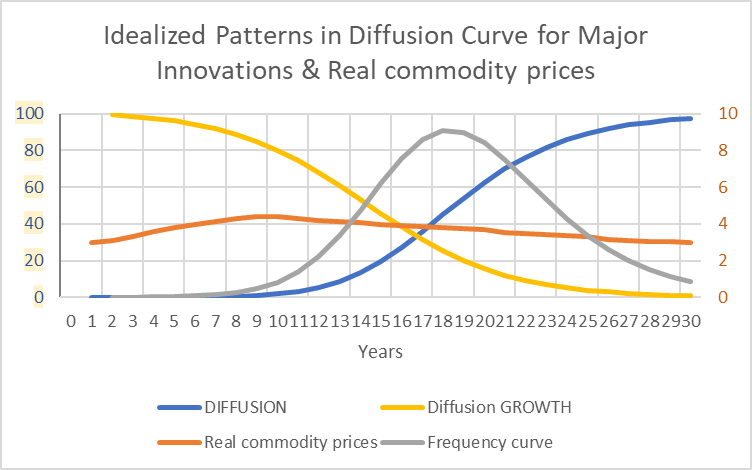
For the sake of simplicity, I am going to refer to waves in commodity prices, yields, and war as Kondratiev Waves and waves in disruptive innovations as Schumpeter Waves. Chart B, therefore, is most representative of the conjunction of these two types of waves. The earnings yield intermediates between Kondratiev Waves and stock prices, so stock prices never can be direct expressions of these phenomena. Over very long durations (a half-century or beyond), stock prices likely reflect technological progress but primarily on the back of rising earnings.
Kondratiev Waves Vs. Schumpeter Waves
Treating Kondratiev Waves (primarily price and yield waves) and Schumpeter Waves (disruptive innovation waves) as separate is not fair to either Kondratiev or Schumpeter. Kondratiev related these market waves to developments in both technology and war, and Schumpeter saw market waves and transitions in social sentiment primarily as expressions of innovation waves.
The absolute separation of these two types of waves, in my opinion, is a disservice to the theories of both economists and occurred after their respective deaths (Kondratiev in 1938 and Schumpeter in 1950). As a consequence of this separation, Schumpeter is often turned into an almost platitudinous defender of innovation and entrepreneurialism. Kondratiev, the man and economist, is largely ignored, and his long waves have been pushed to the fringes of economics. “Long cycles have never been quite accepted by mainstream economics and remain suspiciously tinged as a fringe theory attractive to outside cranks and the popular press,” as The History of Economic Thought website puts it.
Many of those who hold Schumpeter in high regard find a way to elide Kondratiev’s contributions or, if they do acknowledge the Russian’s influence on Schumpeter, do so with a touch of embarrassment. Take Thomas McCraw’s 700-page biography of Schumpeter, declared by Tyler Cowen to be “one of the two or three best biographies of an economist ever written”, or McCraw’s otherwise excellent review of Schumpeter’s Business Cycles. Kondratiev’s name is barely mentioned in McCraw’s book, and he seems to quote Samuelson approvingly in reducing Kondratiev to a mere market cyclist peddling, it seems, “Pythagorean moonshine”. Yet, it is almost impossible to conceive of Schumpeter having made the effort to write Business Cycles without Kondratiev having first written about his theories. McCraw describes the significance of Business Cycles:
[T]he prodigious research that went into its writing caused a significant change in Schumpeter's thinking about capitalism. It moved him to a more historical and empirical approach that shaped nearly all his subsequent work. And second, much of the book constitutes a preview of modern, rigorous business history.
I mention this partly, I confess, because of being a bit miffed about Kondratiev’s fate—first, shot by Stalin and then airbrushed out of economics—but primarily because invoking the names of Schumpeter and Kondratiev is likely to evoke certain misleading preconceptions. Referring to Schumpeter Waves as distinct from Kondratiev Waves in this article may slightly reinforce these misconceptions, but ultimately, the aim is to show that Kondratiev Waves and Schumpeter Waves are two sides of the same coin.
Let’s look at some of the ways in which Schumpeter Waves and Kondratiev Waves are often depicted. First, Schumpeter.
Innovation Waves
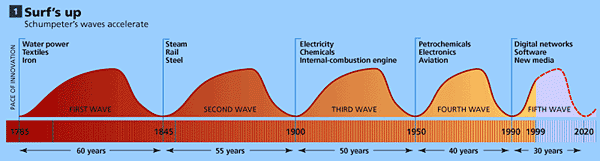
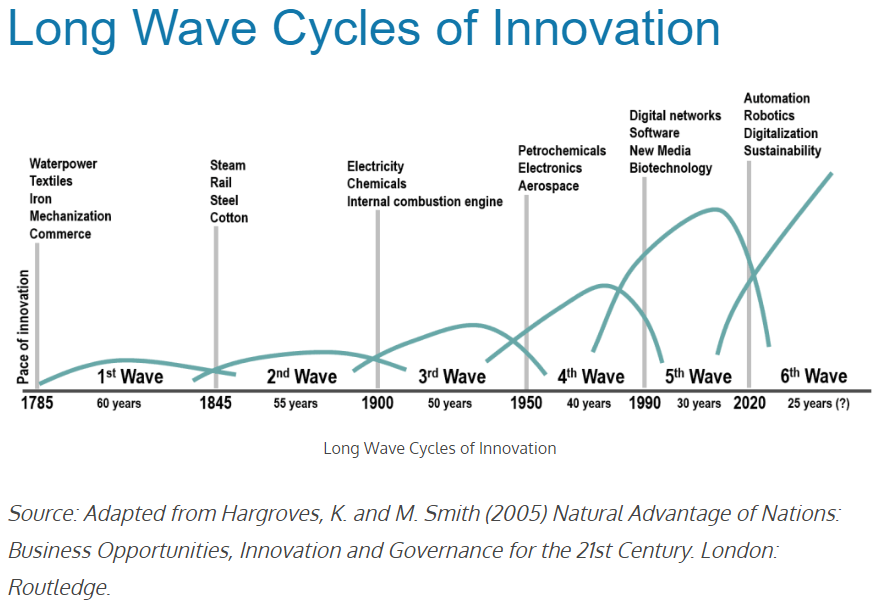
The Economist has depicted Schumpeter Waves as being in a state of ‘acceleration’ from the beginning.
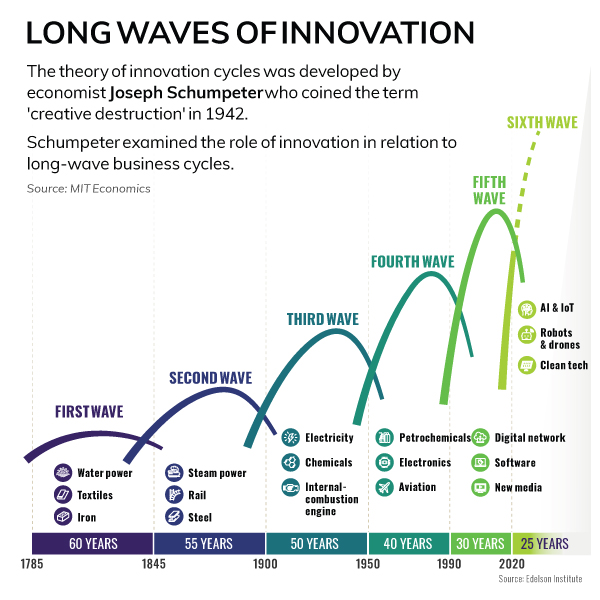
This seems to be standard now, although a more typical depiction is of a series of waves that are both accelerating and rising. Take, for example, The World Economic Forum’s use of Visual Capitalist’s depiction of Schumpeter Waves.
The Geography of Transport depicts them very similarly.
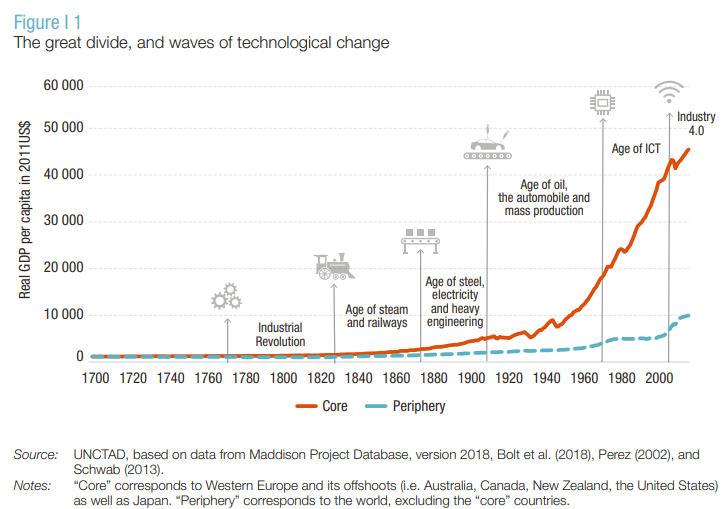
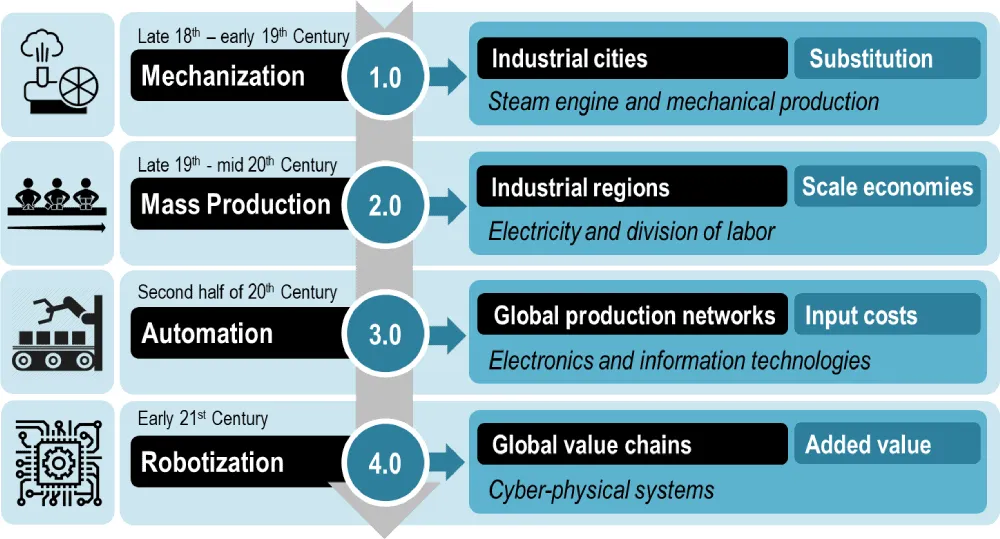
UNCTAD (the United Nations Conference on Trade and Development) portrays technology waves somewhat differently (see the following chart), suggesting an amalgam of the waves depicted above and Klaus Schwab’s notion of four waves in production technologies culminating in the supposed Fourth Industrial Revolution.
The chart below from The Geography of Transport illustrates this concept of industrial revolutions.
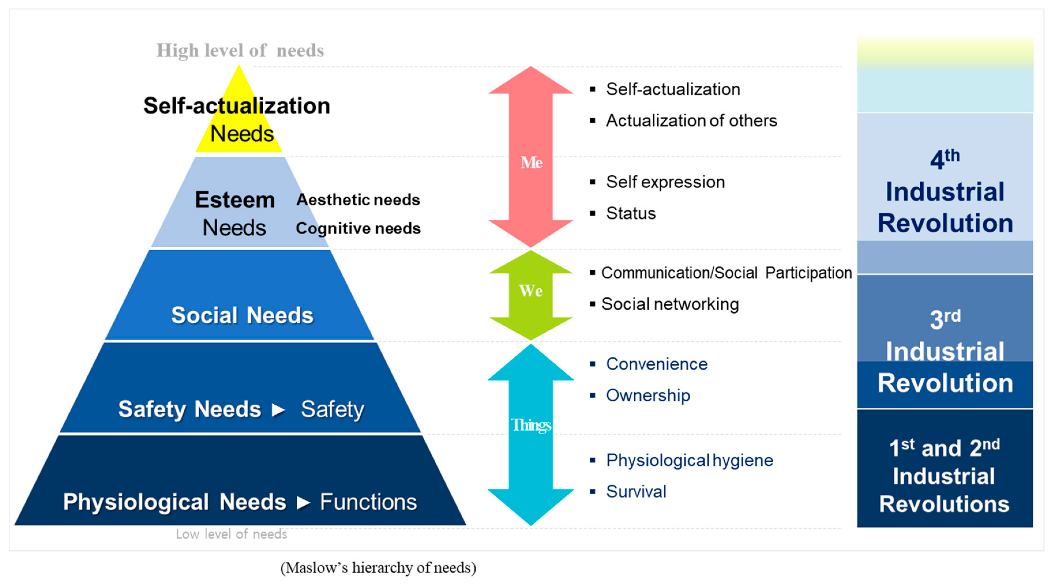
In nearly all of these supposedly Schumpeterian takes, we are on the verge of technological paradise. The following chart attempts to relate the concept of the Fourth Industrial Revolution to Maslow’s hierarchy of needs.
Innovation waves tend to become increasingly frequent and increasingly high.
This contrasts rather starkly with the ideas of the author of Capitalism, Socialism, and Democracy who saw capitalist progress culminating in socialism:
Can capitalism survive? No. I do not think it can…its very success undermines the social institutions which protect it, and ‘inevitably’ creates conditions in which it will not be able to live and which strongly point to socialism as the heir apparent….Prognosis does not imply anything about the desirability of the course of events that one predicts. If a doctor predicts that his patient will die presently, this does not mean he desires it.
From Schumpeter’s point of view, peak technology might culminate in the “creative destruction” of republican institutions, and this is actually much closer to the pessimism that is typically conveyed in depictions of Kondratiev Waves in recent decades.
Kondratiev Waves
The following chart was perhaps my first encounter with Kondratiev Waves.
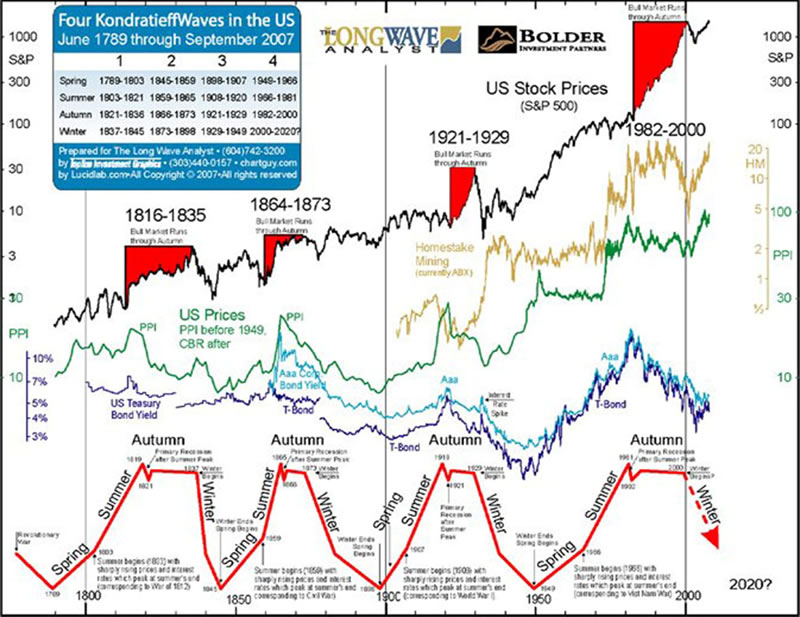
Notice that in this chart, the frequency of the wave is certainly not accelerating. And, the direction is towards “Winter”, not paradise. One problem with this chart is that the price series for both commodities and stocks have increasingly broken away from both the interest rate cycles depicted and the idealized wave at the bottom, thus suggesting that Kondratiev Waves have broken down or never really existed.
Allianz Global Investors put a quite different spin on Kondratiev. They attempt to connect innovation waves with stock market performance. Bear markets in stocks occur at troughs in those idealized technology waves.
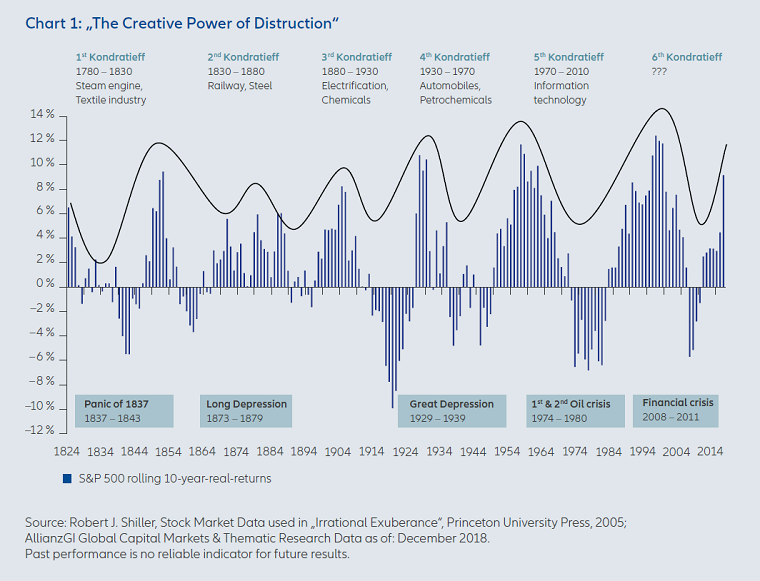
Commodities and yields are not to be found.
A chart published on deconstructingisk uses the same idealized waves depicted in Chart I and similarly connects them with stock market performance, innovation waves, and war.
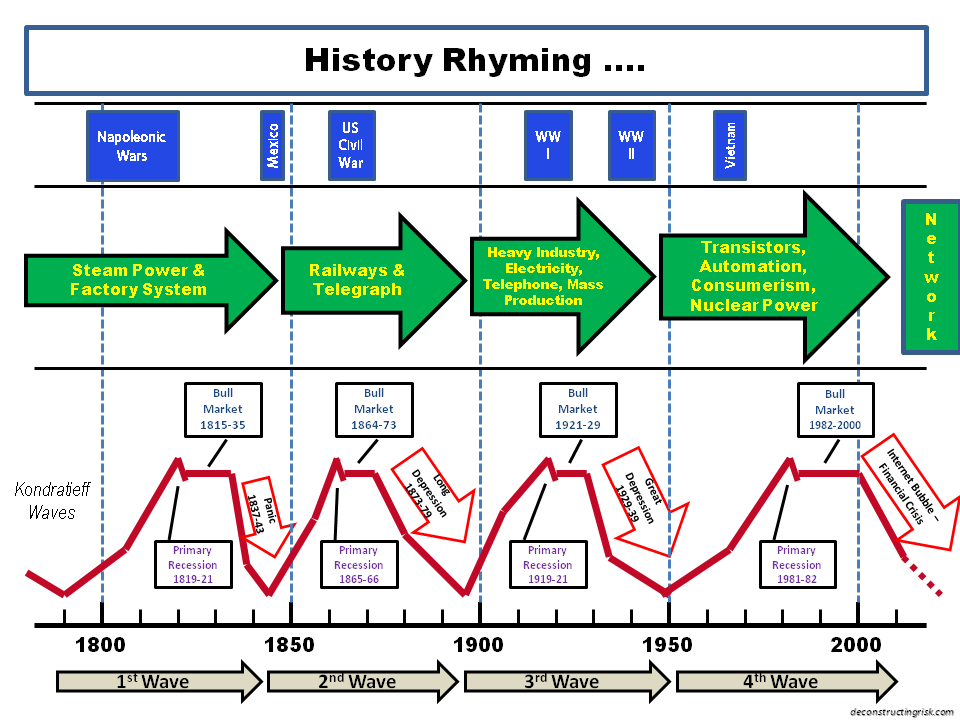
But, we still do not have commodities or yields and not much in the way of actual market data to tell us what the waves actually represent.
Stifel Nicolaus sees Kondratiev Waves in commodity inflation and (at least some) major wars.
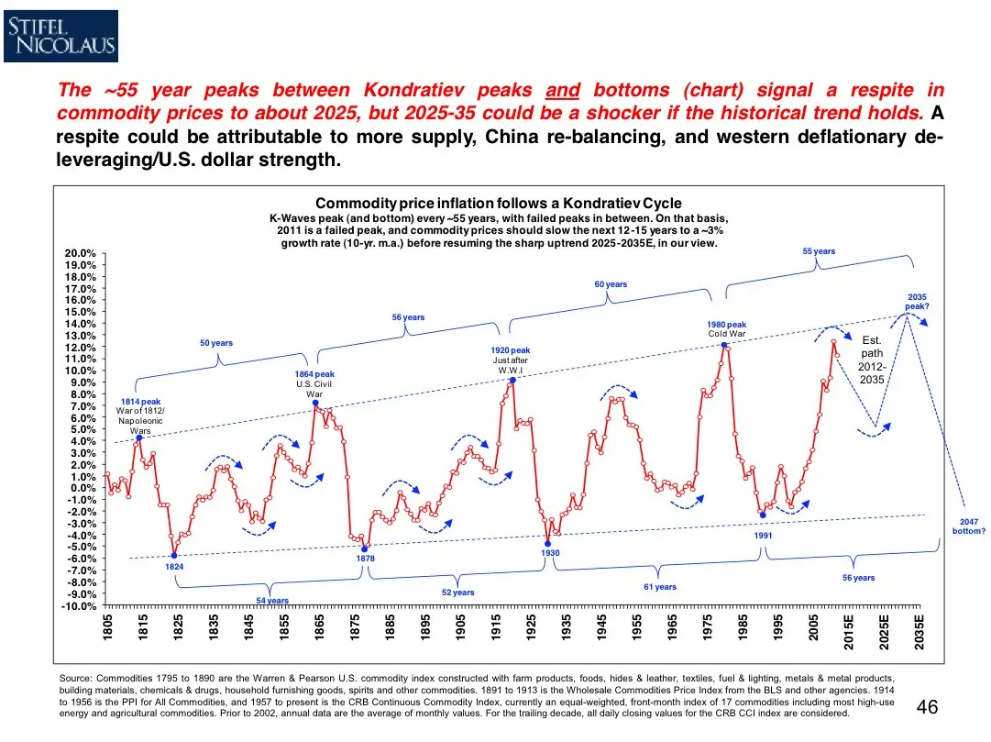
This chart is probably closest in spirit to Kondratiev’s original claims, but it turns a blind eye to the high commodity inflation of the 1940s and 2000s and ignores both World War II and the “War on Terror” to maintain the 50- to 60-year pattern.
Collectively, the charts on Schumpeter’s innovation waves and Kondratiev’s market waves differ on a number of key points. They disagree on timing, they disagree on what exactly is being measured and what factors are related, and they disagree teleologically, for lack of a better word. That is, the tech-focused charts tend towards optimism while the market-focused ones tend towards pessimism.
How on earth did Schumpeter and Kondratiev grow so far apart?
Technocratic Intervention
The simple answer, I think, is that Kondratiev and Schumpeter were writing at the very beginning of the turn towards a technocratic management of society that seemed to guide the macroeconomy along a path of stable growth, positive inflation, and virtually guaranteed profits.

- 5.1-channel 80-Watt powerful surround sound system
- 4K60, 4K120AB and 8K60B HDMI 2.1 with HDCP 2.3 and...
- Dolby Vision, Hybrid Log-Gamma and BT.2020
- Supports enhanced media and gaming - ALLM, VRR
- YPAO automatic room calibration

- Low-Profile Modern Design - Clean silhouettes,...
- Powerful Performance - Brilliant clarity,...
- Simple Setup, Streaming & Control - Get setup and...
- 5.1-Channel Sound - Experience a powerful...
- 6 Total Speakers - Full-range drivers deliver...
Last update on 2024-04-05 / Affiliate links / Images from Amazon Product Advertising API
It is indisputable that technocratic intervention caused inflation, for example, to go through a structural rise which, by definition, fed into a permanent elevation in price levels (and profits) of almost all kinds. I think it is unclear if that was deliberate policy. Edward Nelson’s paper suggests that the link between the Federal Reserve and long-term inflation was something not recognized until the 1970s. My impression is that the Fed was created with an idea towards maintaining short-term cyclical price stability and only later did this morph into long-run ‘inflation stability’, which we nevertheless still call “price stability”. Once the connection between central banking and inflation was accepted, the mission was then further augmented to include the suppression of aggregate unemployment.
What seems especially clear is that the technocrats do not understand that inflation stability has been generated less through deliberate engineering than by inadvertently goosing the transformation of the American economy into hyperindustrialization that culminated in an increasingly bloated consumer/service economy. Because services inflation is more stable than inflation in industrial goods and primary commodities, the replacement of volatile goods with stable services in the CPI/PCE/GDP baskets brought about “stability” in inflation and GDP growth. This “stability” seems to have occurred at the price of long-term macro-distortions in the industrial and agricultural base of the American (and later, Western and East Asian) labor force (witness the rise and fall of Detroit), unbalanced globalization, the rise of the suburb at the expense of both country and city, unsustainable public and private debt, and excessive returns on financial assets.
I have written about this structural economic process in greater detail in A Reply To Professor Cowen On The Cost Disease and on some of the social, demographic, and political consequences of this process in How The Fed Is Knocking The World Off Balance.
Ranting against technocratic malfeasance is not quite the point, however. The issue is the simultaneous apparent split in Kondratiev Waves and Schumpeter Waves. My argument is that these waves were both disrupted at roughly the time the two economists wrote about them, and because it appeared that the technocrats were determining some positive outcomes in the wake of the Depression, the inscrutableness of these older wave phenomena, as well as their diminishing powers of prediction, made them appear like something that might be found in a farmer’s almanac rather than in a serious theory of the economy.
The Fed—the existence of the Fed, not its policies—distorted price signals (beginning with the inflation of the 1910s, followed by the Roaring Twenties, and then the Depression), but this structural change in the economy was almost impossible to disentangle from short-term disturbances (geopolitics, cyclical booms/busts, new technology, lax/tight Fed policy, government policy), many of which were themselves unknowingly being driven or enhanced by Fed-induced structural change.
By the time the global economy was neck-deep into depression, people were desperate for Keynesian solutions in the Anglosphere and, in other parts of the developed world, even more draconian measures, many of which appeared to work. As Paul Samuelson put it, “‘The way I finally convinced myself was to just stop worrying about [understanding Keynes’s analysis]. I asked myself: why do I refuse a paradigm that enables me to understand the Roosevelt upturn from 1933 till 1937?’”
If we extend 1937 to 1947 to 1957 to 1967 and beyond, it appears that Keynesianism, with some Monetarist tweaks here and there, explains all we need to know about the macroeconomy. Profits, GDP, and inflation tend to rise fairly consistently. GDP comes in a bit low at times and inflation a bit hot, but with the appropriate mashing of monetary and fiscal levers and some well-crafted policy prescriptions, things will likely be set aright sooner rather than later.
It is this attitude combined with and reinforced by the actual behavior of economic variables, which were affected by the technocratic order, that destroyed Kondratiev Waves as an apparent phenomenon and allowed Schumpeter Waves to be hijacked by techno-maximalists.
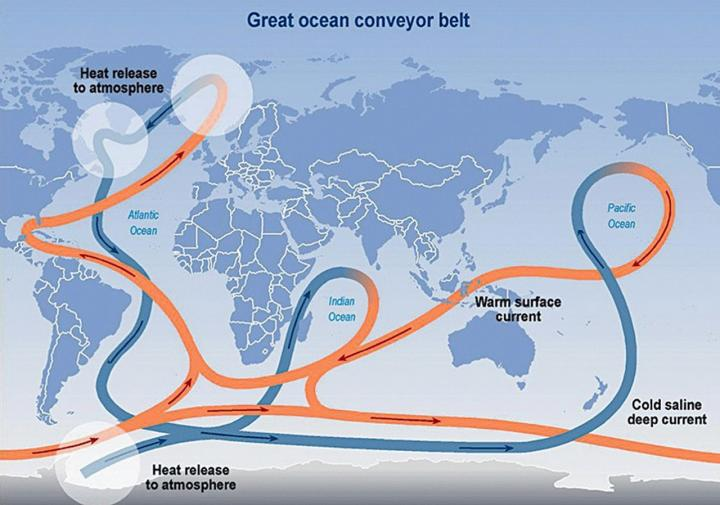
But, Kondratiev and Schumpeter were right in their basic formulations. Beneath the surface of macroeconomic certainty, the currents—to mix oceanic metaphors a bit—flow just as strongly as they used to. Just as currents might flow in one pattern under one climatological regime, so they might flow differently under a different climatological regime. But, the currents still flow and still must follow some basic physical principles.
When the capitalist core switched from a gold standard to a central bank standard—“fiat” does not quite capture the change—this appears to have altered the behavior of the currents but did not alter the principles that govern them.
And Yet It Moves
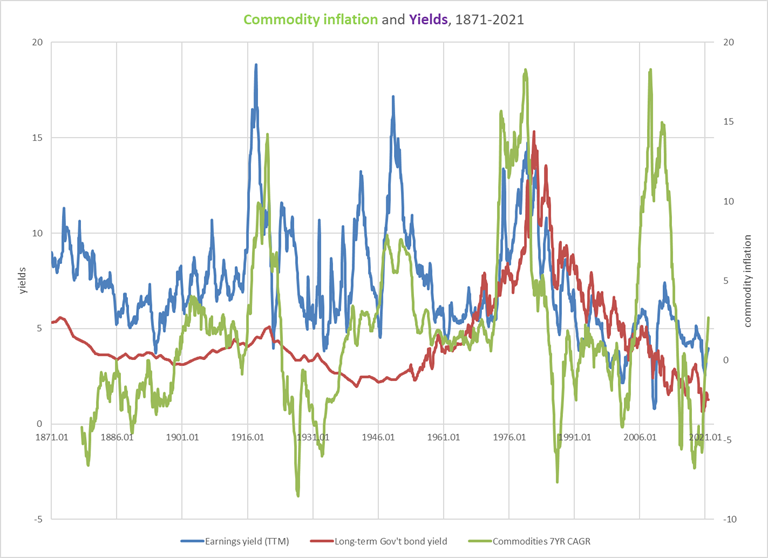
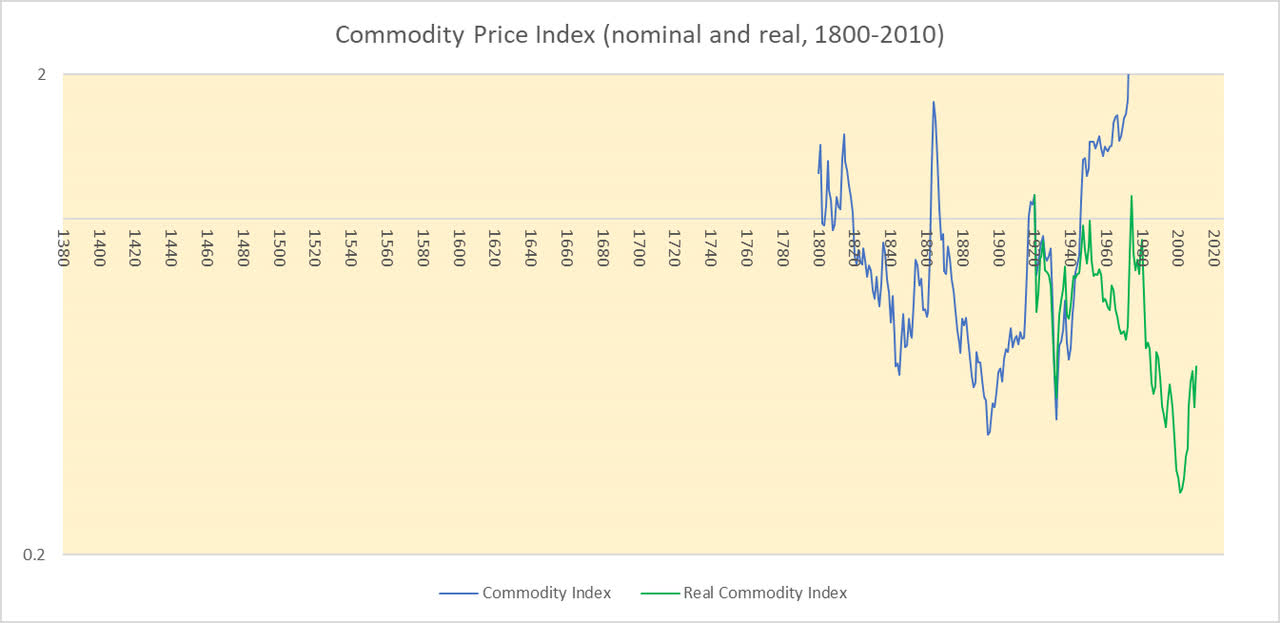
The old patterns continue to hold. The earnings yield is correlated with real commodity prices.
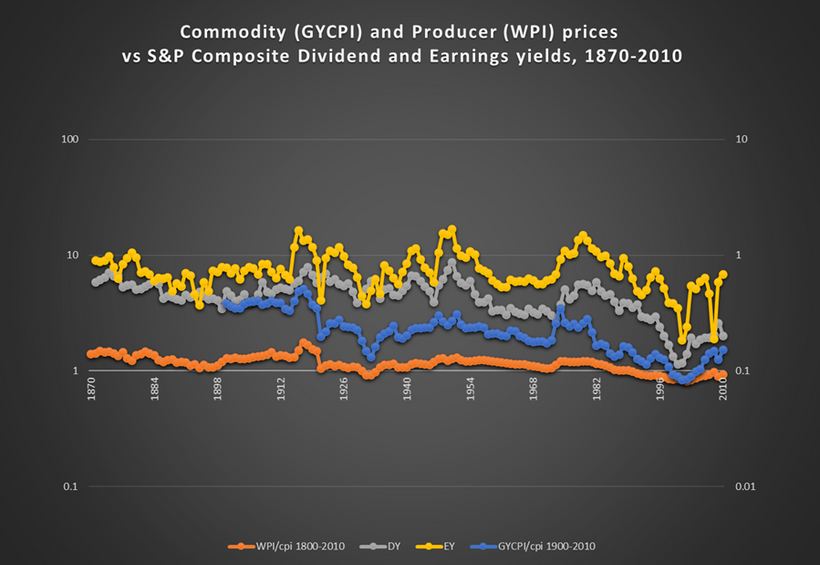
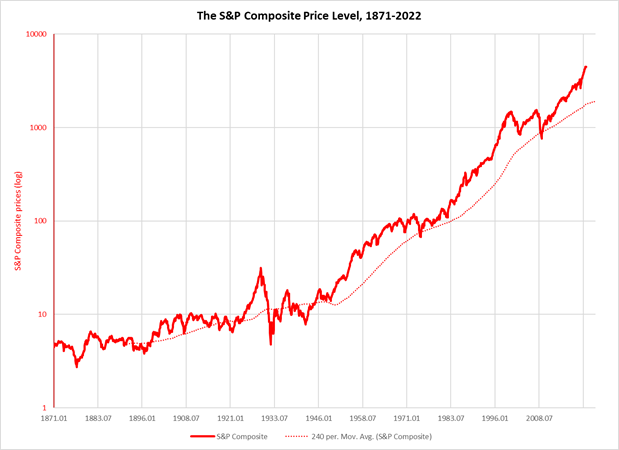
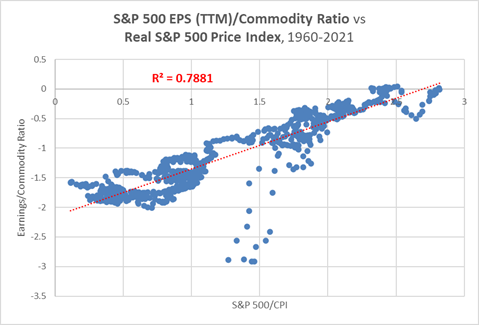
And, the ratio of earnings to commodity prices is strongly correlated with real stock prices.
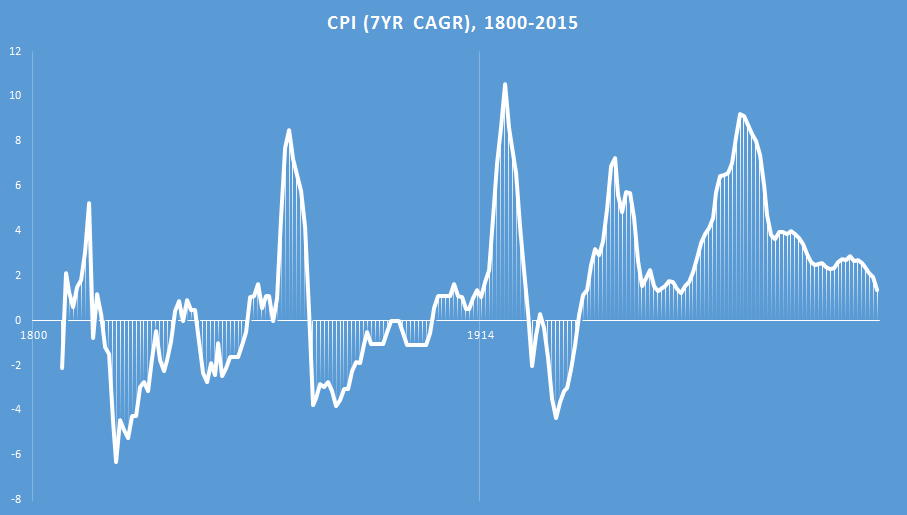
The patterns hold, but the waves have become more frequent. Commodity prices used to spike every 50-60 years, but since the establishment of the Fed, commodities and the earnings yield spike every 30 years.
The peaks in commodity prices and the earnings yield appear to coincide with “global deaths in conflict” depicted in Max Roser’s chart below.
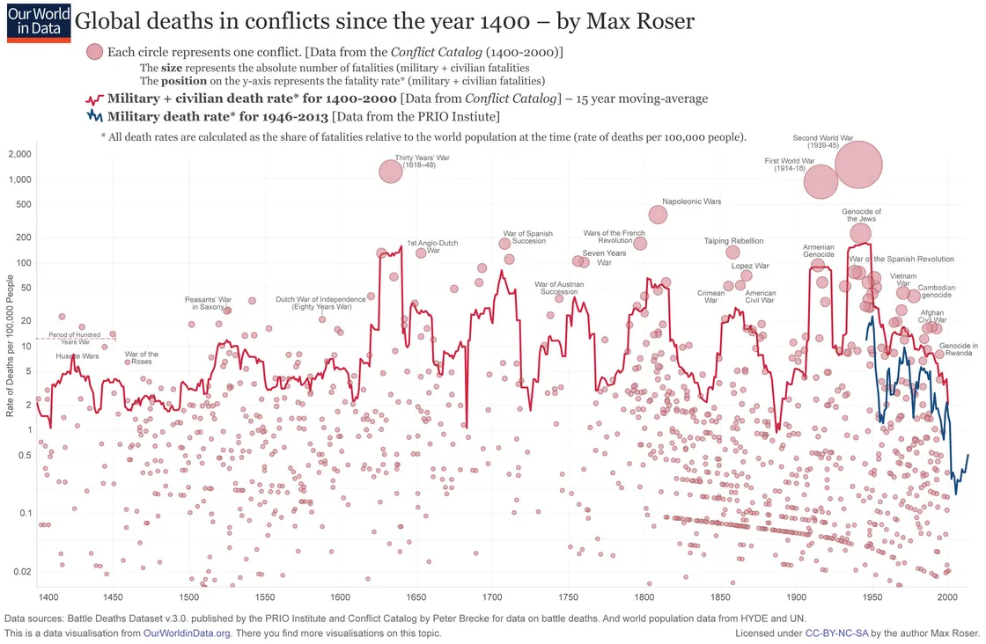
I have tried to superimpose nominal and real commodity prices for the 1800-2010 period (Chart U) over Chart T to construct Chart V.
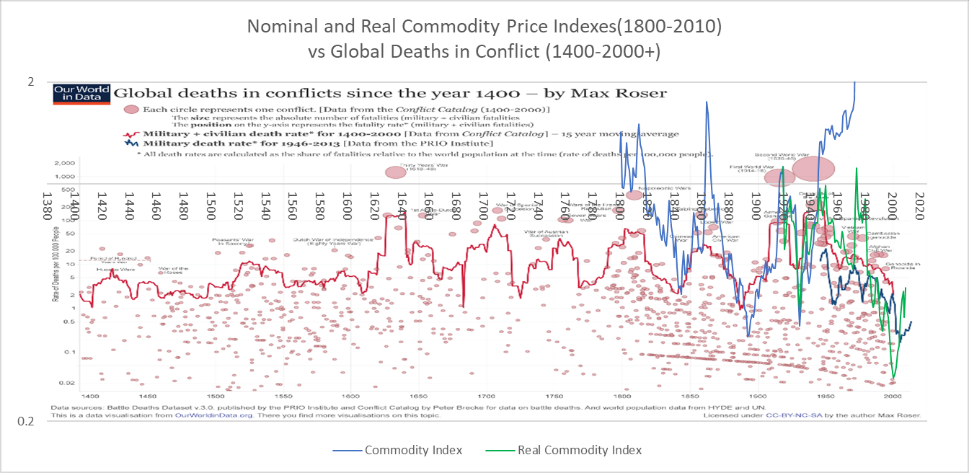
It appears to me that these two measures of commodity prices are broadly correlated with global conflict.
Kondratiev Was Right

- SAMSUNG USA AUTHORIZED - Includes 2 Year Extended...
- Samsung 85 Inch DU8000 Crystal UHD LED 4K Smart TV...
- UHD Dimming | Auto Game Mode (ALLM) | Alexa...
- SAMSUNG TIZEN OS: Stream your favorite shows, play...
- BUNDLE INCLUDES: Samsung DU8000 Series 4K HDR...
- SAMSUNG USA AUTHORIZED - Includes 2 Year Extended...
- Samsung 75 Inch DU8000 Crystal UHD LED 4K Smart TV...
- UHD Dimming | Auto Game Mode (ALLM) | Alexa...
- SAMSUNG TIZEN OS: Stream your favorite shows, play...
- BUNDLE INCLUDES: Samsung DU8000 Series 4K HDR...

Last update on 2024-04-05 / Affiliate links / Images from Amazon Product Advertising API
Kondratiev’s claim about the link between commodity price waves and major wars appears to have largely held up nearly a century after he wrote about it. “[A]s a rule, the most disastrous and extensive wars and revolutions occur” “during the period of the rise of the long waves”, he wrote in The Long Waves. So, this period of rising prices, expanding global markets, and new techniques of production is also a period of violent political turmoil. He describes this period as one of “high tension in the expansion of economic forces”.
And, since the earnings yield appears to be tightly linked to both commodity prices and, of course, stock prices, all of these factors—war, commodity prices, the earnings yield, and stock prices—appear to be interlinked with one another. We could throw in consumer inflation, which has tended to track movements in the real prices of commodities, as well. What remains is the links between Kondratiev Waves in markets and war and the Schumpeter Waves in innovation.
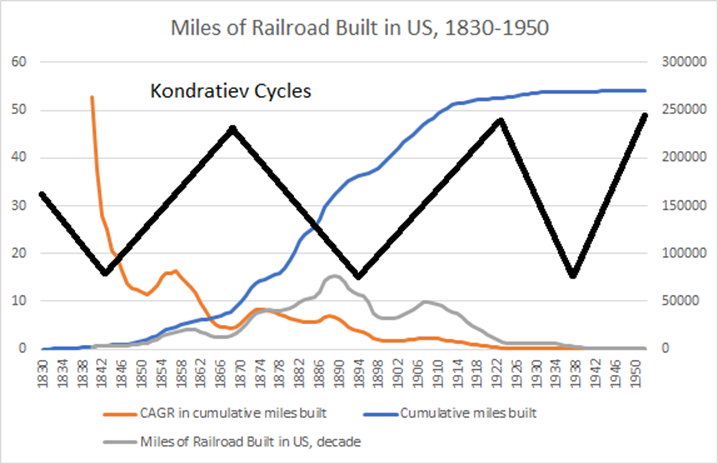
On technology, Kondratiev wrote, “During the recession of the long waves, an especially large number of important discoveries and inventions in the technique of production and communication are made, which, however, are usually applied on a large scale only at the beginning of the long upswing.”
As we saw in Part I with the history of “railroadization” in relation to the Kondratiev Wave that peaked in the 1860s, the period of fastest growth in the application of that innovation was from the 1830s to 1860s, but the period of largest leaps in diffusion was from the 1860s to 1890s, the period of the downswing. If Kondratiev’s phrase “applied on a large scale” is a reference to the period in which an innovation is successfully introduced into the market and begins its journey to ubiquity, he also seems to have been correct on this point.
Conclusion
In Part 3, we are going to look at the diffusion curves of disruptive innovations—the Schumpeter Waves—of some of the major innovations of the last century and how they relate to the Kondratiev Waves that emerged after the Russian economist’s death. I believe we will find that the primary difference between the waves before the establishment of the US central bank and after is that “important discoveries and inventions in the technique of production and communication” (emphasis mine) dominated before and important discoveries and inventions in the technique of consumption and communication dominate after.