


AVUS is an actively-managed total market ETF that benchmarks against the Russell 3000 Index. Its expense ratio is 0.15% and the ETF has $2.04 billion in assets under management. Managers make selections based on expected returns and a security's price-book ratio. The low-cost active approach is appealing, and AVUS has outperformed its benchmark by 10% since its inception. This track record was third-best in a peer group of 36 ETFs.
AVUS: Active, Affordable, And Attractive Total Market ETF (NYSEARCA:AVUS)
Investment Thesis
The Avantis U.S. Equity ETF (NYSEARCA:AVUS) is a low-cost, actively managed total market ETF catching on quickly. With $2 billion in net assets in just over three years, AVUS has outperformed its Russell 3000 benchmark by 8.74% since October 2019. After reviewing the strategy and fundamentals, I generally like what I see. While using price-book value seems outdated, AVUS trades at a 4.19-point discount on forward earnings to its benchmark and has 1.16% higher estimated earnings growth. I think it will continue to outperform, but the challenge is that another low-cost fund looks superior. I look forward to discussing these two attractive total market ETFs below.
AVUS Overview
Strategy Discussion
AVUS follows a proprietary strategy designed to outperform the Russell 3000 Index. Its fund page describes three key reasons to buy:
- Own U.S. companies across all size segments that managers believe to be trading at lower valuations and with higher profitability ratios.
- Obtain the benefits of indexing (diversification, low turnover, transparency), and the flexibility active management provides.
- Provide efficient management that reduces unnecessary risks and costs.
The primary draw is active management, and AVUS has an ultra-low 0.15% expense ratio. For reference, I track the performance and fundamentals of 170 actively-managed U.S. Equity ETFs, and the average expense ratio is 0.64%. AVUS ranks 10th lowest, though seven direct peers have fees between 0.11% and 0.13%. Owning the entire market is straightforward from an Indexing perspective, and Avantis seeks to improve the Russell 3000 Index by making minor changes based on proprietary analysis. Based on results since its inception, the approach has worked.

Since October 2019, AVUS has gained an annualized 13.70% compared to 11.79% for the Vanguard Russell 3000 ETF (VTHR). VTHR has an 0.10% expense ratio, and readers may also consider the larger iShares Russell 3000 ETF (IWV), which has a 0.20% annual fee.
AVUS outperformed VTHR by 5.39% in 2022 after underperforming by 3.37% in 2020. This tighter range of returns is the objective because managers prefer cheaply-valued stocks. Such companies typically outperform in drawdowns but underperform in strong, sometimes irrational, bull markets.

AVUS's fact sheet provides some insight into the proprietary strategy. The following footnote, describing expected returns, stood out:
Valuation theory shows that the expected return of a stock is a function of its current price, its book equity (assets minus liabilities) and expected future profits, and that the expected return of a bond is a function of its current yield and its expected capital appreciation (depreciation). We use information in current market prices and company financials to identify differences in expected returns among securities.
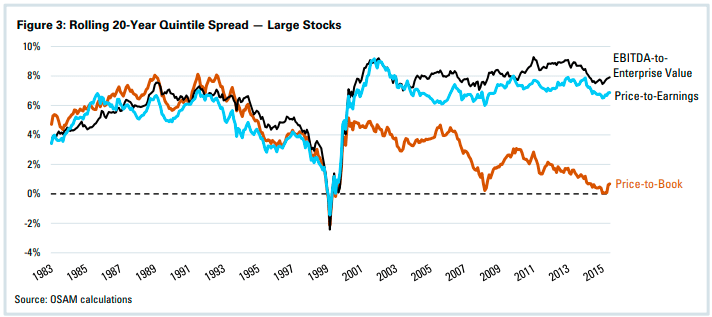
The use of a security's price-book ratio is an odd choice. My view on this metric is influenced by a report by Chris Meredith of O'Shaughnessy Asset Management titled Price-To-Book's Growing Blind Spot. Meredith details his research highlighting the decline in the efficacy of the ratio since the turn of the century. The following chart shows the return spread between the cheapest and most expensive 20 percent of portfolios created by Price-Book, EBITDA-Enterprise Value, and Price-Earnings ratios.
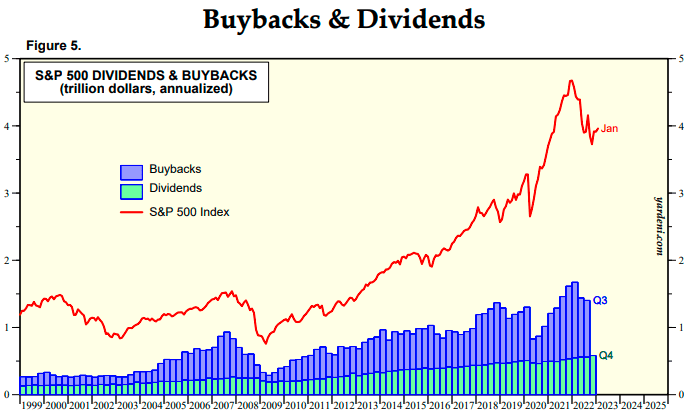
Meredith theorizes that one key reason is an increase in share repurchases. The graph below, provided by Yardeni Research, confirms how repurchases make up a growing portion of the company payments to shareholders.
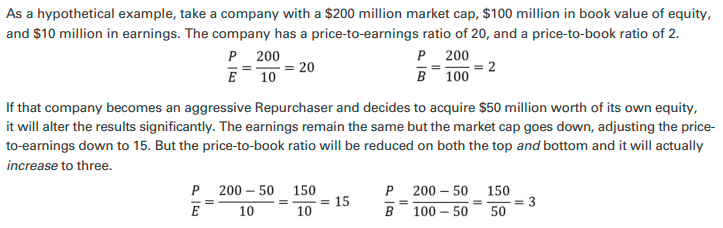
Finally, Meredith provides a simple example to illustrate the effect of an aggressive share repurchaser. In effect, share repurchases reduce a company's price-earnings ratio but increases its price-book ratio. The price-book ratio becomes a less valuable and potentially harmful metric for what's generally considered a positive signal to markets.
On the positive side, this metric is likely one of several included in the model. As mentioned earlier, AVUS still scores well on other valuation metrics and has superior earnings growth, which I'll discuss shortly.
Performance vs. Peers
The Russell 3000 Index is just one benchmark, and I ask readers to consider all options before buying AVUS. I've provided historical returns for 36 ETFs in the following table. According to FactSet Research, all have a “Total Market” focus with expense ratios of 0.15% or less. The table is sorted by trailing three-year returns through January 2023.
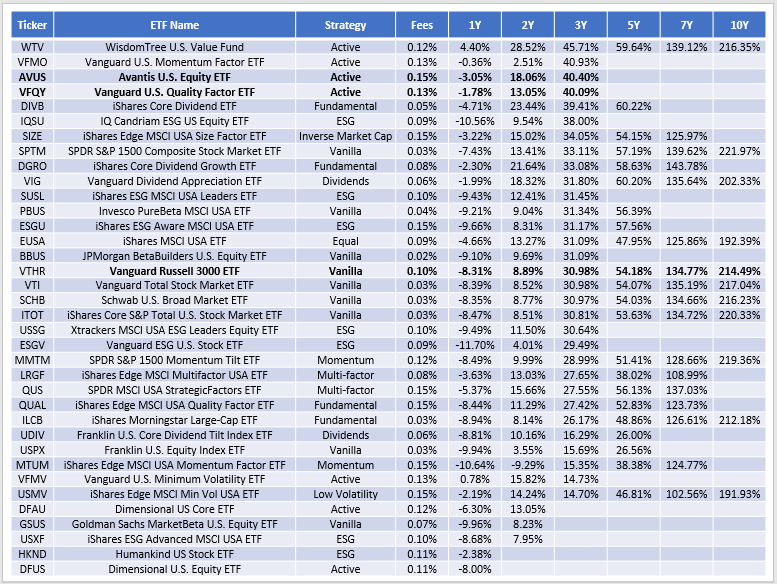
Based on the last three years, there's room for active strategies. AVUS's 40.40% gain was third-best behind the WisdomTree U.S. Value Fund (WTV) and the Vanguard U.S. Momentum Factor ETF (VFMO). The Vanguard U.S. Quality Factor ETF (VFQY) was fourth-best, with plain-vanilla ETFs like VTHR generating average returns.
AVUS Analysis
Top Holdings and Sector Exposures
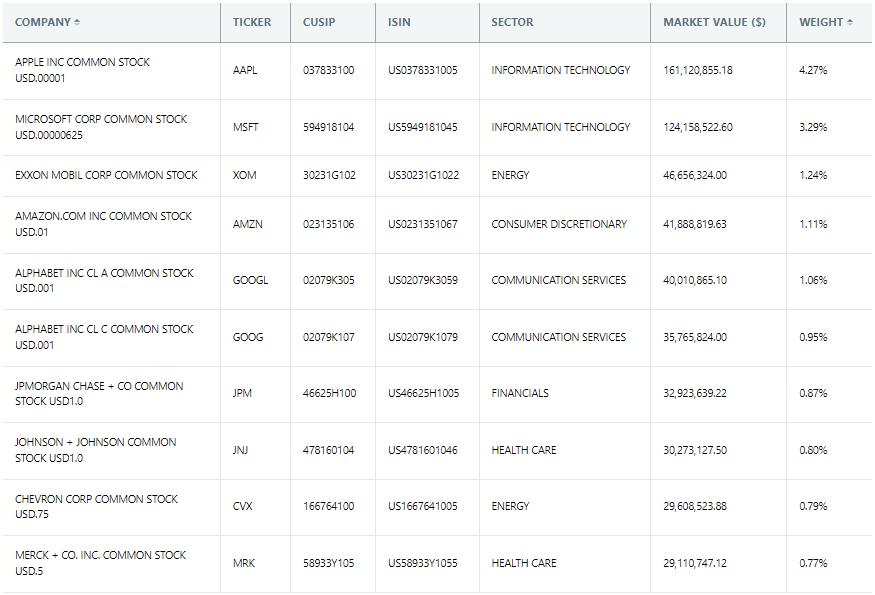
AVUS's top ten holdings represent 15.15% of the portfolio, headlined by Apple (AAPL) and Microsoft (MSFT). These stocks total 7.56% compared to 10.26% in VTHR, indicating managers re-weight securities instead of excluding them. AVUS holds approximately 2,300 securities.
Sector exposures for both funds are listed below. Lower allocations to Apple and Microsoft contribute to a 4.75% underweighting in Technology compared to VTHR. In exchange, AVUS overweights the Financials sector by 4.25%, likely due to valuation.

This table also includes sector exposures for VFQY, the fourth-best performer in the earlier table. VFQY has a different composition than AVUS and is geared more toward small- and mid-cap stocks. However, it's still well-diversified with 555 holdings and has a superior value and growth combination.
AVUS Fundamentals By Industry
AVUS' top 25 industry fundamentals are listed below, alongside summary metrics for VTHR and VFQY. This view accounts for 56.53% of the portfolio, a surprisingly high amount for a fund with many holdings.

These metrics will comfort AVUS shareholders, as most are favorable compared to VHTR. AVUS's estimated sales and earnings growth rates of 10.26% and 11.34% are 0.13% and 1.16% higher, yet the portfolio trades at a 4.19-point discount on forward earnings. However, I'm not seeing the superior profitability touted in the “reasons to buy” section earlier. AVUS's 8.62/10 Profitability Score, derived from individual Seeking Alpha Factor Grades, is 0.32 points below VTHR. It's also the seventh-lowest in the 36-ETF sample highlighted earlier. It's not a deal-breaker because of the superior valuation (seventh-lowest), but that usually happens as the market cap decreases. Here are some additional statistics compared to the peer group to support the weak profit score.
- Gross Profit Margin: 46.43% (#30)
- EBIT Margin: 21.48% (#28)
- EBITDA Margin: 27.38% (#27)
- FCF Margin: 11.79% (#34)
- Return on Common Equity: 25.59% (#17)
- Return on Total Capital: 14.69% (#14)
- Return on Assets: 10.12% (#23)
If AVUS's weaker profitability isn't an issue, you'll likely appreciate the actively-managed VFQY. Its $80 billion market capitalization is on the low end, as is its 8.40/10 profit score, but its growth and valuation metrics are superior. VFQY trades at 19.99x forward earnings, has 13.68% estimated earnings growth and has the same active management benefits as AVUS for just 0.13% in annual fees. VFQY's 5.62/10 EPS Revision Score indicates better earnings momentum than AVUS. One of the ways it achieves this is by having negligible exposure (0.98%) to Apple and Microsoft, which have EPS Revision Grades of “C” and “D+”, respectively. Until market sentiment improves due to solid earnings results and surprises, it's prudent to shift away from mega caps. VFQY does that better than AVUS at the moment.
Investment Recommendation
AVUS is an impressive total market fund. It provides investors with the benefits of active management for a low 0.15% expense ratio, and its track record since inception is excellent. However, I found managers' use of the price-book ratio outdated. Also, I question the claim that high-profitability securities are favored. Valuation likely carries significantly more weight, and in a year like 2022 when richly-valued stocks were punished, this screen served shareholders well. That might not work out as well long-term, and readers should remember that AVUS only launched three years ago. Assessing a manager's stock-picking abilities over such a short period is challenging.
VFQY is another low-cost actively-managed ETF that diversifies away from the mega caps. Its track record is equally impressive as AVUS, and its earnings growth and momentum metrics look better. If I had to pick one, VFQY would be it, which is why I decided to limit my rating on AVUS to a hold. Thank you for reading, and I look forward to discussing these ETFs and other alternatives in the comments section below.