


VYM and SCHD are two of the most popular dividend ETFs. The dividend profile of SCHD looks superior with better yield and dividend CAGR.VYM is more diversified and asset-intensive, but this didn’t seem to help in outperforming SCHD.
VYM Vs. SCHD: Which Is The Superior Dividend ETF?
When it comes to dividend ETFs, the Schwab Strategic Trust – Schwab U.S. Dividend Equity ETF (NYSEARCA:SCHD) and the Vanguard High Dividend Yield ETF (NYSEARCA:VYM) are two of the most popular with both of them sharing many similar or even identical characteristics. But should an investor be indifferent between the two? A closer look at the ETF’s holdings indicate that VYM is slightly more asset intensive, which could be an advantage in an inflationary environment.
However, the track record indicates that SCHD has done much better over a long period and has yielded superior risk-adjusted returns. Even in the high-inflationary environment of the last 2 years, VYM didn’t outperform SCHD in a meaningful way. When it comes to dividend yield and dividend CAGR, SCHD also seems to have the upper hand. Overall, while both ETFs seem like a solid choice for dividend investors, I find SCHD to be the better one.
A high level view
VYM is Original Postrofile/vym#portfolio-composition">designed to track the FTSE High Dividend Yield Index, using a replication technique. This means that the ETF is entirely passive and management has no leeway to act even if a mispricing opportunity is identified. On the other hand, the passive nature of the fund enables for a very lean cost structure of just 0.06%.
On the other hand, SCHD is benchmarked to the Dow Jones U.S. Dividend 100 Index. However, management doesn’t have a mandate to fully replicate the index. According to its prospectus, the fund aims to invest 90% of its assets into the benchmark, while there’s a discretion regarding the remaining 10%. Despite the more flexible investment policy, SCHD also offers a very lean cost structure with and expense ratio of just 0.06% – exactly the same as VYM.
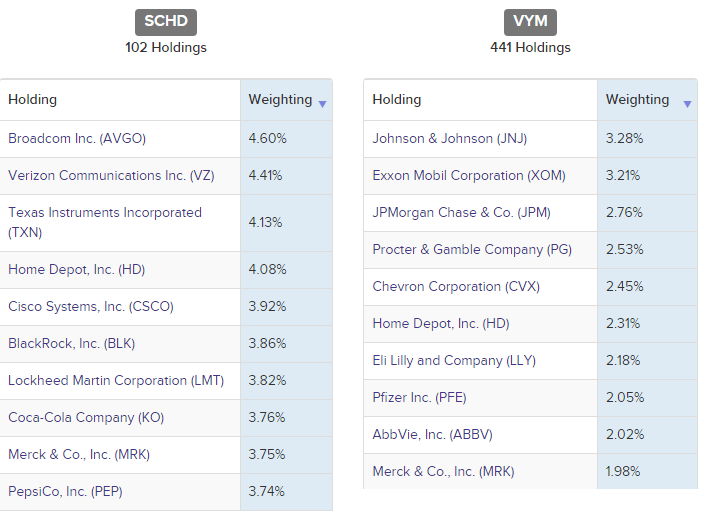
In terms of AUM, the ETFs are very similar with VYM being slightly bigger. However, VYM is more diversified as it includes more than 4 times the number of holdings of SCHD. In turn, this makes the latter slightly more concentrated in its top 10 position than its counterpart. That being said, I doubt that this additional diversification will make a difference, given that both ETFs have sufficient numbers of constituents.
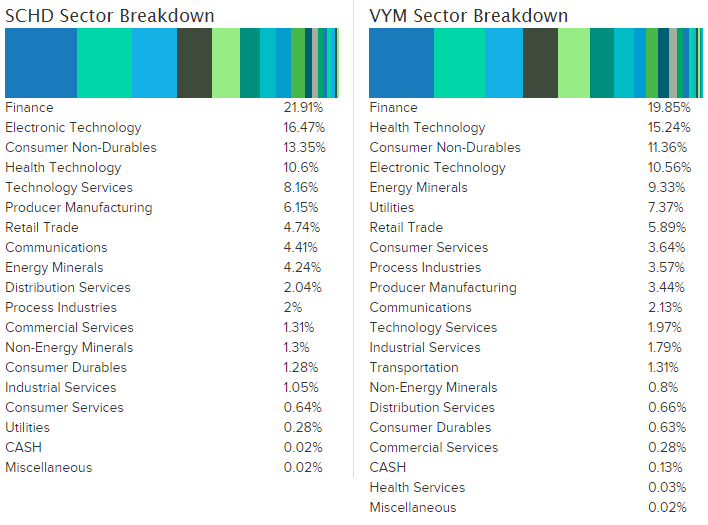
In terms of sector exposure, Financials dominate with approximately 20% weight. However, VYM has more than double the energy exposure of its counterpart. Also, utilities take a larger part of its portfolio, compared to SCHD. Both of those sectors are quite asset-intensive, which could indicate better performance of VYM in an inflationary environment. The P/B ratio of VYM confirms its larger relative asset base as it stands at 2.7, compared to 3.7 for SCHD.
Dividend profile

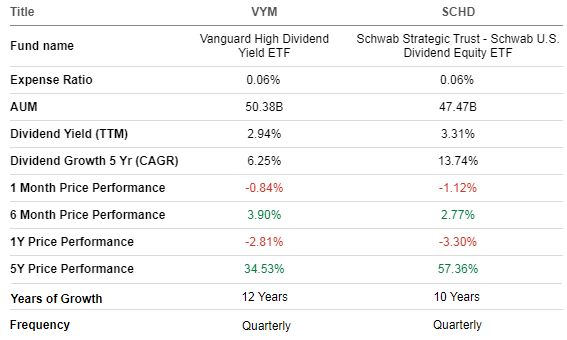
The two ETFs are identical in terms of frequency of dividend payments as they make quarterly distributions to their shareholders. In terms of TTM yield, SCHD has the upper hand at 3.31%, compared to 2.94% for VYM. When it comes to dividend growth, while VYM has a slightly longer track record of consecutive distribution increases, the 5-year dividend growth CAGR of SCHD is superior at more than double the rate for VYM. So when it comes purely to the dividend profile, SCHD seems superior.
Return comparison

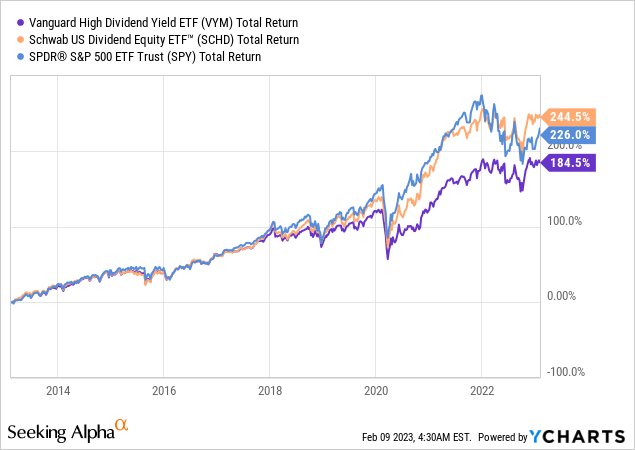
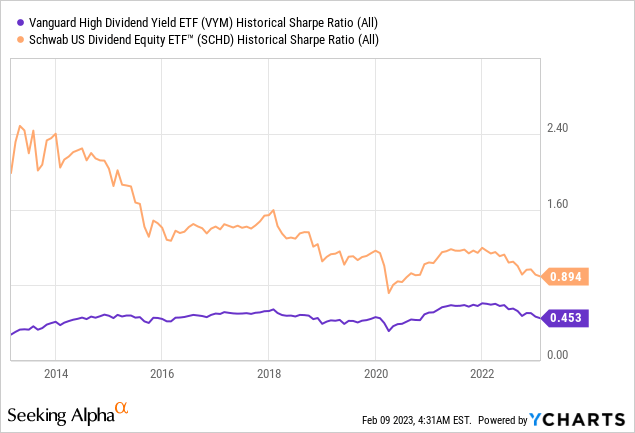
Despite dividends being the main feature of both ETFs, capital appreciation is always much welcomed. In terms of total return, over a long 10-year period, SCHD had significantly outperformed its counterpart and even the broad market, represented by SPDR S&P 500 Trust ETF (SPY). In terms of risk-adjusted returns, SCHD had also done better for the entire period, as indicated by its much higher Sharpe ratio.

As I mentioned, one of the differences between both funds is the asset intensity. VYM has more exposure into asset “heavy” businesses like energy and utilities, so in theory it should do better in high inflationary environment, just like the one from the last two years.
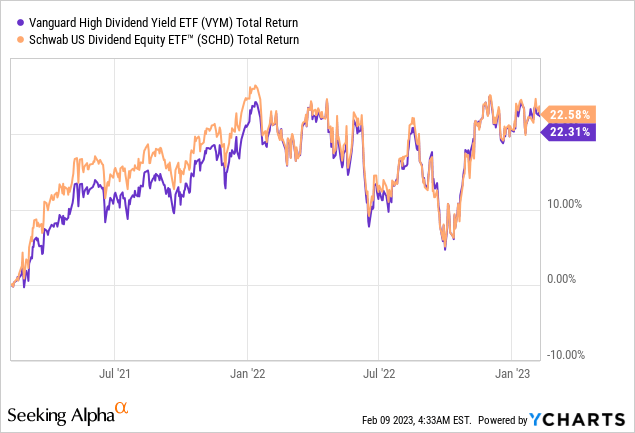
However, the data indicates that even with elevated inflation, VYM was not able to outperform, but just match the returns of SCHD. Now that inflation appears to be cooling off this supposed advantage of VYM will likely fade away and it may continue to lag behind SCHD.
Conclusion
Despite having “high yield” in its name, the Vanguard High Dividend Yield ETF has been outperformed by SCHD, as the latter has a superior dividend profile with higher yield and more than double the CAGR of dividends for the last 5 years. In terms of total return, VYM has also lagged behind considerably in a long 10-year period. Its asset-heavier portfolio has not been able to outperform, but just match the results of SCHD in the high inflationary environment of the last 2 years. For these reasons, I find SCHD to be the better ETF.