


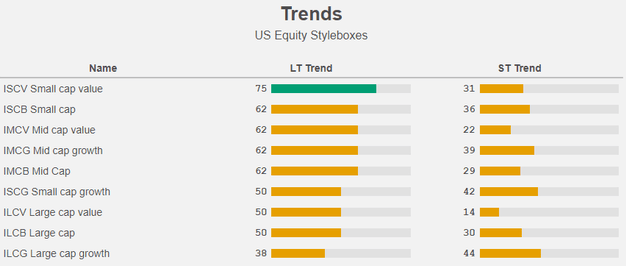
Our previous article featured the below table (Figure 1) and this made us think about equal weighted ETFs.
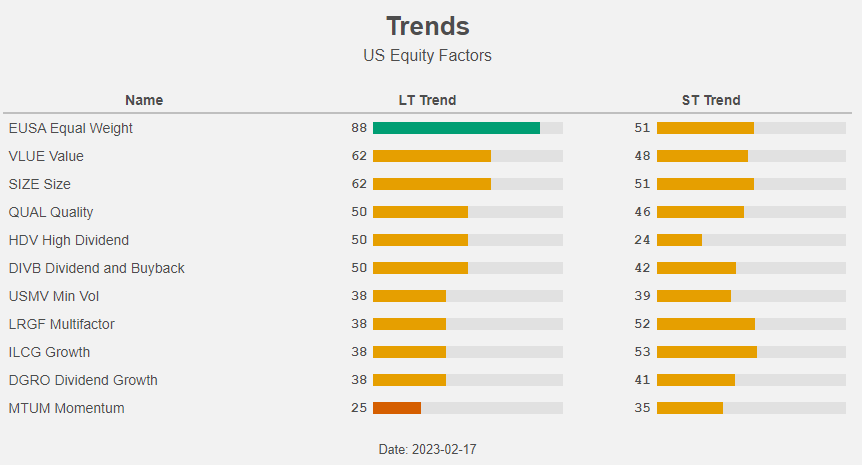

Figure 1: Trends (Yahoo! Finance, Author)
Equal weighting is outperforming “normal” market cap weighting, due to the underperformance of the big tech names like Alphabet (GOOGL), and Meta (META).
Will big tech keep underperforming or will they return to the limelight? We count on the former and hence expect equal weight to keep outperforming. Our favourite ETF is the Invesco S&P 500 Equal Weight ETF (NYSEARCA:RSP). Buy!
Giant 7 underperformance
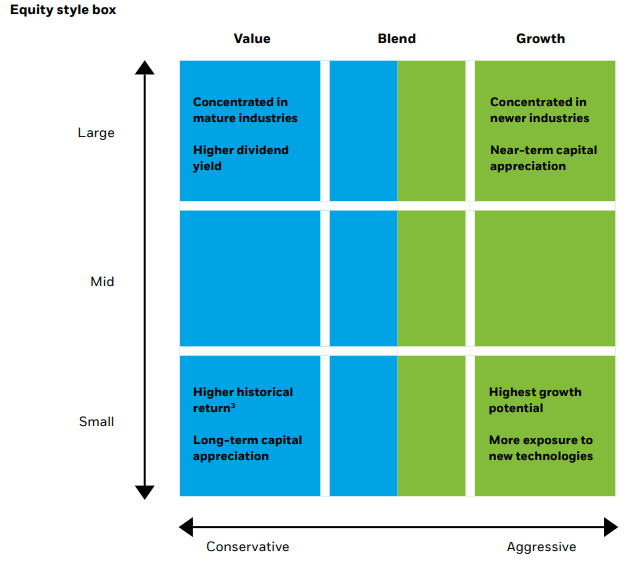
In 1992 Morningstar introduced the so-called Morningstar Style Box. It's a nine-square classification grid that measures securities by size, and places them somewhere between “growth” and “value”.

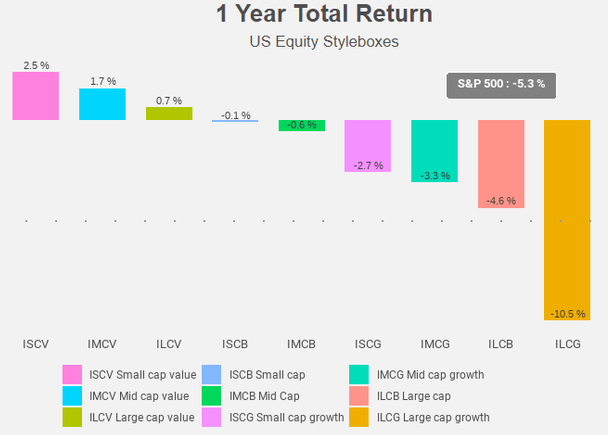
When we look at the style-box-performance over the past year, we see that all style-boxes are outperforming the S&P-500, with one exception: large cap growth.

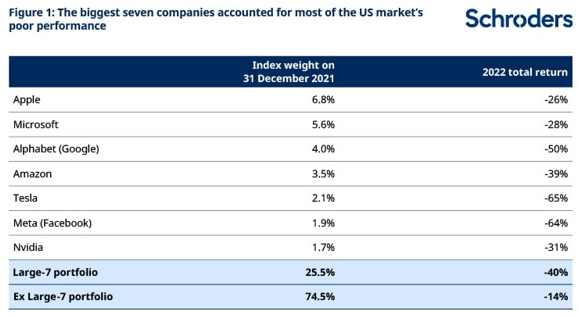
Research by Schroders shows that most of the negative performance of US equities in 2022 was due to the seven biggest companies.

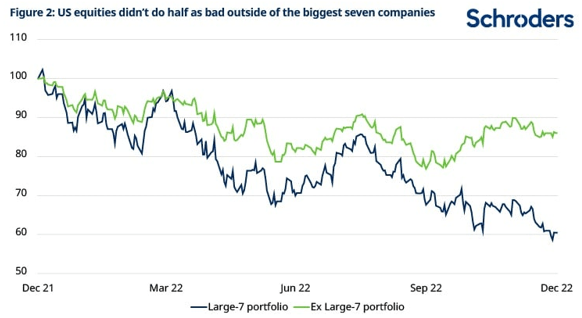
Those “giant 7” are Amazon (AMZN), Tesla (TSLA), Alphabet, Meta, Apple (AAPL), Microsoft (MSFT), and Nvidia (NVDA). Together they fell 40%, while the other constituents of the MSCI USA Index fell (only) 14%.

Equal weighting
An equal-weighted portfolio invests an equal amount of money in each stock, regardless of the stock's market capitalization.

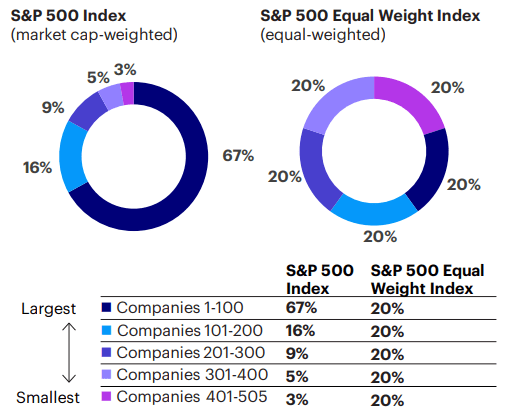
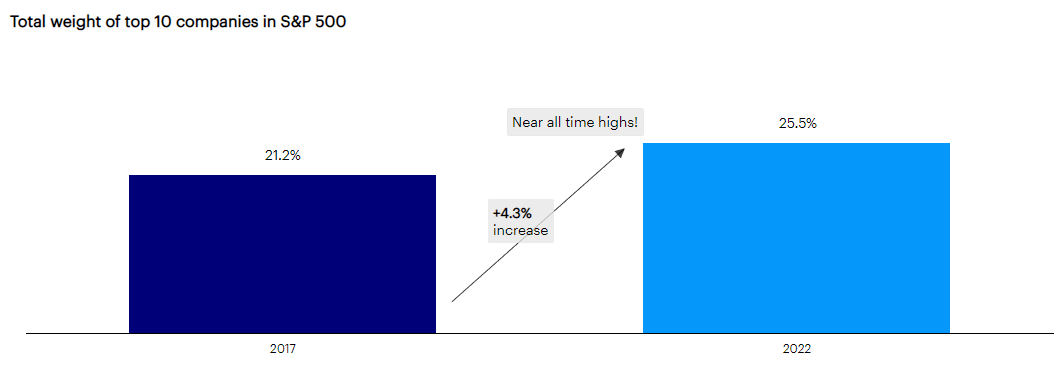
It goes without saying that an equal weight portfolio is more diversified. The past 5 years the S&P 500 only got more concentrated.
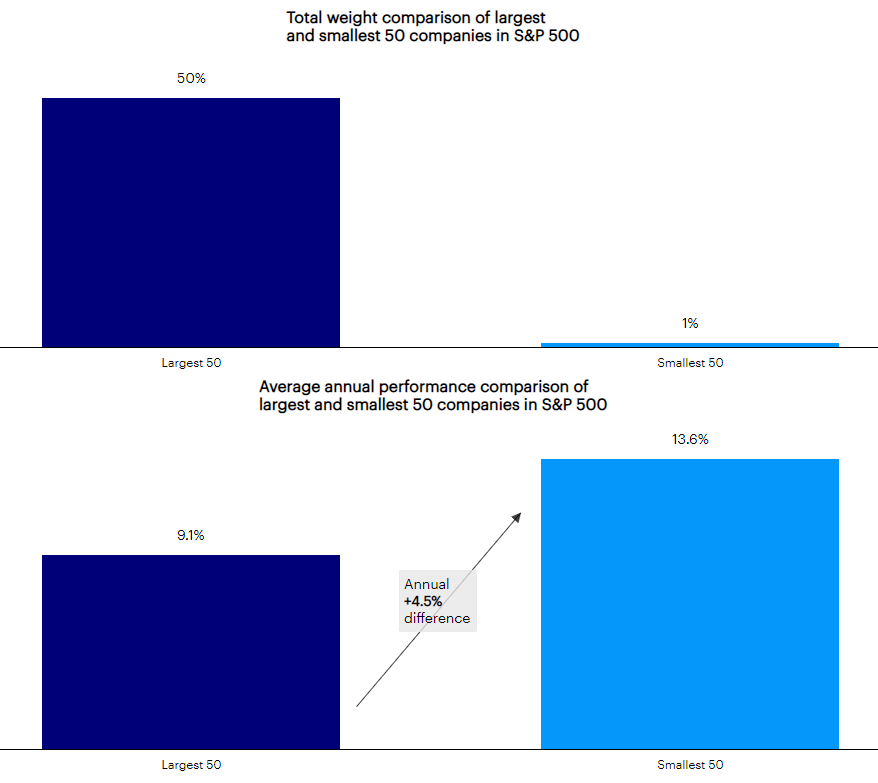
In comparison with a market cap weighted portfolio like e.g. the S&P 500, an equal weight portfolio has a much bigger exposure to small caps. The smallest companies in the S&P 500 have tended to provide a better performance. From the end of 2003 until the end of last year the smallest 50 companies in the S&P outperformed the 50 largest members of the index by 4.5% per year.
The largest companies are mostly more expensive than the smaller caps, so an equal weight strategy not only profits from the size-factor but also from the value factor.
As you can see in Figure 1, size and value are only preceded by equal weight regarding the long term trend.
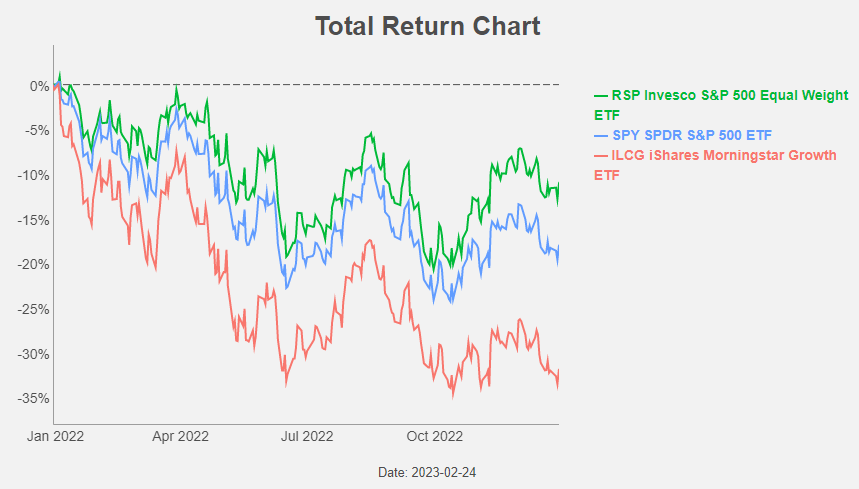
And historically equal-weighted portfolios have outperformed market-cap-weighted portfolios over the long term. This was also the case in the period since the beginning of 2020: RSP has beaten both the SPDR S&P 500 ETF (SPY) and the iShares Morningstar Growth ETF (ILCG).
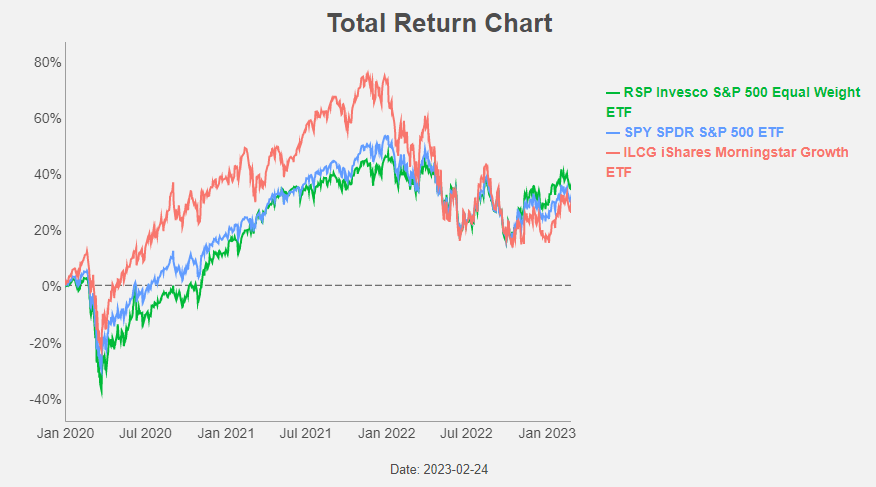
In the era of cheap money the big caps were outperforming and as a consequence equal weighting was underperforming.

Last year the Fed started raising interest rates and this ended the cheap money era: big caps started to underperform. And as a consequence equal weighting started to outperform.
Shift in leadership
Will big tech stage a comeback? When we look at the previous tech bubble in 2000 we can only conclude that market leadership is difficult to maintain after a bubble . The 4 biggest stocks back then (Microsoft, Cisco (CSCO), General Electric (GE) and Intel (INTC)) accounted for 16% of the S&P 500 Index at the top of the bubble. They never reverted to that 16% weight and today they are at a weight of 6%.

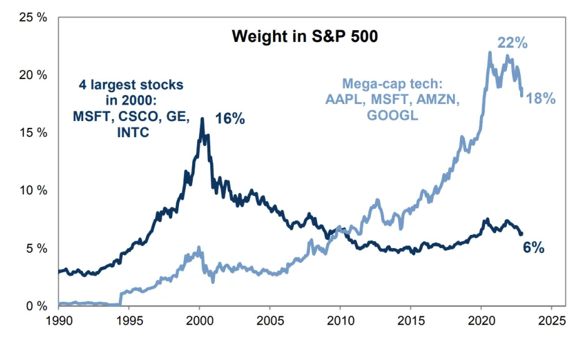
After the bursting of the current bubble the weight of what Goldman Sachs calls the 4 mega-cap tech stocks (Amazon, Alphabet, Apple, and Microsoft) fell from 22% to (only?) 18%. If history is our guide, the change in leadership might lead to a further decline in the weight of those mega caps. This implies further outperformance for equal weighted portfolios.
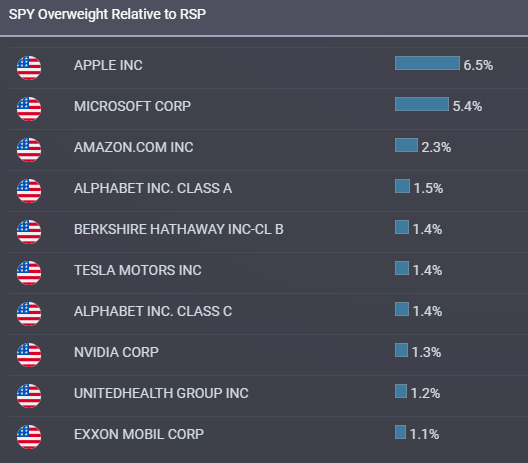
As an aside, please notice that MSFT is present twice!
The long term trends confirm this picture. The future is looking bright for small cap value. On the other side of the spectrum we find large cap growth.

RSP
Our favourite equal weight ETF is the Invesco S&P 500 Equal Weight ETF. RSP has an expense ratio of 0.20%.
The ETF gives an equal weight to each stock in the S&P 500 and as a consequence doesn't take any sector bets. The weight of a sector is simply determined by the number of stocks in the index of each sector.

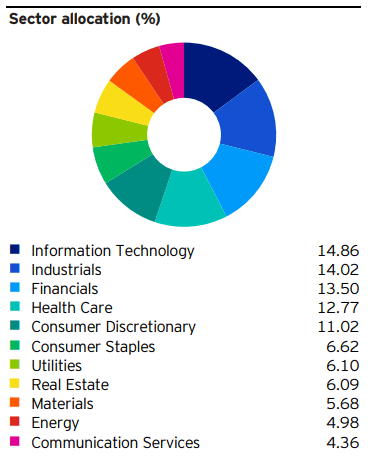
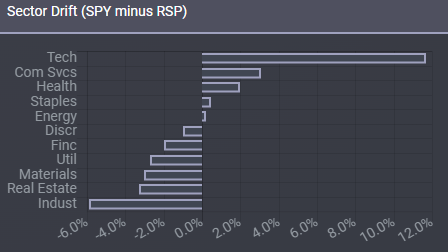
When we compare the sector weights with the S&P 500, we see that RSP is heavily underweight Technology.

On stock-level we see that RSP is also heavily underweight the Giant 7.

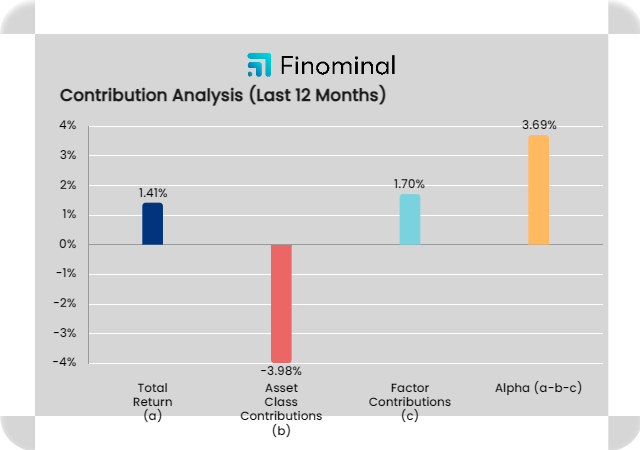
The underperformance of the Giant 7 allowed RSP to deliver an alpha of 3.7% over the last 12 months!

And we expect this outperformance to continue. With a P/E of 16, a P/B of 2.8 and a dividend yield of 1.8% RSP is cheaper on all measures than SPY (with a P/E of 20, a P/B of 3.7 and a dividend yield of 1.6%).
ILCG is on the other hand more expensive a P/E of 28, a P/B of 6.6 and a dividend yield of 0.7%.
Unlike SPY, RSP is in a clear long term uptrend. ILCG on the other hand is in a clear downtrend.

Conclusion
We think inflation is here to stay. It will probably cool, but we believe it will remain the coming years at a level above the 2% FED-target. De-globalization, de-carbonisation and demographics are pushing inflation figures higher than we were used to in the past decade. If this will be the case things are not looking bright for the big cap growth stocks in general and the Giant 7 in particular. The future is much rosier for smaller caps and/or value stocks. A great way to play this trend is through the Invesco S&P 500 Equal Weight ETF