

The EDV long-term bond ETF appears to be breaking above resistance to confirm a significant bottoming pattern. Long-term inflation expectations and the price of gold relative to the commodity complex imply long-term bond yields should be around 50bps lower than they are currently, suggesting EDV upside. A move back down to fair value would result in around 12% returns based on the current duration of the fund.
EDV ETF: The Bond Bull Market Is Not Over Yet (NYSEARCA:EDV)
I last wrote about the Vanguard Extended Duration Treasury ETF (NYSEARCA:EDV) on March 3 when I argued that the inverted US bond yield curve was a reason to be bullish long-term bonds (see ‘EDV: The Inverted Yield Curve Is Another Reason To Be Bullish‘). As I argued then, when long-term yields are significantly below short-term yields, this has typically resulted in long-term yields falling as monetary policy shifts dovish. This is exactly what we have seen happen since then, with 2-year bond yields falling almost 100bps in response to the regional banking crisis, sending 30-year yields down and the EVD higher. The EDV is now up 26% from its October lows and further gains look likely over the coming months. The ETF appears to be breaking above resistance to confirm a significant bottoming pattern. Meanwhile, long-term inflation expectations and the price of gold relative to the commodity complex imply long-term bond yields should be around 50bps lower than they are currently, implying further upside for the EDV.
The EDV ETF
EDV holds a portfolio of 20- to 30-year Treasury STRIPS, which represents a single coupon or principal payment on a US Treasury security that has been stripped into separately tradable components. These securities promise a single payment upon maturity in the next 20-30 years, without any interim coupon payments. As a result of the lack of coupon payments, the fund has an extremely high average duration relative to most bond market ETFs, at 24.4 years, and effective maturity of 24.9 years. The current yield to maturity is around 3.5%, which has fallen by almost a full percentage point from last year's peak, but still remains significantly above long-term inflation expectations.
Short-End Is Leading The Bond Breakout
The sharp reversal in short-term interest rate expectations has breathed new life into the long end of the bond market. As shown below, short-term bond prices are leading the bond market recovery, with the iShares 1-3 Year Treasury Bond ETF (SHY) having posted a higher high and remaining above its January short-term peak.
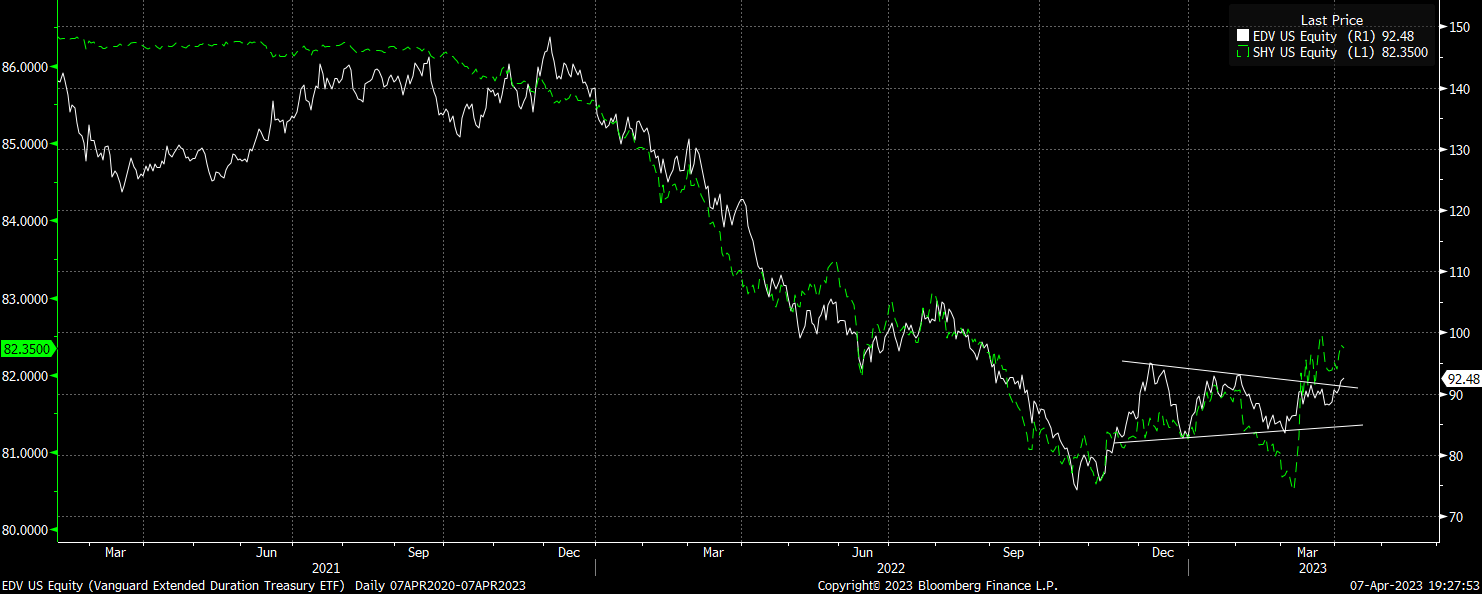
The long end of the curve looks increasingly likely to follow suit, having broken above the contracting range seen over the past three months. With the EDV still down over 50% from its 2020 peak, there is significant room for an upside reversal.
Long-Term Yields Remain Above Fair Value
In previous articles on long-term bonds I have argued the case that both real and nominal GDP growth is likely to be much weaker over the coming years relative to the past. As I noted in ‘EDV: The Inverted Yield Curve Is Another Reason To Be Bullish‘, long-term bond yields have averaged 0.8% below nominal GDP growth since WW2, and with yields on 30-year bonds now at 3.6%, nominal GDP growth would have to average 4.4% for current elevated yields to be justified from a long-term perspective. With real GDP growth likely to average below 1%, and 30-year breakeven inflation expectations at just 2.2%, we should see bond yields move significantly lower over the coming years.
From a short-term perspective, we can also look to other assets that are sensitive to growth and inflation to determine whether we should expect yields to fall or rise. Specifically, 30-year breakeven inflation expectations and the ratio of commodity prices to gold prices. 30-year breakeven inflation expectations are a direct unbiased estimator of long-term average CPI rates derived from the yield differential between regular and inflation-linked bonds. Meanwhile, the price of the commodity complex relative to gold reflects the outlook for real GDP growth as commodity prices tend to fall relative to gold prices in anticipation of slowing demand for industrial commodities.
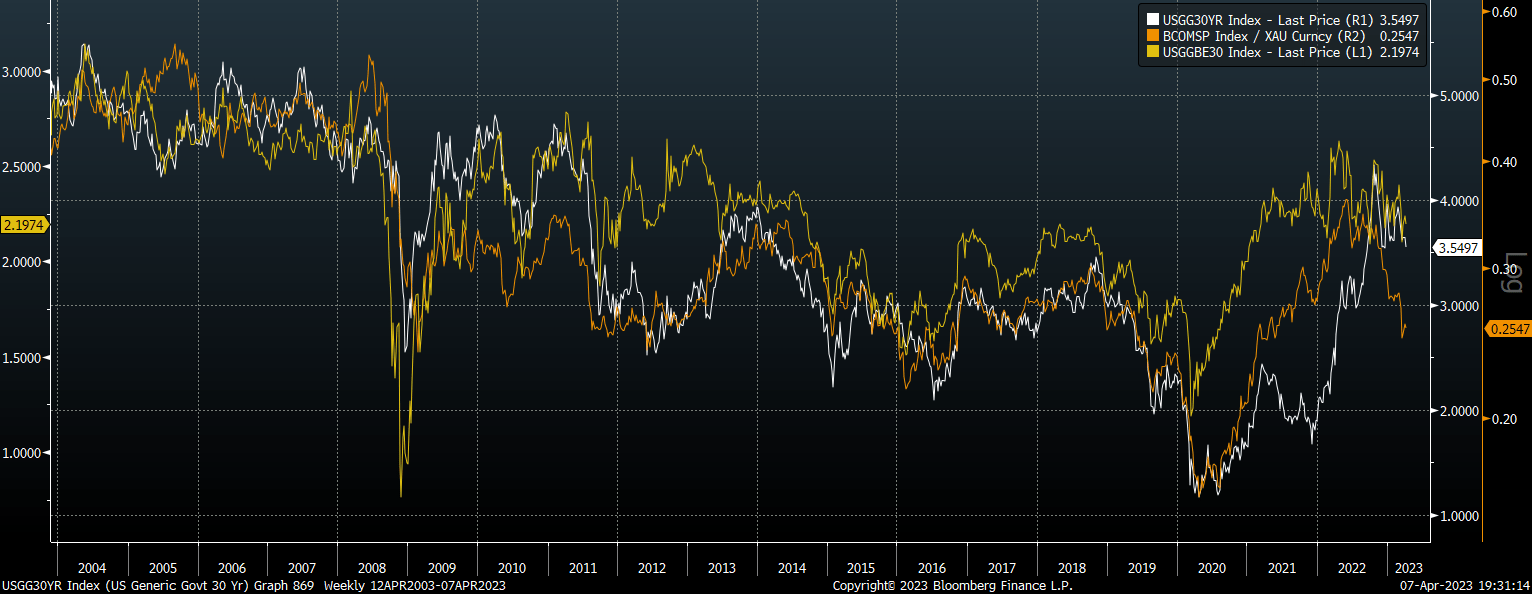
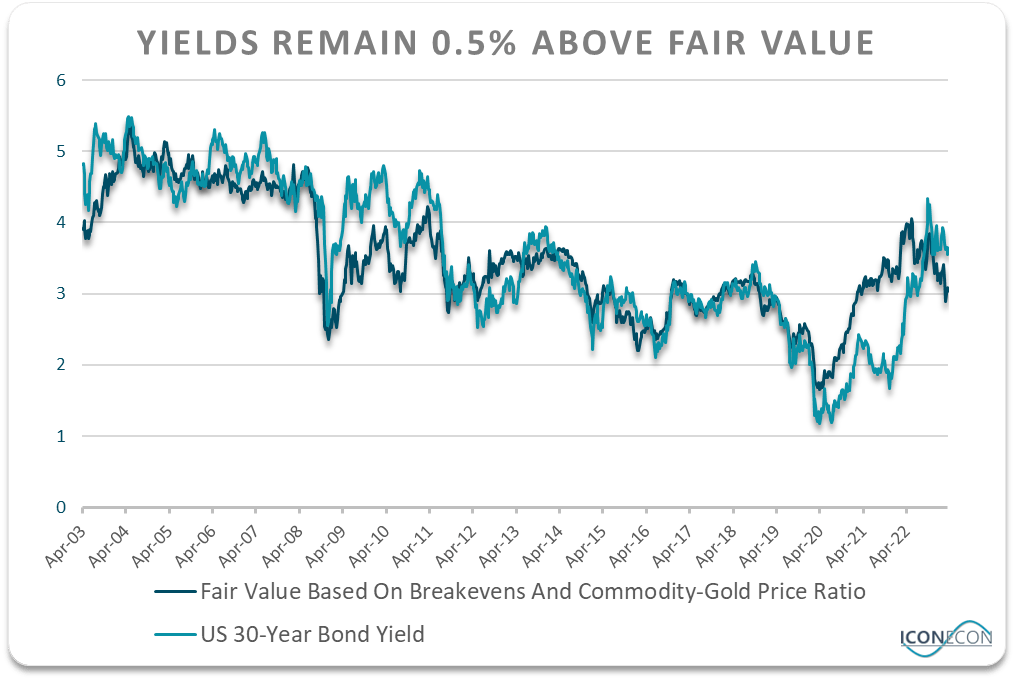
Below is a chart of 30-year bond yields over the past two decades versus the fair value yield based on their correlation with breakevens and the commodity-gold price ratio. When 30-year yields are above this measure of fair value, as they are today, this suggests the EDV should outperform as yields move down to fair value.
The problem with making the assertion that bonds are undervalued based on breakevens and the commodity-gold price ratio is that these factors are both subject to a high degree of volatility. As we saw in early 2009, while bond yields looked high relative to inflation expectations and the commodity-gold price ratio, a sharp recovery in inflation and growth expectations saw yields move higher.
To give another example, the reason the price-earnings ratio is a poor valuation indicator for US stocks is because earnings themselves are highly volatile and therefore a high PE ratio may not reflect stock price overvaluation but a temporary crash in earnings.
That said, there is still a reasonably strong correlation between the degree of over or undervaluation of 30-year bond yields based on the above factors and subsequent returns on the EDV. For instance, at the end of 2021, 30-year yields were fully 150bps below fair value, and the EDV lost 25% of its value over the next 6 months as yields rose back to fair value. Now that yields are over 50bps above fair value, we should expect to see higher than average returns.
The risk is that, as we saw in 2009, a recovery in inflation expectations and commodity prices in response to Fed easing causes the fair value 30-year bond yield to head higher. I admit that breakeven inflation expectations at 2.2% seem too low based on the long-term average CPI rate and the fiscal challenges the US faces. For this reason I am also heavily invested in long-term inflation-linked bonds as a way to take advantage of bond undervaluation while also hedging against a rise in inflation.
Summary
The EDV is a highly volatile bond fund that performs well when long-term bond yields fall. After a grueling bear market over the past two years the EDV finally looks to be breaking to the upside, led by the recovery in short-term bonds. Long-term yields remain elevated relative to nominal GDP growth prospects, and are 0.5% above fair value based on their correlation with inflation expectations and the commodity-gold price ratio. A move back down to fair value would result in around 12% returns based on the current duration of the fund.