


The Invesco S&P 500 GARP ETF combines tenets of growth and value investing strategies into a ‘GARP' fund. The SPGP ETF has delivered exceptional returns in its short history and has outperformed the S&P 500 in both bull and bear markets.
The SPGP ETF may be suitable for investors with above average risk tolerance that seeks to maximize returns.
Recently, I wrote a review of the JPMorgan U.S. Quality Factor ETF (JQUA) and a reader suggested I take a look at the Invesco S&P 500 GARP ETF (NYSEARCA:SPGP).
There is a lot to like with the SPGP ETF. First, the investment strategy is simple to understand. It combines elements of growth investing (earnings and revenue growth) and value investing (modest financial leverage, return on equity, and earnings yield). More importantly, returns have been exceptional in both bull and bear markets.
If there is one caveat with the fund, it is the limited history of the underlying index. Ideally, one would want to see how SPGP's GARP strategy performs in various economic scenarios.
Overall, I believe the SPGP ETF is an exceptional fund that can be considered as part of one's core equity holdings.
Fund Overview
The Invesco S&P 500 GARP ETF (SPGP) is a passive ETF giving investors convenient exposure to the ‘Growth At A Reasonable Price' (“GARP”) investing style, popularized by the famous investor, Peter Lynch.
The SPGP ETF tracks the S&P 500 Growth at a Reasonable Price Index (“Index”), an index composed of approximately 75 stocks in the S&P 500 Index identified as having the highest combination of growth, quality, and value.
The index methodology starts with the stocks in the S&P 500 Index. First, a growth score is calculated from the average of a company's three-year EPS growth rate and its three-year sales per share growth rate. Stocks are ranked by their growth score and the top 150 stocks move on to the next selection criteria.
Next, a quality/value (“QV”) composite score is calculated. The QV score is the average of a company's financial leverage ratio (debt / book value), return on equity, and trailing 12-month earnings yield (inverse of P/E).
The stocks are ranked by QV scores and the top 75 are selected for inclusion in the index. Finally, the GARP Index is weighted by the stocks' growth scores and security weights are capped at 5%. In addition, sector weights are capped at 40%. The SPGP ETF and the underlying index are rebalanced and reconstituted semi-annually.
The SPGP ETF has $3.4 billion in assets and charges a 0.34% total expense ratio.
Portfolio Holdings
Figure 1 shows the sector allocation of the SPGP ETF as of September 5, 2023. Currently, the biggest sector weights are Energy (26.7%), Information Technology (19.8%), Materials (14.1%), Health Care (11.1%), and Industrials (9.2%).
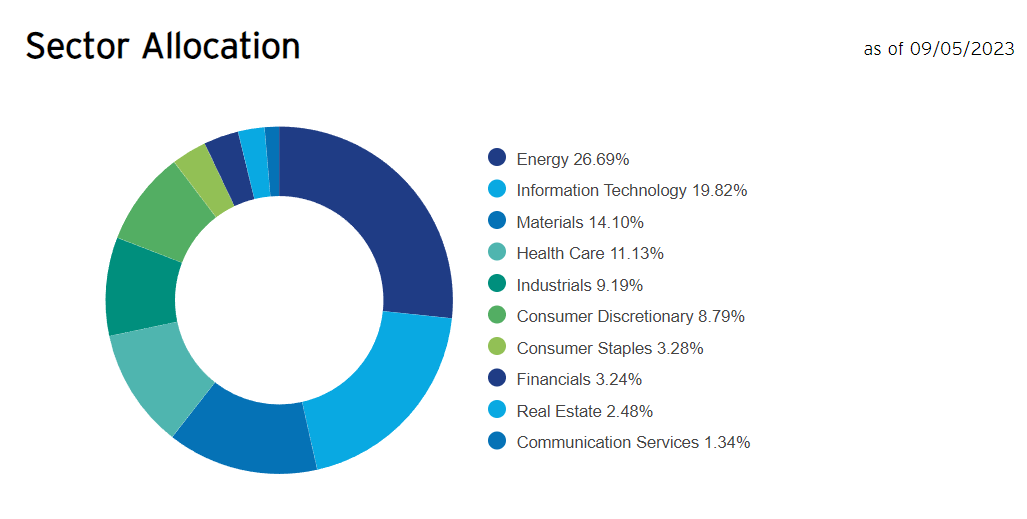
However, investors should be aware that the SPGP ETF's sector allocation can change pretty dramatically. This is because of the index selection criteria that starts with earnings and revenue growth rate, which can differ from period to period.
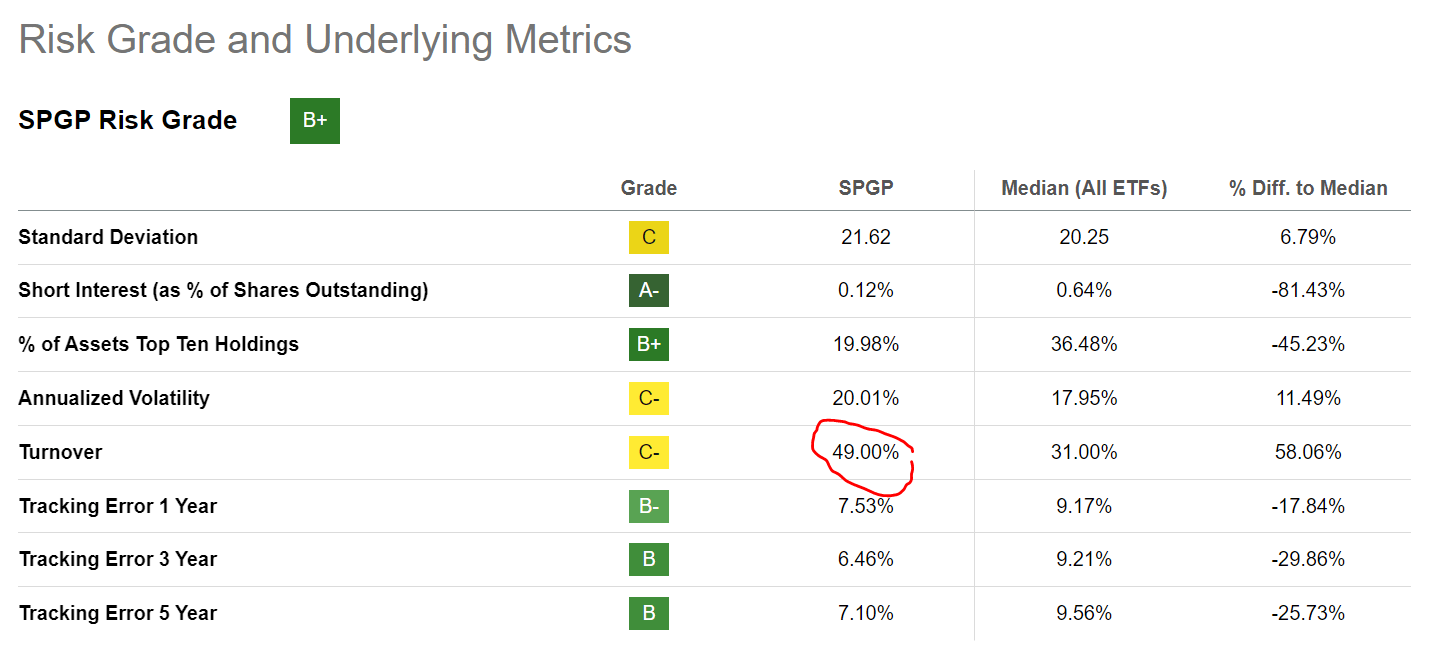
For example, as of October 31, 2022, the fund's largest sector weight was Financials at 27.4%, and Energy only had a 3.6% weight. The dramatic changing of the fund's portfolio leads to higher than average turnover of 49% (Figure 2).
Returns
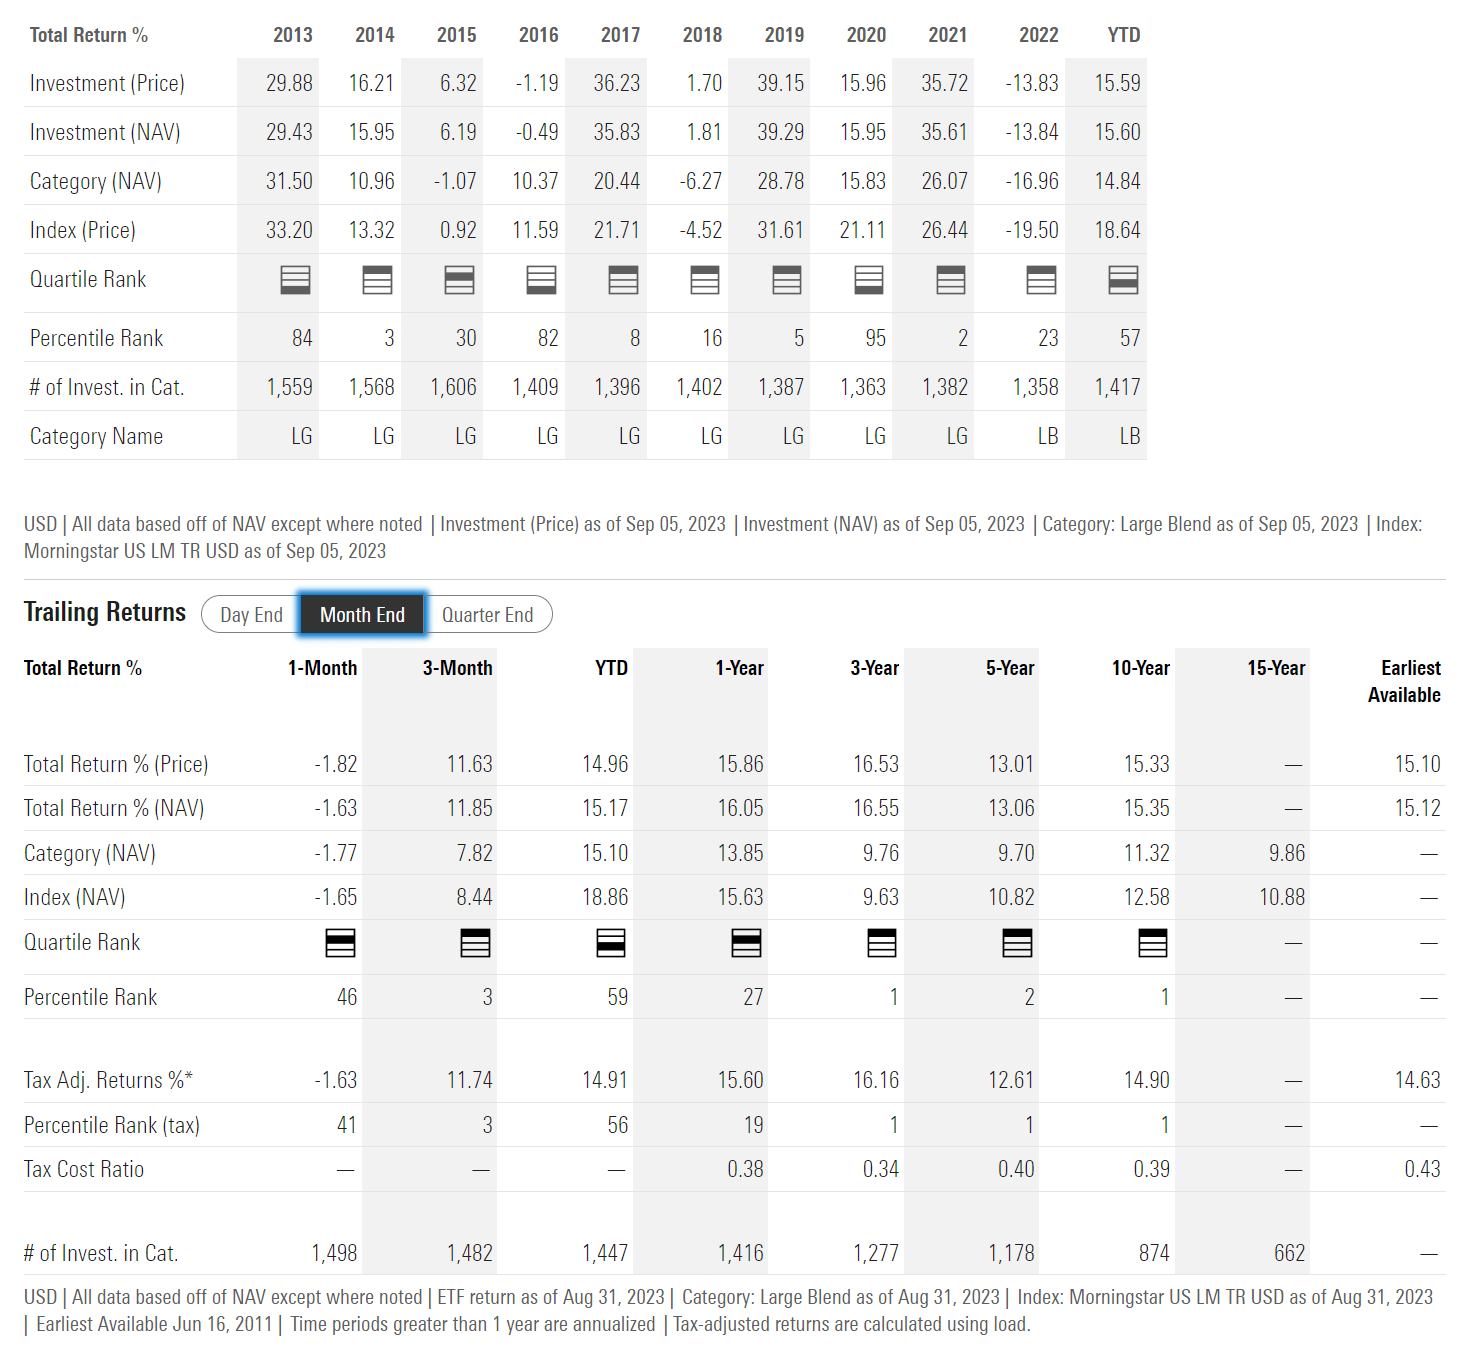
The SPGP has delivered exceptional short-term returns, with 1 and 3 Yr returns of 16.1% and 16.6% respectively to August 31, 2023 (Figure 3).
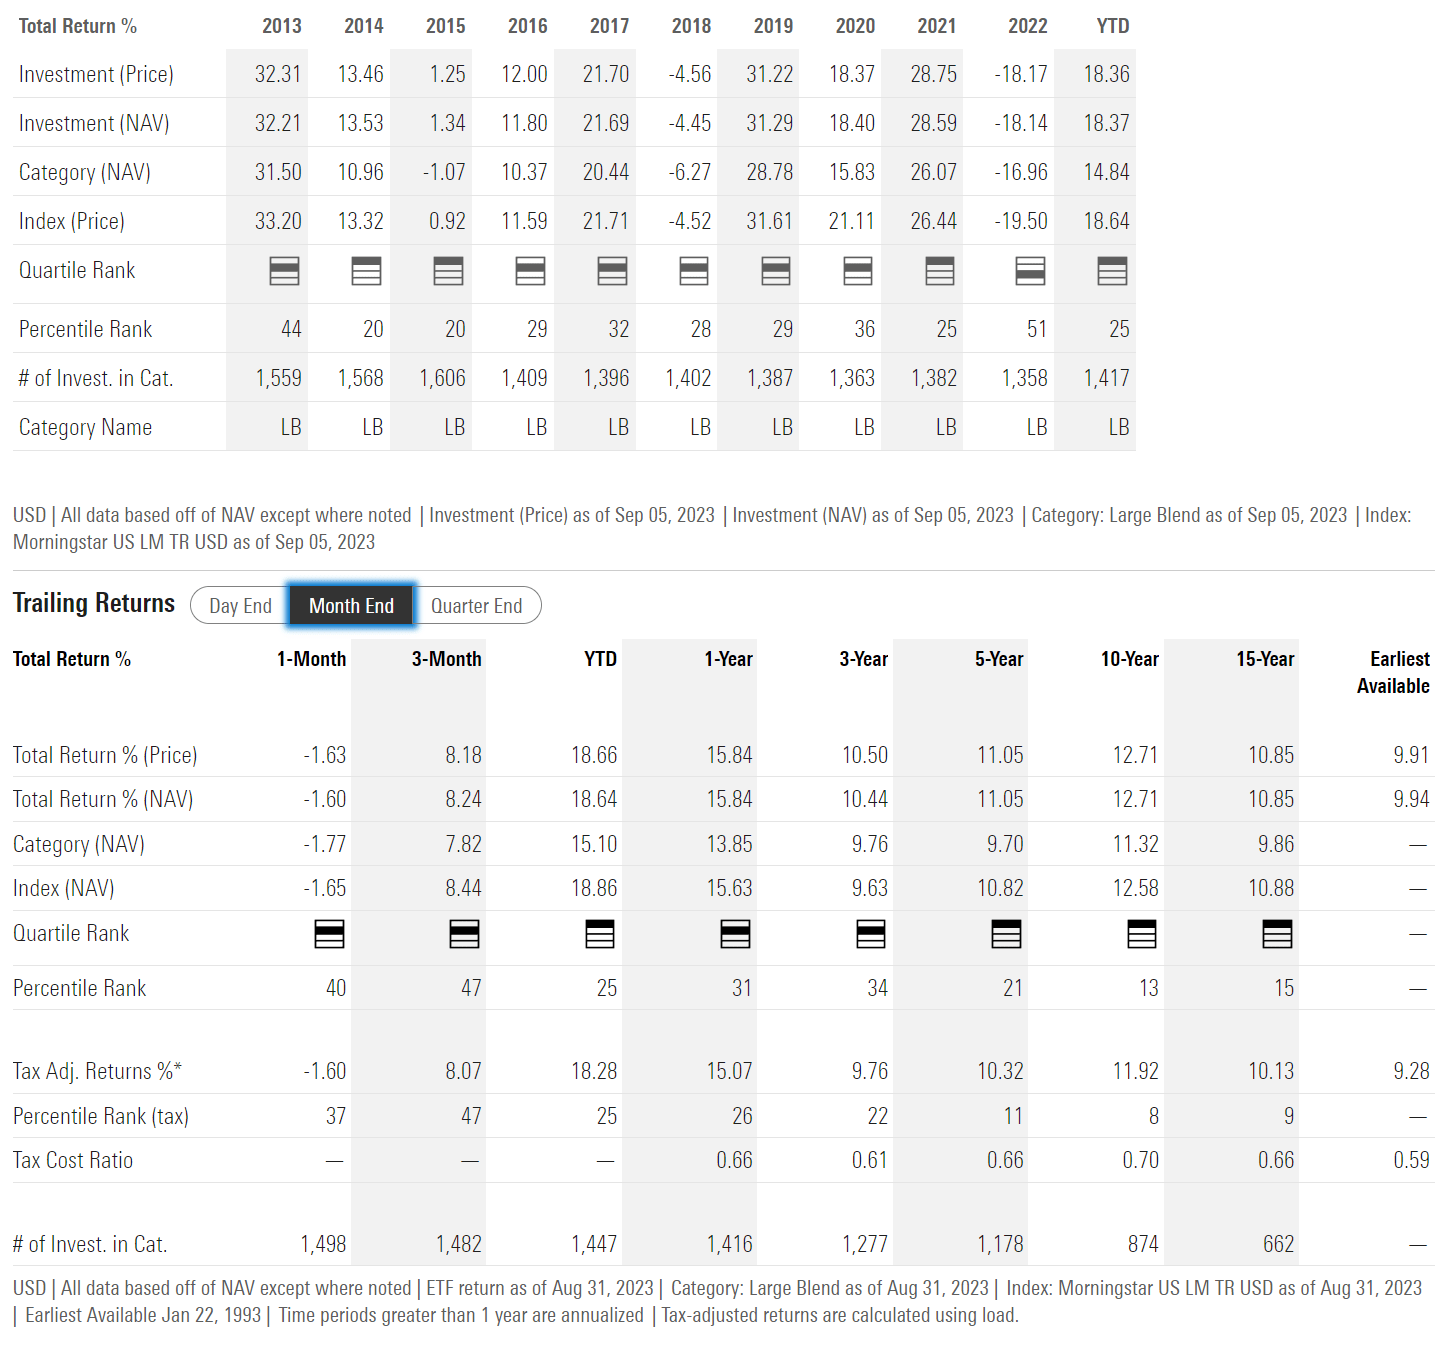
Although additional historical returns are available for the fund, I am hesitant to include them in my analysis as the SPGP ETF has undergone 2 separate index change and renaming in the past few years (Figure 4).

Relative to the S&P 500 Index, as modeled by the SPDR S&P 500 ETF Trust (SPY), the SPGP ETF has outperformed on both 1 and 3 year time frames (Figure 5).
Impressively, the SPGP's index methodology appears to outperform in both bull and bear markets, as the SPGP has delivered above market returns in 2019 (note, new index was implemented in February 2019, so 2019 returns do not reflect a full year of the GARP Index), 2021, and 2022. It underperformed the market slightly in 2020.
Distribution & Yield
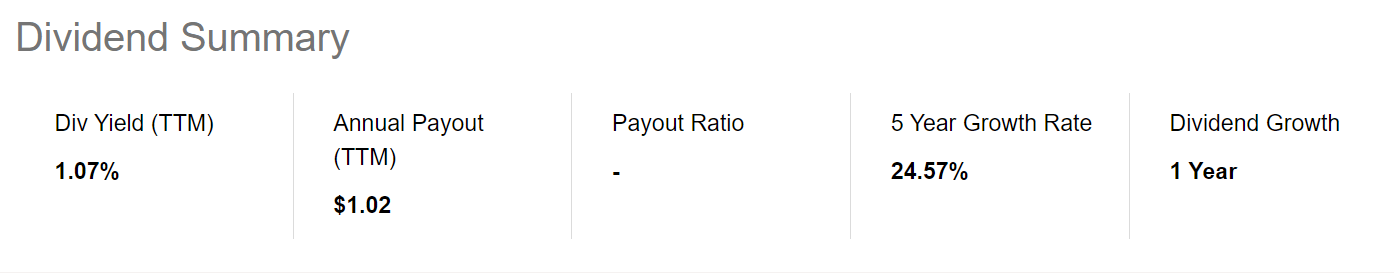
The SPGP pays a quarterly distribution with trailing 12 month distribution of $1.02 / share a 1.1% yield (Figure 6). This is slightly lower than the market's 1.5 yield.
SPGP vs. OMFL and MOAT
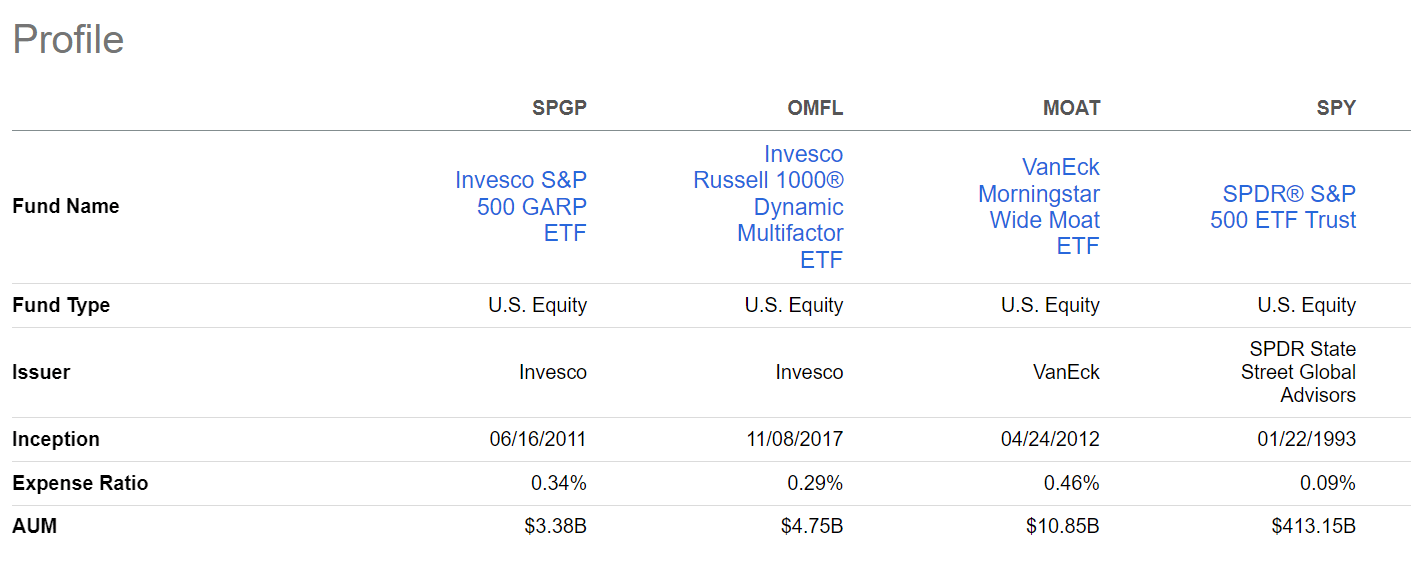
How does the SPGP ETF compare against my core equity holdings, the Invesco Russell 1000 Dynamic Multifactor ETF (OMFL) and the VanEck Morningstar Wide Moat ETF (MOAT)?
In terms of fund structure, the SPGP ETF charges a 0.34% expense ratio, which is in line with OMFL's 0.29% and MOAT's 0.46%. Note, all three funds charge more than the vanilla SPY ETF (Figure 7).
The SPGP ETF is a rules-based passive index fund that selects stock based on GARP characteristics as outlined above. In terms of strategy, SPGP's investment strategy is the most transparent, as it is rules based. In contrast, both OMFL and MOAT have elements of achievement management in their investment process.
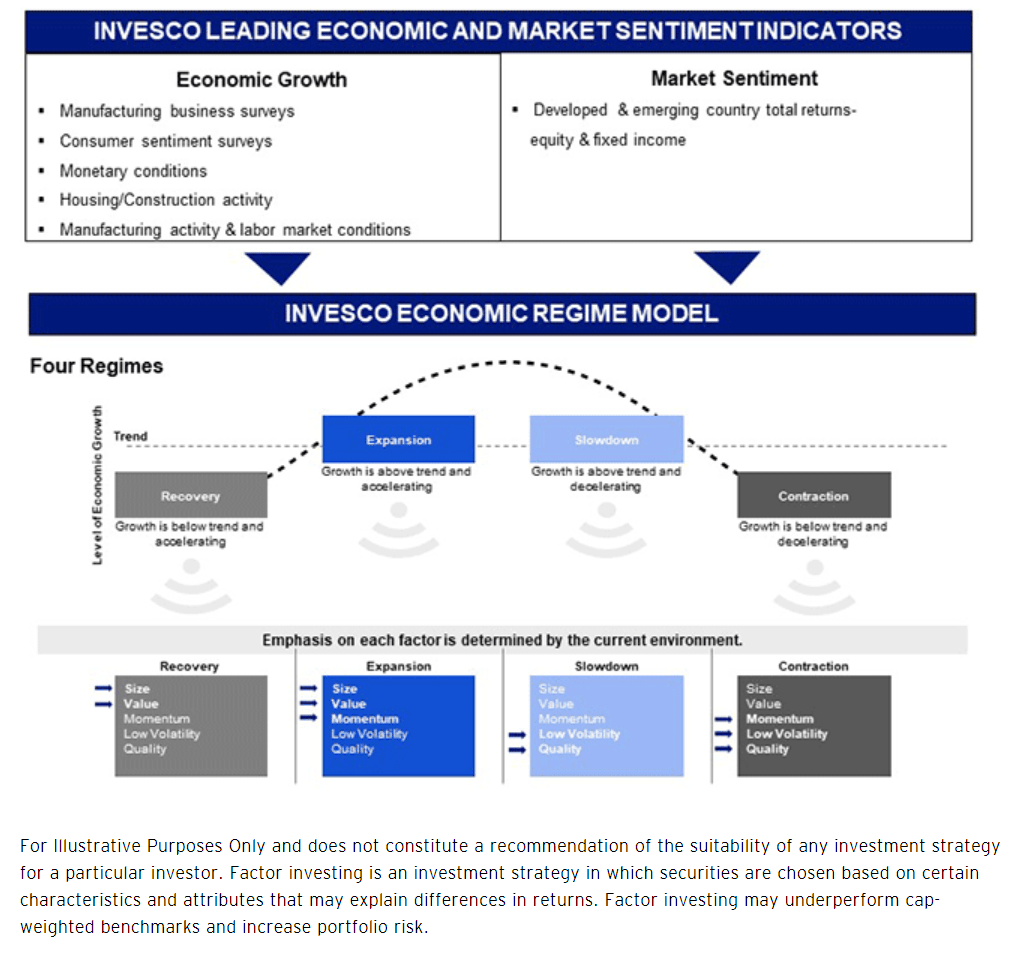
The OMFL ETF is a quantitative factor-based ETF that dynamically adjust its factor weights depending on Invesco's assessment of the current phase of the economic cycle. During Recovery and Expansion phases, the OMFL ETF is more aggressive and overweight factors like Value and Momentum. During Slowdown and Contraction phases, the OMFL ETF is more defensive and overweight Quality and Low Volatility (Figure 8).

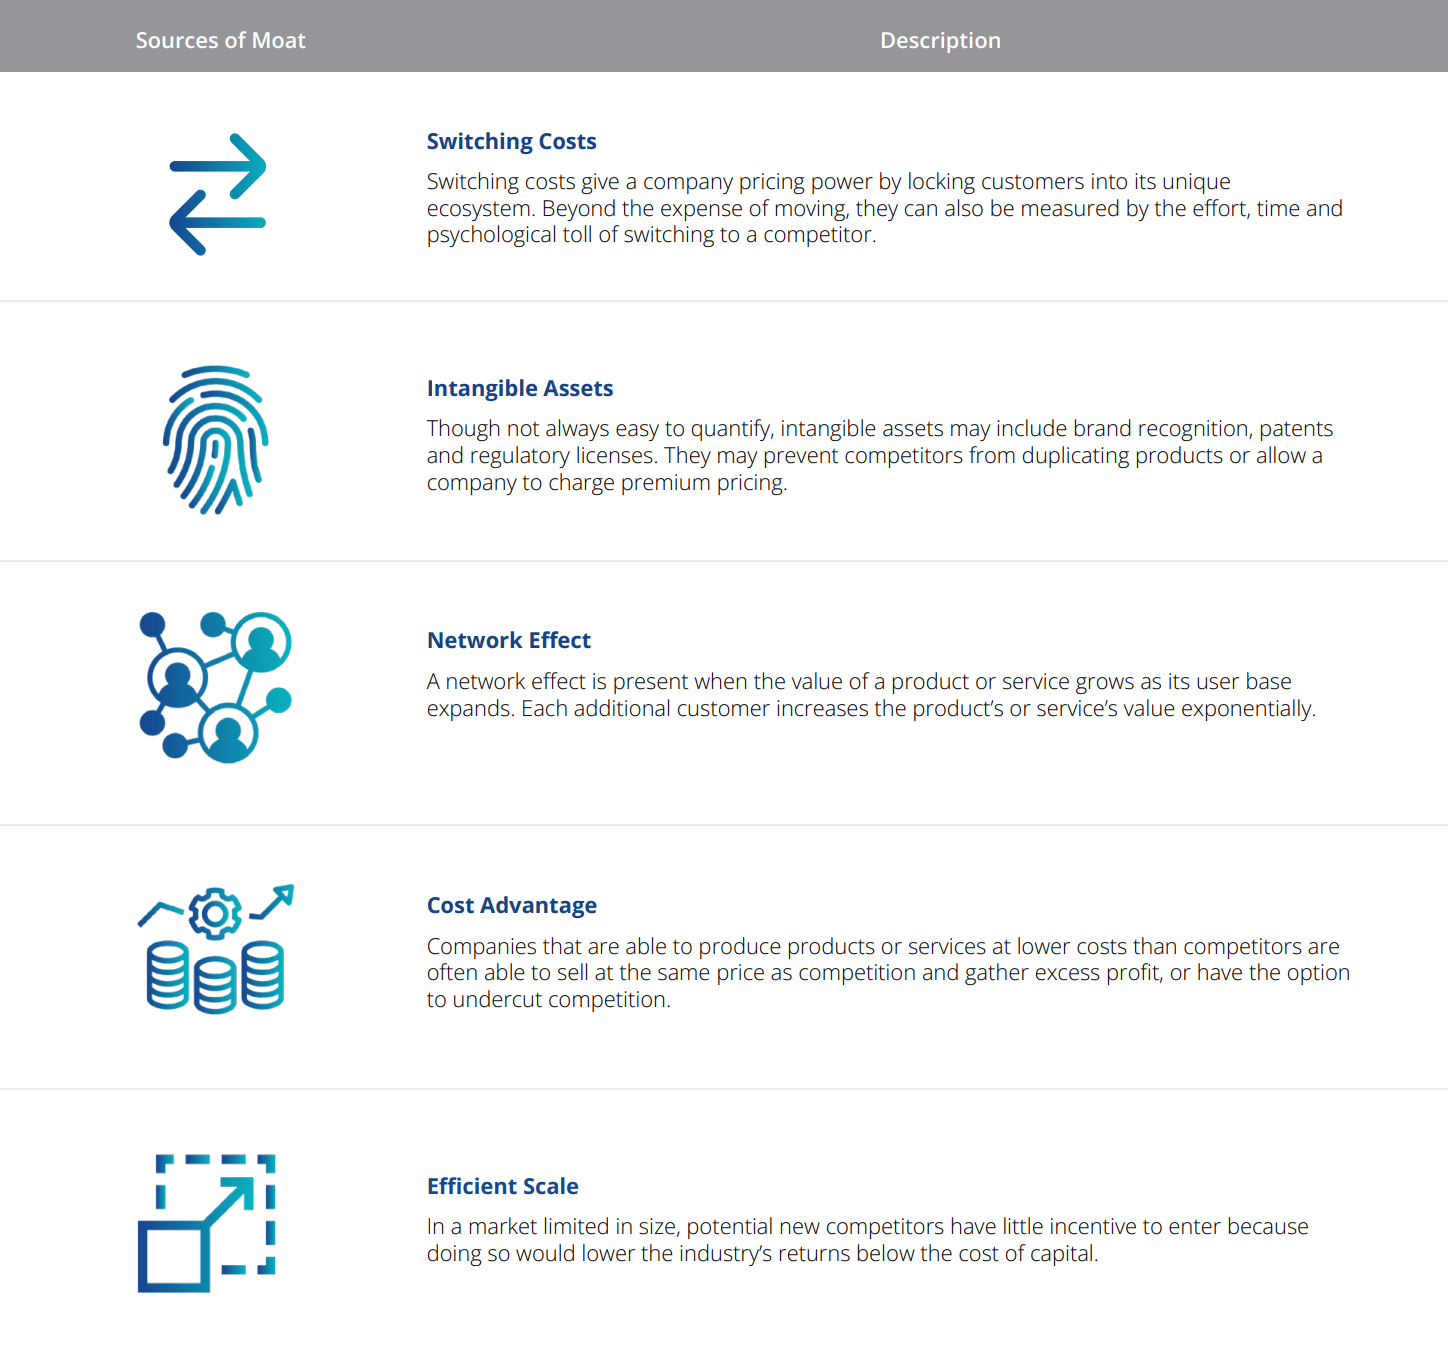
The MOAT ETF's strategy is to buy high quality companies that have wide Economic Moats, as determined by Morningstar's team of over 100 equity analysts (Figure 9). The MOAT ETF also considers the return potential relative to estimated fair value and will reduce and even eliminate holdings it considers expensive.

Comparing the historical returns of the 3 funds since March 2019 (SPGP's index was switched to the GARP Index in February 2019), we can see that all 3 have delivered exceptional returns (Figure 10).
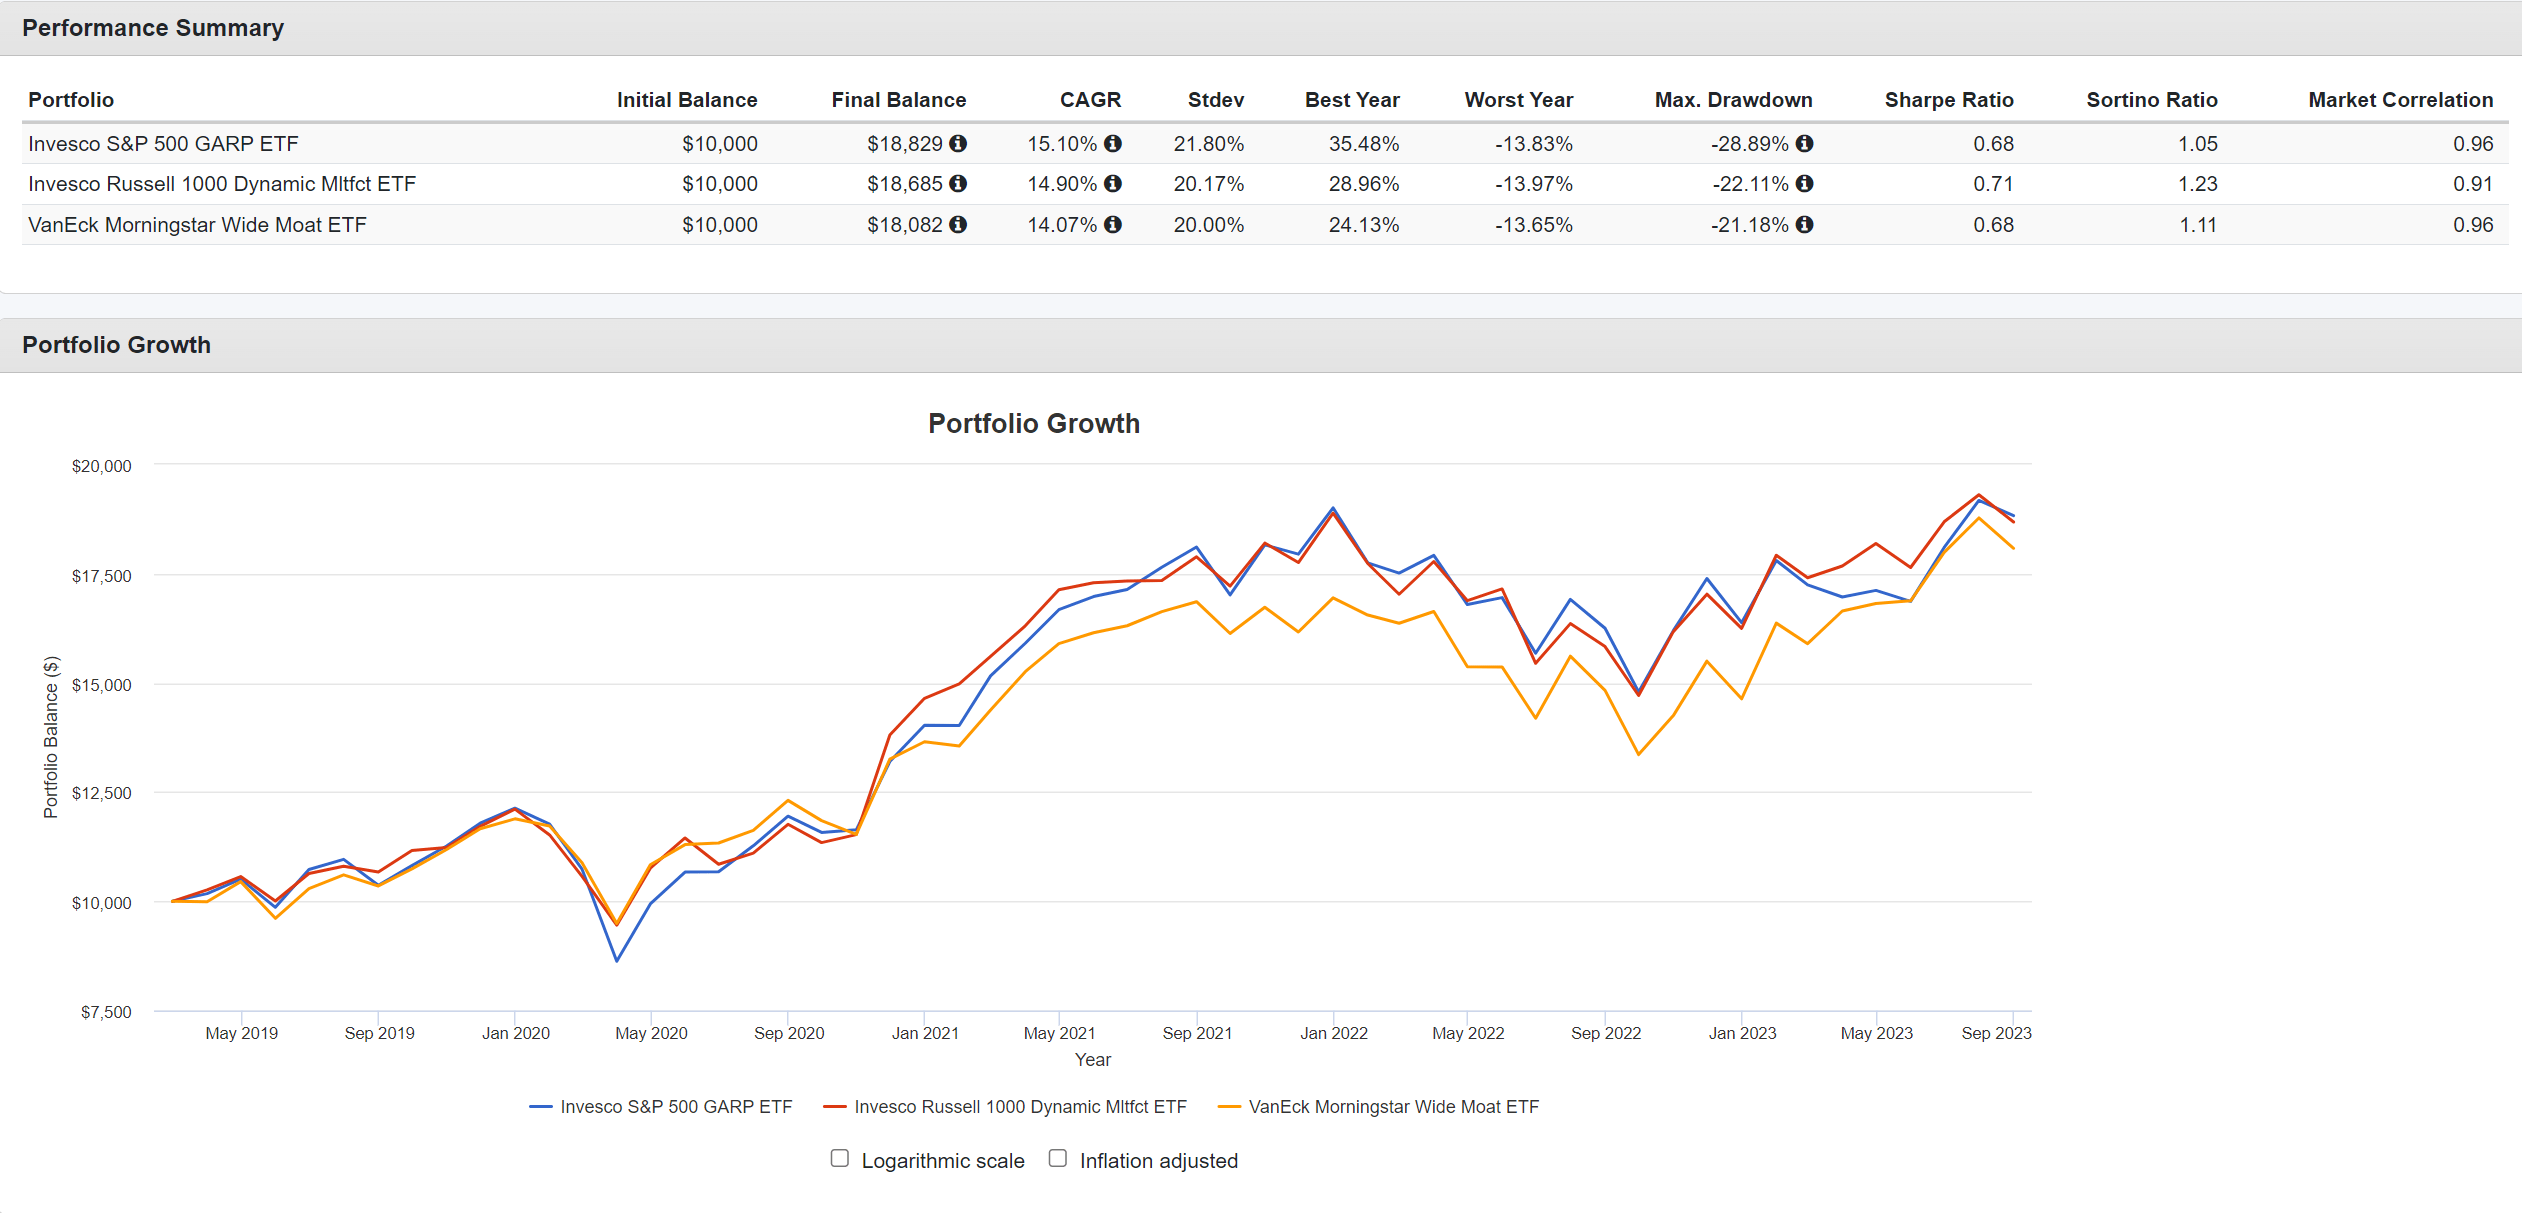
SPGP has delivered the highest CAGR returns of 15.1% compared to 14.9% for OMFL and 14.1% for MOAT. However, SPGP is also the most volatile, with volatility of 21.8% vs. 20.2% for OMFL and 20.0% for MOAT respectively. This leads to SPGP only have a Sharpe ratio of 0.68 vs. 0.71 for OMFL and 0.68 for MOAT.
Overall, all 3 are exceptional funds that could be considered for one's core equity holdings. If one were to find fault with the SPGP ETF, it is the short history of the GARP Index, as there may be time periods when the GARP investment style falls out of favour.
It would be informative to see how the GARP Index has performed in different historic economic scenarios to determine the range of possible outcomes. However, the SPGP ETF has delivered so far in terms of returns, so it is hard to argue with the process.
I sincerely thank my reader for bringing this exceptional ETF to my attention.
Conclusion
The Invesco S&P 500 GARP ETF gives investors convenient access to the ‘GARP' investment style popularized by the famous investment guru, Peter Lynch. The SPGP ETF has delivered exceptional returns in its short operating history and may be suitable as a core holding in investors' portfolios. I rate the SPGP ETF a buy.