

The iShares 20+ Year Treasury Bond ETF has fallen -50% from its highs, and I believe it will fall a further -10% below its inception price at the minimum.TLT fund flows show persistently growing inflows into the ETF in the face of sharply falling prices. Investors are complacent that TLT has bottomed out, and that faith looks misplaced.Bond yields and the USD are on very resilient uptrends, showing no signs of topping out yet. We are likely to see capitulation in TLT before the ETF bottoms out.
Investors have been complacent that rates have topped out. I believe this is not the case, and for rates to top out, we need to see capitulation and “selling at any cost” in bondholders, which has not occurred yet.
Just look at the chart below, which shows persistently growing inflows into the iShares 20+ Year Treasury Bond ETF (NASDAQ:TLT), despite its share price being in a steep downtrend.

This means that TLT investors are buying aggressively on dips, confident that the downtrend will reverse into an uptrend soon. We all know how that ends, right?
On the long term monthly chart, TLT looks like a falling knife, trading below all key moving averages and trading close to its inception price. It may look like a great bargain buy, but from a technical analysis perspective, this is not the right time to buy in. TLT is on an extremely steep downtrend, and has shown no signs of basing out or consolidation higher. Odds of a sharp V-shape recovery are slim.
Monthly Chart: TLT
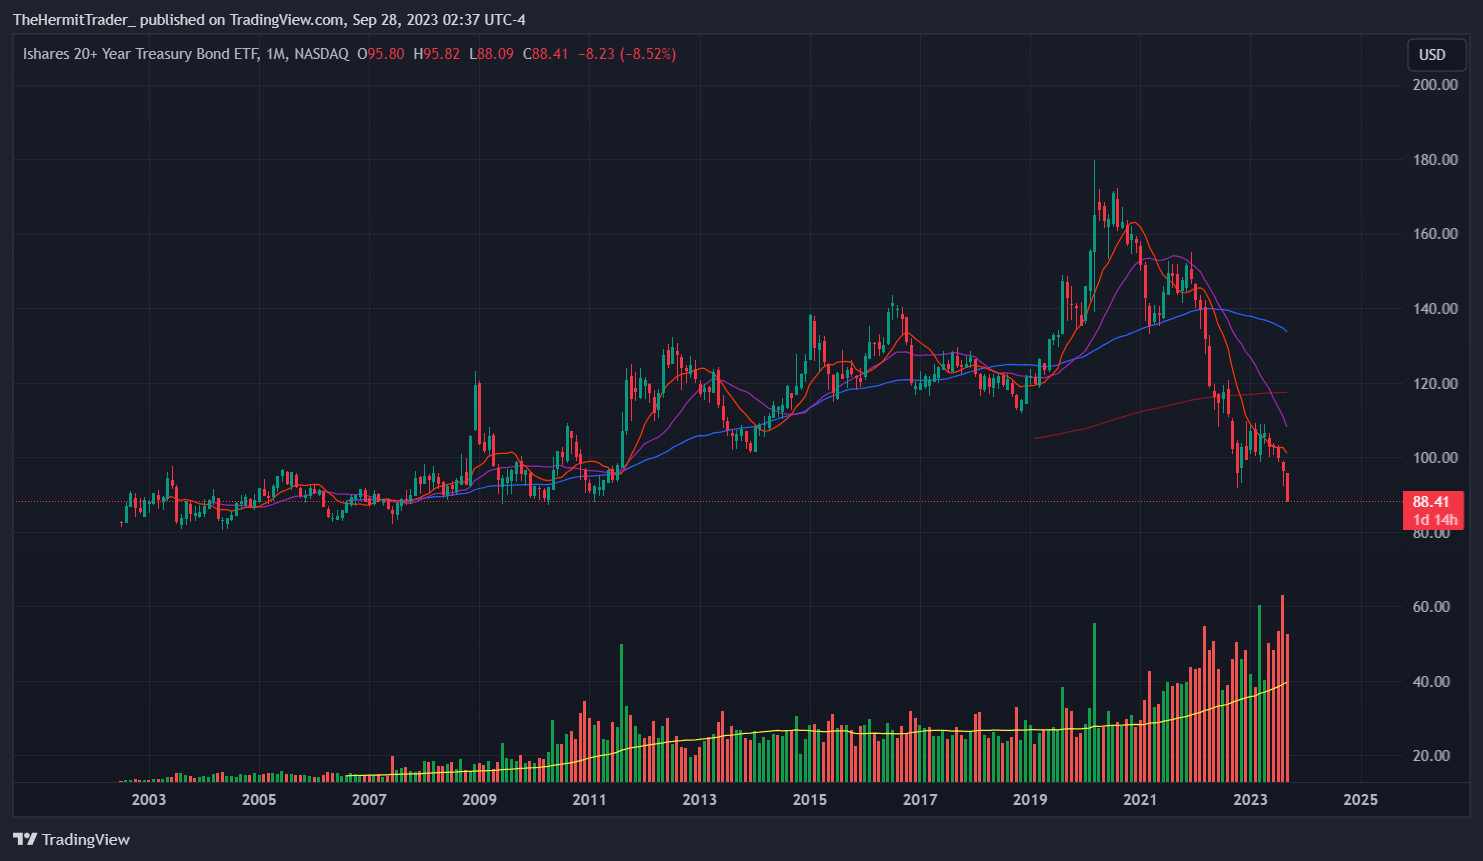
I get that the dividend yield of TLT is 3.8%, and coupled with its perceived safe status as a government bond, will likely lull investors into a false sense of security. TLT is down -50% from the highs, but trends can be more powerful and last longer than what we think. I believe TLT will make fresh all-time lows below $80.51, which will likely induce a bout of panic-selling.
For bonds to recover, yields need to, at the very least, show signs of slowing their ascent. The US10Y yield shows the exact opposite, breaking out of a recent multi-month base and trending higher very resiliently.
Weekly Chart: US10Y Yield

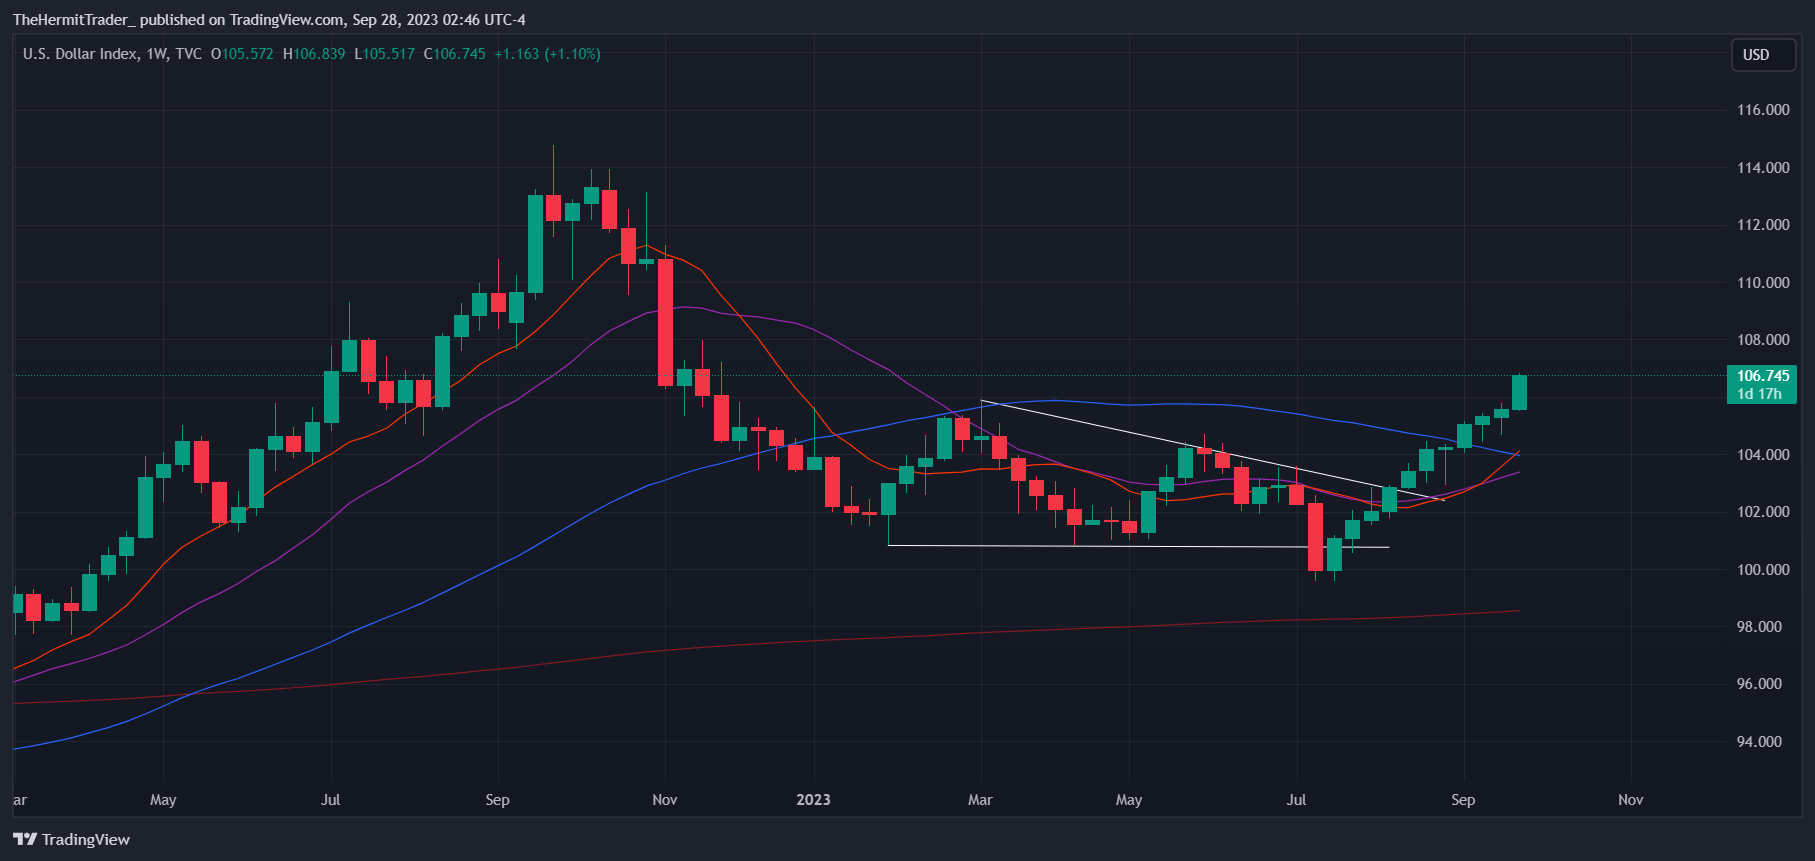
Another tell is the USD, which tends to rise alongside bond yields. The USD continues to plough higher, and its uptrend on the weekly chart shows no sign of slowing down.
Weekly Chart: Dollar Index
I previously wrote in late August that high yield bonds were outperforming Treasuries, and that remains the case. The ratio of the iBoxx High Yield Corporate Bond ETF (HYG) against the TLT has broken out of a multi-year base, which I wrote was very likely to occur back in August.
Monthly Chart: HYG/TLT
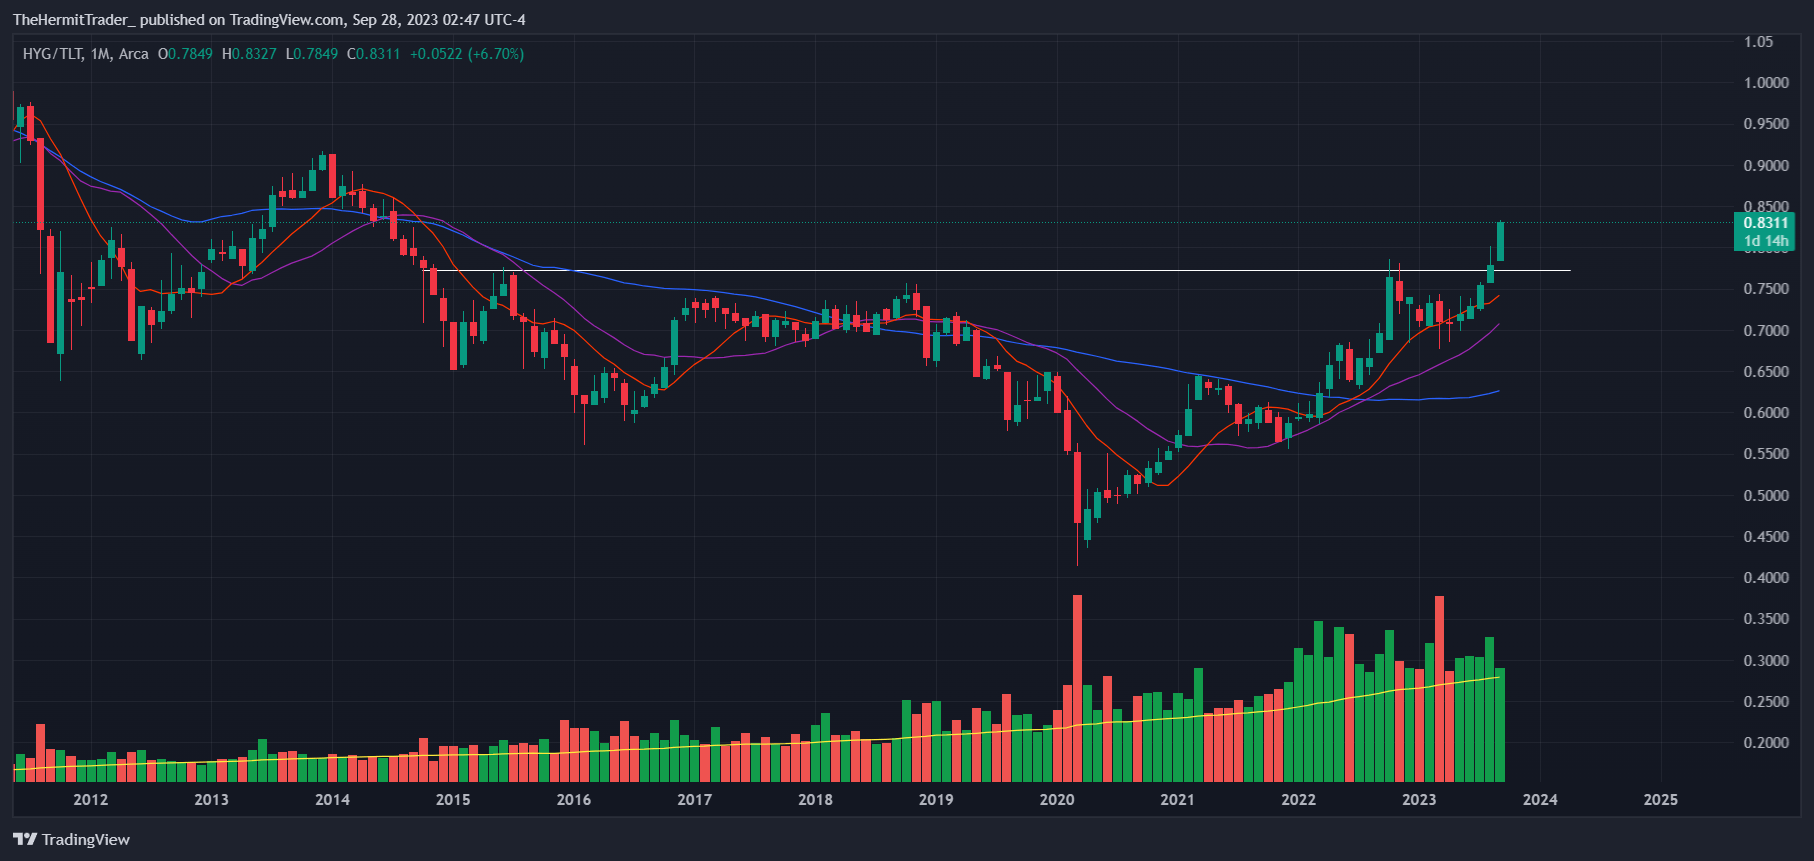
I stand by my opinion that a major credit event is not likely, as the ratio of HYG/TLT is showing that credit spreads are widening. This takes away another catalyst for Treasury bonds to rally.
All in all, TLT is plunging sharply along with high volume. Typically, this is a sign of capitulation.
However, upon delving deeper, we can see that the high volume is due to inflows into the ETF rather than outflows. This suggests that TLT investors are complacent that we have reached a top in yields or a bottom in Treasuries.
Unfortunately, the majority is unlikely to be right at the same time, and we typically need some kind of capitulation selling for Treasury bonds to bottom out. We need to see sharply falling prices alongside high outflows from TLT.
Looking at the key two tells – the US10Y yield and the USD, both are on resilient uptrends, which suggests more pain for TLT.