


Scott Olson/Getty Images News
For most of the year, we've held the view that the market would rally back to a double top at 4,800 on the S&P500, from which it would suffer another major decline. We accelerated that view in October (The Warren Buffett Bear Market) thinking the July peak at 4,600 was the top. However, the strength of the November move now makes 4,600, or even 4,800, highly unlikely as ending points. It now appears the stock market is going to break above 4,800 and not form a double top. Important indicators based on market sentiment support this view.
How to use Market Sentiment
Most people apply the theory of Contrary Opinion or Market Sentiment incorrectly. They think contrary opinion means that prices will move opposite what the majority expect. But this is wrong.
It's only when investor expectations reach extreme levels – when “too many” investors expect higher or lower prices – that markets run into trouble. The secret is knowing when you have “too many.”
Experience has taught us that prices will continue up (or down) until you have “too many” people expecting more of the same, and current metrics don't indicate this. So, prices should continue to advance until they do.
Let us show you the current state of market sentiment.
The Master Sentiment Indicator
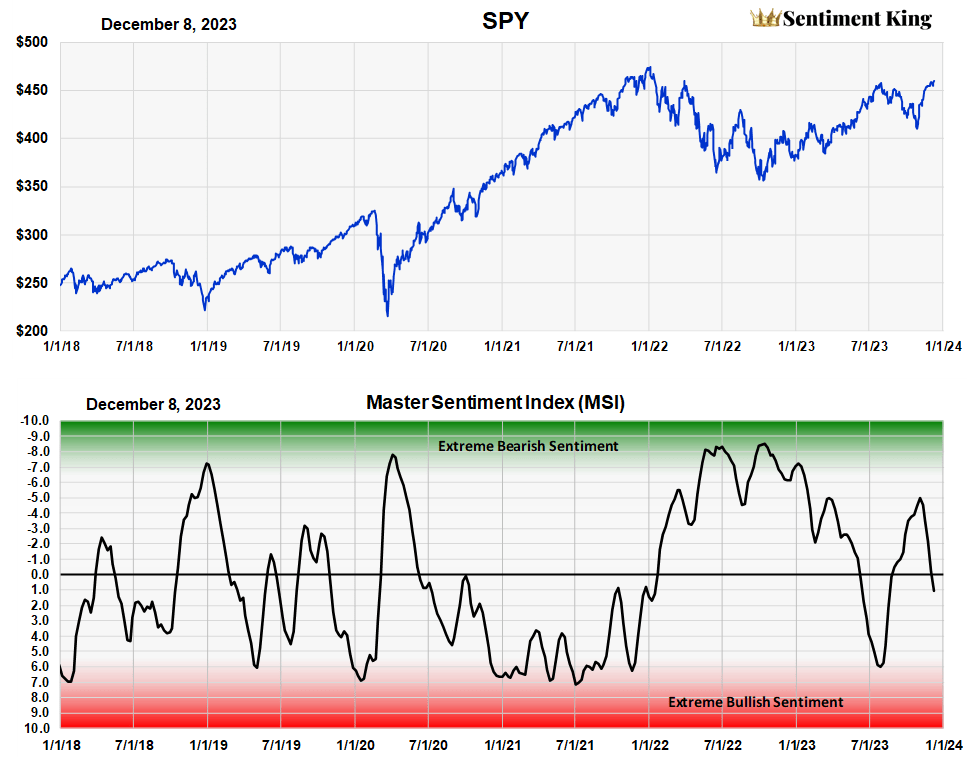

The MSI (Master Sentiment Indicator) is composed of nine classic sentiment indicators fused together using our SK ranking system (the SK ranking system is explained at the end). These are the indicators that make up the MSI and we mathematically adjust each to reflect a long-term market view: 5% CBOE Total Puts and Calls Ratio, 5% CBOE Equity Puts to Calls Ratio, The CME Commitment of Traders data on the S&P futures, Buying in the ProShares S&P 500 Inverse Fund (SH), NAAIM Exposure Index (National Association of Active Managers), Hulbert Rating Service (Stocks), Hulbert Rating Service (Nasdaq), The AAII Sentiment Survey,. The red-green chart below shows the multiple extreme readings of the MSI this year and over the last 15 years. The correlation with major market lows is phenomenal and we believe it better than any economic or financial metric in this regard. (The Sentiment King)
After applying the theory of contrary opinion for 50 years, experience has taught us you don't have to worry about a major market decline until you first have reached an extreme sentiment reading. Using the MSI, extreme bullish sentiment is a red zone reading. As you can see, we don't have that yet, so we fully expect prices will continue their upward trend until we do.
It's going to take a number of weeks, and higher prices before the sentiment indicators reach that, so that means a probable price breakout above 4,800 to new highs
We have a second Master Sentiment Indicator, called the ST-MSI, that confirms this view. It's a composite made of seven indicators that measure shorter-term investor expectations. While it’s closer, it too is short of the red zone.
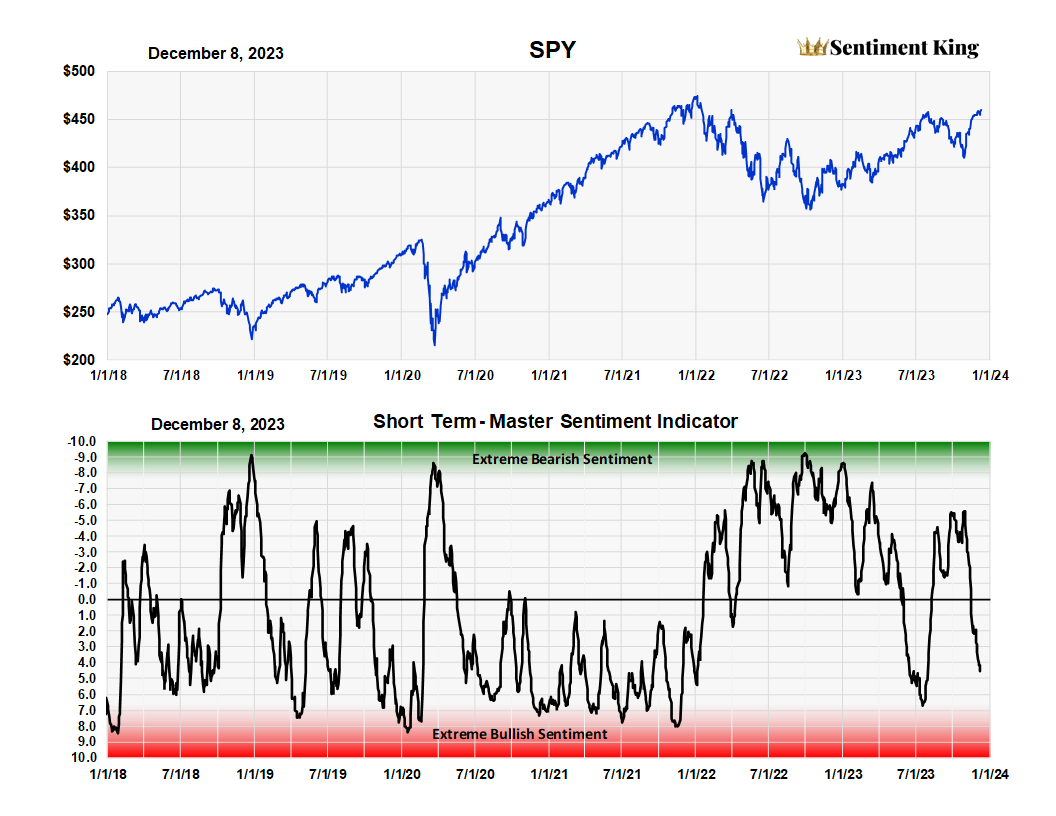

The ST-MSI (Short Term Master Sentiment Indicator) is composed of seven sentiment indicators that are calculated daily. We adjust the data of each to reflect a shorter-term view of the market. They’re combined into one indicator using our SK ranking system. The components that make up the ST-MSI are: Hulbert Rating Service (Stocks), Hulbert Rating Service (Nasdaq), VIX, 20% Equity P/C, 20% Total P/C, ProShare Bull/Bear Purchase Ratio, ProShare UltraPro Bull/Bear Purchase Ratio,. The chart of the ST-MSI also shows the extreme readings reached this year and over the last seven years. Being a short-term sentiment indicator, it measures quick changes in investor outlook for the market. (The Sentiment King)
Summary Tables of Sentiment Indicators
These tables rank the sentiment indicators that make up the two master sentiment indicators. We've broken them down into two categories; those that depend on what investors are buying and selling and those based on surveys of investor opinion about the direction of the market.
The first table shows the buying and selling indicators.
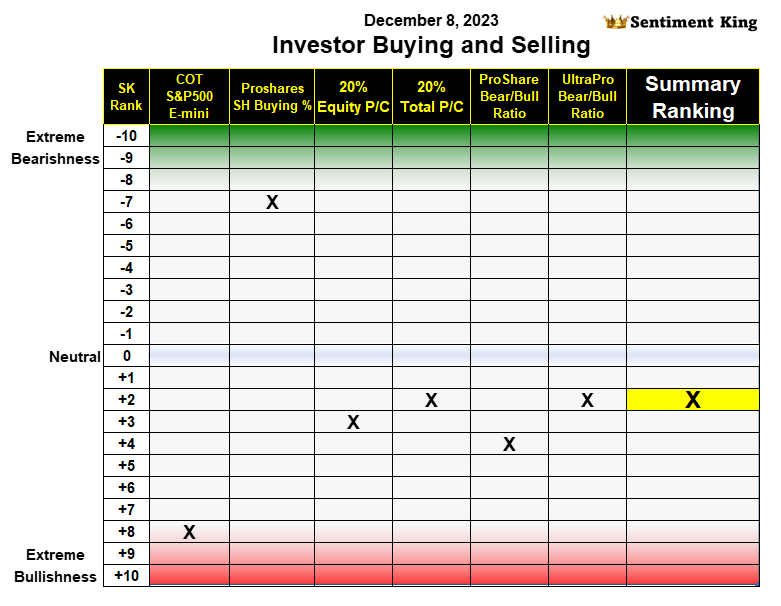

This Table ranks each of the sentiment indicators on the Red-Green Sentiment King ranking scale (The Sentiment King)
Except for the money manager shorting of S&P futures, most of the indicators are near the center or neutral area and far from red zone readings. This consistency in the ranking of the various sentiment indicators is added confirmation to us that bullish sentiment is nowhere near worrisome levels.
We see similar results in the table that shows indicators based on investor surveys. Again, what's important to us is the consistency of the readings. All the indicators are on the red side of neutral, but they’re all a long way from a red zone reading.
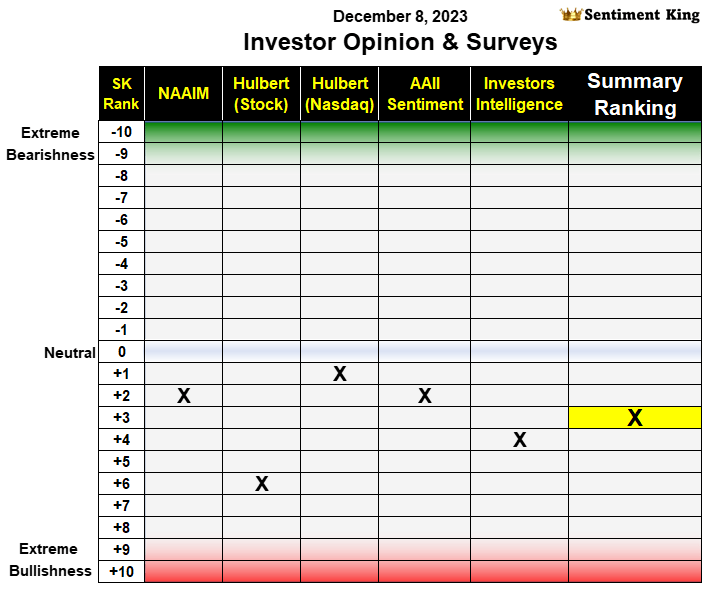

This Table ranks on the Sentiment King Red-Green ranking scale the major investor and newsletter writer opinions on the direction of the stock market (The Sentiment King)
The Importance of Investor Expectations or Market Sentiment
You would think that economic factors would be the best indicators of stock market direction, but they're not; market sentiment is. It takes time to mentally adjust to this.
You have to become bullish when the economic outlook is gloomy and there's every economic reason not to be. Likewise, you have to become cautious when the economic outlook is at its best and everyone is positive. This puts you in awkward positions, since you always look a little irrational and crazy at market turning points. At these moments, don't expect people to agree with you, and become a little worried if they do.
You only have to go back to last year to see the truth of this. The fact that the vast majority of investors were bearish last year was a better predictor of higher stock prices than all the economic reasons they gave on why stocks would go down. You should reread the many critical comments last year to my twenty-plus bullish articles. Commenters explained why my extremely bullish stance on the market was obviously crazy, since a major recession was just around the corner. Last year was a wonderful example of contrary opinion in action.
Right now, the neutral level of sentiment tells us that prices will continue higher, at least until we get more extreme bullish feelings about this market.
We'll continue to monitor this and update investor sentiment every two or three weeks, as we've been doing for the last year.