


The QYLD is an ideal ETF for investors who want exposure to tech stocks while willing to forego capital gains in exchange for substantial income from call option sales. Since the December 2021 NDX peak, the QYLD has generated 15% of additional income from call sale premiums, which has allowed the QYLD to outperform the NDX by over 20%.While the QYLD has underperformed the NDX since its inception in 2013, this reflects the extremely strong performance of US tech stocks, which is unlikely to be repeated going forward.
QYLD ETF: Sell The NDX And Buy This Income Machine (NASDAQ:QYLD)
The Nasdaq 100 Covered Call ETF (NASDAQ:QYLD) is a far superior alternative to the NDX in this current climate, with income received from the fund's option sales set to allow the ETF to continue outperforming the NDX. The QYLD is ideal for investors who want exposure to tech stocks while willing to forego capital gains in exchange for substantial income. The QYLD is much less volatile than the NDX and tends to outperform when the NDX declines. I noted in a recent article that there is still more downside to come for the NDX (see ‘NDX: Free Cash Flows Are Crashing‘), and I believe that investors should switch to the QYLD to allow income returns to offset any further weakness. The fund charges an expense fee of 0.6% which is substantial but likely to work out far cheaper than executing this strategy directly by selling calls directly.
The QYLD ETF
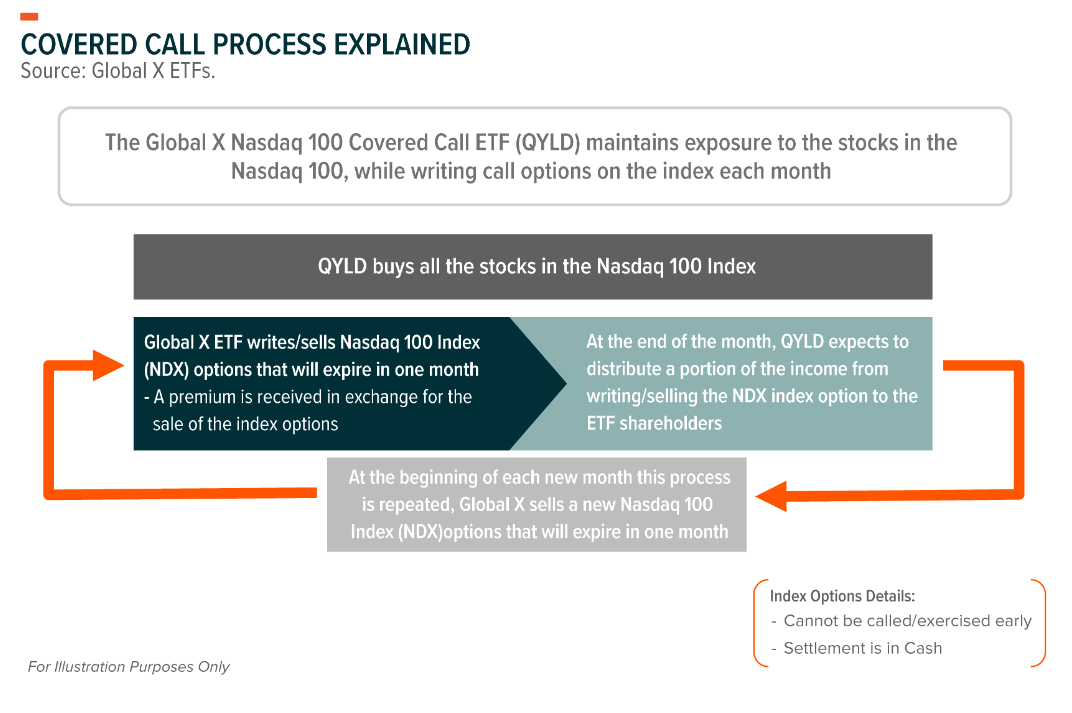
The QYLD ETF achieves its investment objective by owning the stocks that make up the Nasdaq 100 Index and selling covered call options on the index. The QYLD writes one-month at-the-money (“ATM”) call options that are rolled monthly. The covered calls encompass 100% of the notional value of QYLD's portfolio. The diagram below, originally posted in a November article by Macrotips Trading illustrates the fund's strategy.
While the QYLD is down in price terms by around 30% since the December 2021 NDX peak, largely reflecting the weakness in the performance of its underlying stocks, the fund has generated 15% of additional income from call sale premiums. This has allowed the QYLD to outperform the NDX by over 20% over this period.
Implied volatility has been slightly elevated over the past year, which has helped generate these high-income returns, and we should expect to see slightly lower income over the coming months as implied volatility has declined. However, since its inception in 2013 the QYLD has generated 11% annual returns from call sales, and this is likely to continue going forward.
NDX Long-Term Outperformance Is A Thing Of The Past
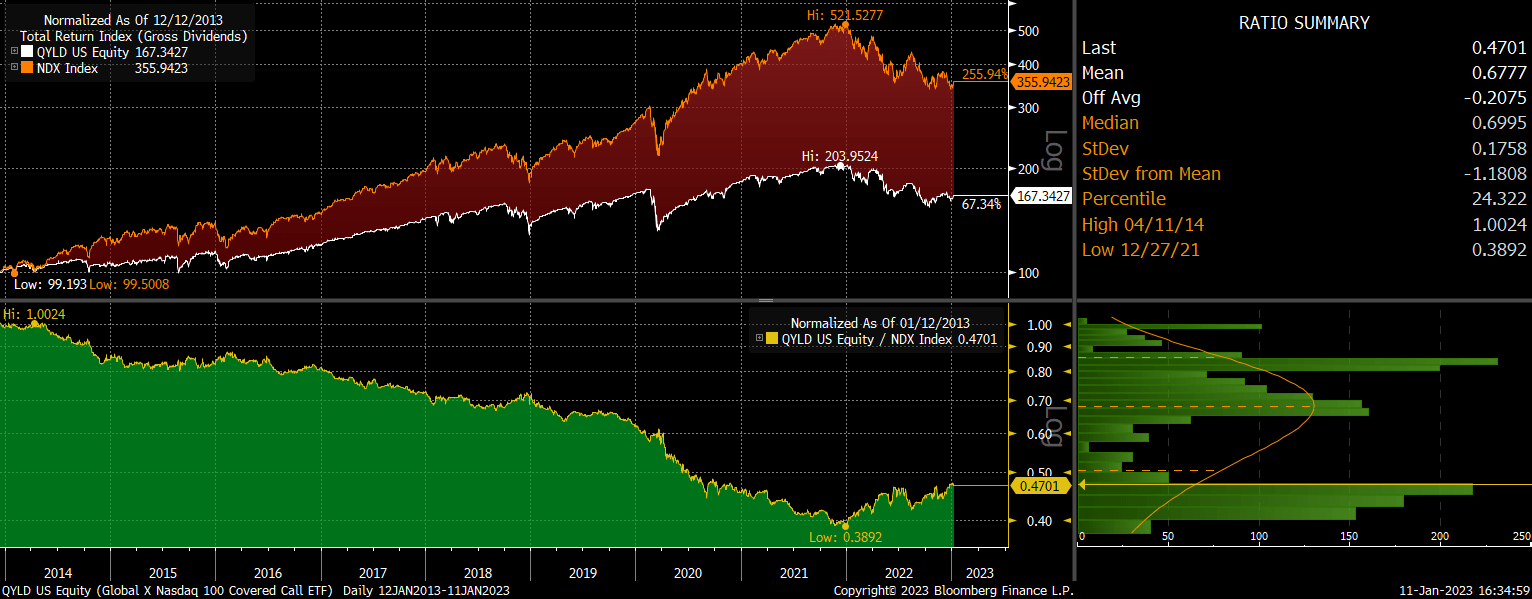
If we take the performance of the QYLD versus the NDX since the QYLD's inception in 2013, the NDX has been a clear winner, rising by an annualized 15% versus the QYLD's 6%. However, this reflects the extremely strong performance of US tech stocks, which is highly unlikely to be repeated going forward. NDX earnings have almost tripled over the past 10 years, fueled by collapsing US savings rates and a growing market share in many companies that are now market leaders. These two forces suggest that growth will be significantly slower over the coming years, much more closely in line with nominal GDP. With 10-year breakeven inflation expectations at just 2.2% and structural real GDP growth declining, this is likely to be no higher than 3% annually. This strongly suggests that income returns in the QYLD will outperform any capital gains on the NDX even if valuations remain at current levels. If we see a continued decline in NDX valuations from their still-elevated levels, the QYLD is likely to outperform dramatically.
Will The QYLD Generate Positive Returns?
The case for the QYLD outperforming the NDX over the coming years is clear, but whether the ETF will actually generate positive returns is another story. For this to happen, we would need to see the NDX itself avoid any significant decline. Broadly speaking, if the QYLD can manage to generate 11% a year in option sales, this implies that the ETF will post positive returns if the NDX avoids an 11% decline. Over a period of several years positive returns are highly likely, but with the NDX still strenuously overvalued, investors may well experience losses over the coming months and years. The good news is that NDX decline resumes, we should see implied volatility rise, which should mean higher income for the QYLD.
Summary
After generating 15% in option premiums over the past 12 months, the QYLD has dramatically outperformed the NDX, marking a major reversal in performance relative to the past 10 years. With implied volatility still elevated, strong income returns are set to continue, which should be significantly higher than the growth rate of NDX earnings. In absolute terms, still-elevated NDX valuations suggest we have not seen the end of tech sector weakness, and the QYLD is at risk of further downside over the coming months. However, any weakness is likely to cause implied volatility to rise, allowing option income to increase and generate positive long-term returns.