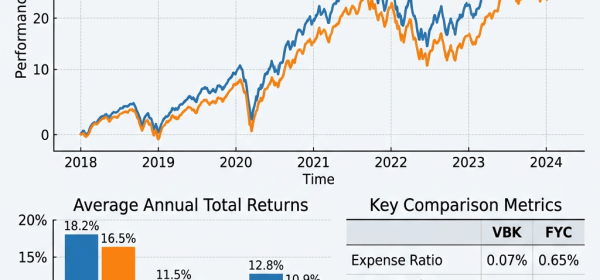
Lacy Hunt, economist at Hoisington Investment Management Company, says the real risk that investors should be on the watch for is that of a recession later this year and even a potential liquidity crisis in the

Lacy Hunt, economist at Hoisington Investment Management Company, says the real risk that investors should be on the watch for is that of a recession later this year and even a potential liquidity crisis in the
According to Airlines for America (A4A), U.S. carriers are investing a record amount in new aircraft, equipment, information technology and more. Record-High Premiums On American Eagle Silver Coins
One thing I’ve learned about markets in 37 years of navigating them is this: human behavior doesn’t change much over time when it comes to the stock market. Thus, when I see evidence lining up to support the case that risk is extremely high for S&P 500 investors, I choose not to keep it to myself.
This is not a gloom-doom article. I am not telling you that a market crash is about to happen. That’s because no one knows what the market will do in the future. Some investors take that to imply that they should just ignore any type of market fluctuations, and predictions, in the name of being a “long-term investor. That may feel good. After all, risk is not loss of capital. It is just the possibility of losing capital.
Grin and bear it…really
I have cashed in on plenty of bear markets in the past. I’ve also lagged many bull markets significantly. But it has all been in the name of avoiding big loss, as I believe that is the most important factor in long-term returns. After all, this century we have already experienced a 13-year period in which the S&P 500 made essentially zero. That was the case in large part due to a pair of roughly 50% declines which forced many to be “long-term investors,” just to get back what they had lost in a matter of 18-36 months.
Back in 1987, I was in my first year in the investment business, and I remember October 19th like it was yesterday. That was the infamous “Black Monday,” when the stock market fell about 22% in a single day. It was not a fluke. It was the result of a series of events and circumstances that built up over years. Unfortunately for bullish investors today, some of those same types of risks are rearing their ugly heads. Ugly, that is, unless you have a method of exploiting such events. In this article, I will briefly review the similarities I see, show some striking chart comparisons between 1987 and now, and direct investors to some recent ETFs I’ve profiled which might be useful to consider if that high risk is realized.
Weird, rare events in the bond market
Let’s start with this quote by one of my favorite market commentators, the straight-shooting Jim Bianco of Bianco Research. He tweeted this on Monday:
The 2-year yield is down 85 bps in the last 3 trading days (from Wed, Mar 8 close, the day Powell finished testimony). In the last 40 years only 1 time has the 2-year declined this much over 3 days, the 1987 stock market crash.
Why did rates decline so much? Was it because the market is now ecstatic that the Fed might lower interest rates? I think it is more likely a panic move into the assumed safest asset in the public markets, one which offers a much higher return to be an investment “chicken” for a while. I’m proud to say my own portfolio is about 75% in Treasuries and Treasury Bill ETFs. That leaves plenty of cash to deploy put options on various segments of the equity market, as well as some single inverse ETF positions and even a small dose of long positions via out of the money call options. Because as I see it, when capital preservation is the first objective, you don’t mess around. I’ve railed against the risk in corporate bonds, and if the only thing preventing that risk is Fed and US Treasury Department intervention like we’ve seen recently, that tells me the risk is real. That also implies that what some market bears feared is becoming a reality: the Fed could pause or lower rates because they’re trying to prevent a financial crisis. You know, the type many thought wasn’t possible just 2 weeks ago.
1987 vs. today: mirage? No. Destiny? Not necessarily.
Here is the S&P 500 chart today. What I see is that price has plunged through multiple moving averages. As I’ve noted in other recent strategy articles, I am not as much of a moving average wonk as many technicians. But when everything from the 20-day to the 200-day is broken in a flash, I notice.
SPX now
SPX now (Barchart.com)
Now let’s look at a similar chart. This is also the S&P 500. However, it is not from March 2023. It is from October 1987. While not shown here (but they are on the next chart of the same period), the moving averages were pierced, and the Percentage Price Oscillator (lower section of the chart) dove from positive to negative territory, indicating a trend shift. That is a tell-tale sign that risk is enhanced. In bull markets, it is often a passing phase. In bear markets, it is a more serious consideration. In markets characterized by the second biggest bank failure in US history, as is the case today, this is just what law enforcement might call “corroborating evidence.”
SPX 1987 pre-crash
SPX 1987 pre-crash (Barchart.com)
So, what happened in 1987, after that risky-looking setup, with 2-year Treasury note yields plunging, and with a financial liquidity crisis brewing? This happened.
SPX 1987 crash
SPX 1987 crash (Barchart.com)
That’s the 1987 crash. And, while that was essentially the end of a very brief bear market (as we had in 2020), the psychological damage lasted for years. As I recall, it was difficult to get investors to buy CDs for a few years after that. Confidence in the stock market evaporated. And frankly, I have long thought that this type of emotional event is what may finally be needed to clear the market of the 15 years of ever-increasing speculative activity we have seen, thanks in large part to easy money policies around the globe.
1987 vs. today: similarities, or overzealous comparisons?
I looked up this account of the 1987 crash from Wikipedia, and the liquidity and margin call issues that transitioned the market climate from a pullback to a structural financial mismatch. Sellers overwhelmed buyers, in part because the buyers could not buy. They were so in over their head with margin debt, the selling pressure overwhelmed them.
The source of these liquidity problems was a general increase in margin calls; after the market’s plunge, these were about 10 times their average size and three times greater than the highest previous morning variation call.[26] Several firms had insufficient cash in customers’ accounts (that is, they were “undersegregated”). Firms drawing funds from their own capital to meet the shortfall sometimes became undercapitalized; 11 firms received margin calls from a single customer that exceeded that firm’s adjusted net capital, sometimes by as much as two-to-one.[23] Investors needed to repay end-of-day margin calls made on October 19 before the opening of the market on October 20. Clearinghouse member firms called on lending institutions to extend credit to cover these sudden and unexpected charges, but the brokerages requesting additional credit began to exceed their credit limit. Banks were also worried about increasing their involvement and exposure to a chaotic market.[27] The size and urgency of the demands for credit placed upon banks was unprecedented.[28] In general, counterparty risk increased as the creditworthiness of counterparties and the value of collateral posted became highly uncertain.[29]
Set aside opinions about recession, inflation, and whether SVB Financial Group (SIVB) is an isolated incident. What always turns stock market declines into major selloffs is usually the same thing: levered market participants get caught being overextended. Or, as Warren Buffett says, when the tide goes out, you can see who was swimming naked. And counterparty risk and the other structural issues above are similar enough for me to want to write about it now, rather than wish I had later. This is what I did in 2020, and perhaps it helped some investors. My hope is the same this time around: to alert and let any investor reading my assessment determine for themselves if it matters to them the way it does to me.
Of all the ironies of this meme-stock era, where armies of motivated buyers push up the prices of stocks that have no business being up in thin air, it would really be something if the bear market took a leg down because of effectively the opposite type of buyer-seller interaction.
So, for at least one investment professional (ME) who lived through the 1987 crash and never forgot it, this circumstantial evidence is sufficient to bring to the attention of anyone who might want to consider it. After all, to me, risk management is not part of investing. It is investing.
iShares Core MSCI Total International Stock ETF (NASDAQ:IXUS) is an exchange-traded fund (“ETF”) that invests in public equity markets of the global ex-U.S. region. It was launched by BlackRock, Inc. (BLK), and is managed by BlackRock Fund Advisors.
Since the Covid-19 pandemic broke out three years back, it has been difficult to find opportunities in the U.S. markets. Russia’s invasion of Ukraine further complicated the scenario. Large-cap U.S. technology stocks are currently in a bear market. 2022 was especially a poor year for the overall stock market. Despite all these, IXUS delivered decent yield and double-digit annual average total returns over the long run. During last year, it generated a yield of 3.72 percent. IXUS’s low turnover ratio of 10 percent also works to its advantage.
iShares Core MSCI Total International Stock ETF Has High Growth Prospects
iShares Core MSCI Total International Stock ETF was formed on October 18, 2012 and has been consistently paying semiannual dividends since then. IXUS’s portfolio seeks to track the investments of the MSCI ACWI ex USA IMI, which is composed of large-cap, mid-cap, and small-cap non-U.S. equities. This index is a free float-adjusted market capitalization index that measures the combined equity market performance of developed and emerging markets countries, excluding the United States. The fund generally invests at least 80 percent of its assets in the component securities of its underlying index, and AXUS’s portfolio is created by using representative sampling techniques.
iShares Core MSCI Total International Stock ETF qualifies with respect to some minimum requirements according to my “7 Factor Model for Evaluating a Fund.” The fund has a current market price of $58.67, AUM of $29.97 billion, yield of little less than 4 percent coupled with a very low expense ratio of 0.07 percent and a well-diversified portfolio. International equities delivered better returns over U.S. stocks. However, returns of foreign assets suffered due to the strengthening U.S. dollar. As the U.S. dollar appreciates with respect to foreign currencies, all the assets invested in international markets become less valuable when converted back into US dollars. As a result, the higher returns earned on foreign equity stocks are being offset by an appreciating U.S. dollar.
Performance and Risks of iShares Core MSCI Total International Stock ETF
iShares Core MSCI Total International Stock ETF is a well-diversified exchange traded fund with industrial, financial, information & communication technology (ICT), and healthcare sectors accounting for almost 60 percent of its entire investments. An emphasis on innovative technologies, increasing demand for healthcare facilities, and revolutionary changes in industrial structure, these sectors are expected to generate above-average growth in the coming decade. As economic growth takes an upward shift, the financial sector will become the biggest beneficiary. Top investments of this global equity fund from these sectors also performed quite well over the long run. During the past 10 years, its yield ranged between 2 and 4 percent. During 2016 and 2021, this exchange traded fund generated an annual average total return of almost 10 percent.
More than 70 percent of IXUS’s assets are invested in ten countries. Half of them are developed markets like Japan, the United Kingdom, Canada, France, and Switzerland. All these economies have the best sovereign bond ratings. Also, despite low growth, all these economies are still growing at a consistent pace. Another half are emerging Asian economies of Australia, China, India, Taiwan, and South Korea. These five markets are having the biggest growth potential among the large economies. Although not having the best credit ratings, these countries have investment grade sovereign bonds ratings. This international ex-U.S. diversified equity fund invests in 4310 equity stocks with more than one percent of its total assets invested in only two stocks – Taiwan Semiconductor Manufacturing Company Limited (TSM) and Nestle S.A. (OTCPK:NSRGY).
Foreign markets offer a different set of challenges that goes beyond those witnessed in the U.S. equity markets. While inflation is a huge concern all over the world, global economies are far away from any type of recession or economic slowdown. Having said that, localized inflation resulting from high energy prices surely makes things difficult. Fortunately, a resolution of the Russia-Ukraine conflict will make things pretty usual. So, in the long run, investments in international equity markets will surely produce results. In the meantime, inflation will continue to be a reason to be skeptical. A broad recovery in large-cap US-based technology stocks would likely lead to continued underperformance of foreign stocks relative to U.S. stocks. If dollar continues to strengthen, the war in Ukraine escalates further and global inflation worsens, then the case for foreign stocks, already contrarian, will break down.
Investment Thesis
iShares Core MSCI Total International Stock ETF has a low-yielding portfolio that invests almost three-fifths of its assets in four sectors – ICT, healthcare, financial, and healthcare. These sectors are expected to generate quite high average growth over the long run. I find this fund to be promising according to my “7 Factor Model for Evaluating Global Funds.” In addition to current market price, AUM, yield, expense ratio, and portfolio diversification, the level of discount from its current net asset value, its portfolio risk and the sustainability of its current level of returns enables me to understand the attractiveness of a fund for its investors. The fund is currently trading at a marginal discount to its NAV. Its major investments also performed well.
U.S. stocks performed poorly in 2022, with large-cap technology stocks dragging the averages down. These large-cap techs had relatively less impact on foreign equity funds, particularly in Europe. With the ongoing war in Ukraine, there is also a scope of taking advantage of depressed valuations. IXUS’s well-diversified portfolio also carries risk that’s relatively lower than U.S.-based funds. The short term is difficult to predict due to the uncertain economic conditions all over the globe. But if major economies all over the world are able to stay clear of recession, current valuations would make global equity stocks and corresponding equity funds quite attractive.
In my opinion, iShares Core MSCI Total International Stock ETF is not suitable for income-seeking investors due to its low yield, but the kind of total return it generates over the long run should make growth-seeking investors interested in the IXUS ETF.
This is the second most overvalued sector, and no industry looks really attractive. The most overpriced one is personal care products. Fast facts on iShares Global Consumer Staples ETF, an international alternative to XLP.
The Nationwide Russell 2000® Risk-Managed Income ETF (NTKI) is an actively managed fund that seeks monthly income and invests in a portfolio of securities that replicates the Russell 2000 ® Index. It’s an