
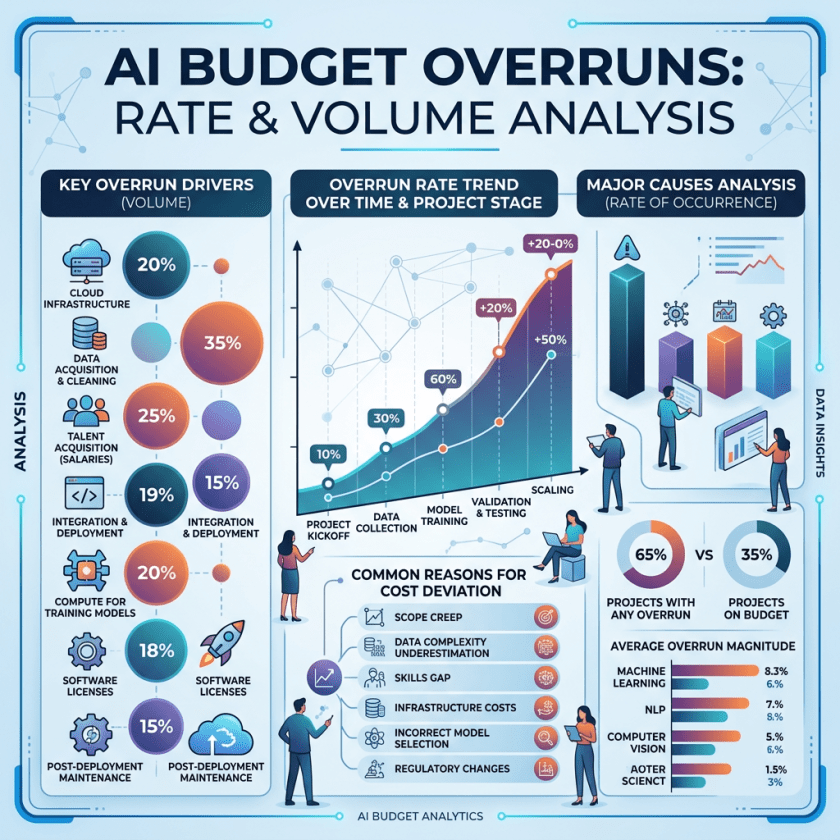
Runaway token spend is less a pricing problem than a management problem. CIOs need a way to separate genuine demand growth from shifts in work mix, activity location and execution efficiency. If variance is reported only at the total budget line, leaders can end up cutting the wrong teams, the wrong use cases or the wrong model patterns.
A rate-volume view creates a clearer accountability structure because it ties spend variance to responsibility areas, not just a central AI bill. That matters for operating model decisions: who owns forecast accuracy, who explains exceptions, and who has authority to change prompts, model choice, usage policies or workflow design when costs move outside tolerance.
The trade-off is data discipline. A useful analysis depends on agreed token categories, consistent cost allocation and a practical level of forecast detail. If the organisation cannot reliably attribute spend by project, function or product, leaders should treat the first dashboard as a control tool rather than a perfect planning instrument.
The next question is not simply what overspent, but what decision should change. CIOs should ask which variances are acceptable because they reflect value creation, which are signals of poor design or waste, and which need a portfolio reset. That distinction turns AI cost review into governance, not just reporting.
So, you’ve blown through your AI budget. Join the club. 79% of enterprises say they’ve experienced an AI budget overrun in the last 12 months. Blaming token consumption may have worked once. But as the adage goes “fool me once, shame on you. Fool me twice…” You know the rest. Token consumption is a combination of multiple factors and not conclusive on its own. Hence, you need a better tool for variance analysis or you risk getting “fooled twice”.
What Drives Token Expense Variances
When it comes to analyzing variances in token spend, enterprises are trying to answer three questions: (1) what did we plan to spend, (2) what did we actually spend, and (3) what drove the difference? The answers to the first two questions are a function of (a) the price paid per token consumed and (b) the quantity of tokens consumed. But what many overlook is that there are numerous types of tokens, each linked to different activities and each with different prices. So, to answer the third question and understand the drivers of token spending variances, enterprises must understand not only the total token consumption, but also the mix of tokens being consumed and their respective price points. Without this, you’re flying blind.
Use Rate-Volume Analysis to Dig Deeper into Variance Drivers
A rate-volume analysis is a great tool for getting tech leaders closer to the drivers of AI spending variances. Start with three sections, each broken out by the type of token: (1) budget vs actual total spend, (2) budget vs actual average price per token and (3) budget vs actual volume of tokens consumed. Leaders can then apply this analysis to individuals, cost centers, projects or any other responsibility area they want.
Different Variances Require Different Actions
Using a rate-volume analysis by token type, leaders can distinguish between types of variances and understand the corrective action suggested by each.
- Rate variance: a change in average token prices is driving the over/under in spend. Understanding where prices changed and for which tokens enables leaders to understand the activities that got more or less expensive than expected.
- Volume variance: a change in the total volume of tokens consumed is driving the over/under in spend. Understanding the category of token and the stakeholders driving the variance enables leaders to understand the activities that are consuming more or less than expected.
- Mix variance: if the total volume of tokens is consistent with budget, but the spread across the token categories varied, then there is a variance in the mix of tokens consumed, either by a shift away from lower-cost token categories to higher-cost token categories, or vice-versa. Understanding shifts in mix enables leaders to understand drivers like (a) changes in the focus of AI activities over time or (b) inefficiencies in, say, API calling or output storage.
What CIOs should do next
The next steps you can take toward implementing a rate-volume analysis include:
- Establish the responsibility areas where you want to drive visibility into AI spend.
- Confirm the availability of the data you need, namely (a) budgeted and actual total spend by token type, by responsibility area and (b) budgeted and actual total token consumption by token type, by responsibility area. If you don’t have budgeted metrics by token type or responsibility area, then build the report based on actual and use the actuals as a guide for your budget (or forecast).
- Develop a PoC rate-volume dashboard in a spreadsheet or BI tool and collect feedback.
- Once you’re confident in the reliability of the data and the collection process, document the production process of the report.
CIOs: Use Rate Variance Analysis To Get To The Bottom Of Runaway Token Spend
Enjoyed this article? Sign up for our newsletter to receive regular insights and stay connected.