One useful way to read U.S. sector exposure is not as a forecast, but as a portfolio tool. For investors who already hold a domestic equity core, sector sleeves can add a different source of return drivers without requiring a full country shift. That matters when the local market is dominated by a narrower set of industries or policy exposures than the U.S. market.
The index design is just as important as the sector label. Capped sector indices can change how much an investor is really getting from a few giant companies versus the broader segment. In practice, that means the same sector can behave very differently depending on whether it is cap-heavy, rebalanced regularly, or constrained by concentration rules. For long-term allocators, those details shape diversification far more than the headline sector name.
ETF implementation also deserves attention. Sector ETFs are usually straightforward access vehicles, but the right choice depends on liquidity, index turnover, and how closely the fund tracks its benchmark. A liquid ETF can be helpful for tactical positioning, yet investors should still think about bid-ask spreads, rebalancing costs, and whether the strategy is meant to complement a core holding or express a short-lived view.
For Chinese investors, the bigger lesson is behavioral as well as structural: U.S. sectors can reduce home-country bias, but only if they are used within a disciplined allocation framework. Sector exposure works best when it is tied to a clear portfolio roleโdiversifier, satellite position, or tactical tiltโrather than as a reactive trade around headlines.
Chineseย investors tend to exhibit high exposure to domestic equities. Incorporating U.S. equities could help Chinese investors diversify their strategies and alleviate home-country bias.ย For example, the S&P 500ยฎ may be relevant for exposure and sensitivity to theย U.S. economy.ย Additionally, market participants seeking to offset domestic equity biases or express tactical views may wish to consider the potential applications of the S&P 500 sector indices.
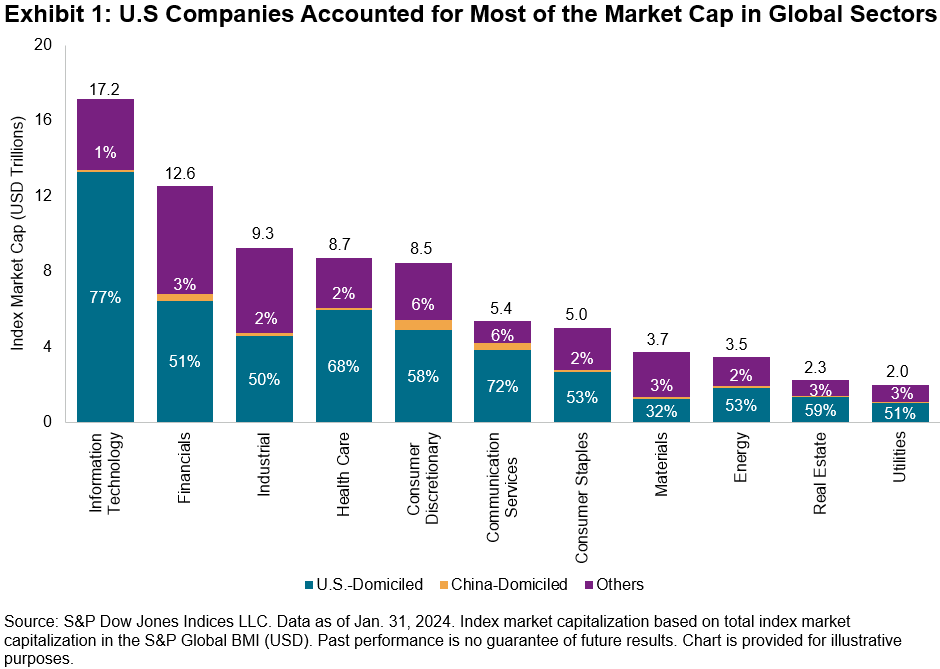
The representation of U.S. equities in global equity markets underscores the importance of a U.S. perspective when looking to express views on various sectors. Exhibit 1 shows the proportion of each GICSยฎ sector represented by companies domiciled in different parts of the world. Specifically, U.S.-domiciled companies accounted for most of the market capitalization in 10 out of the 11 global sectors.
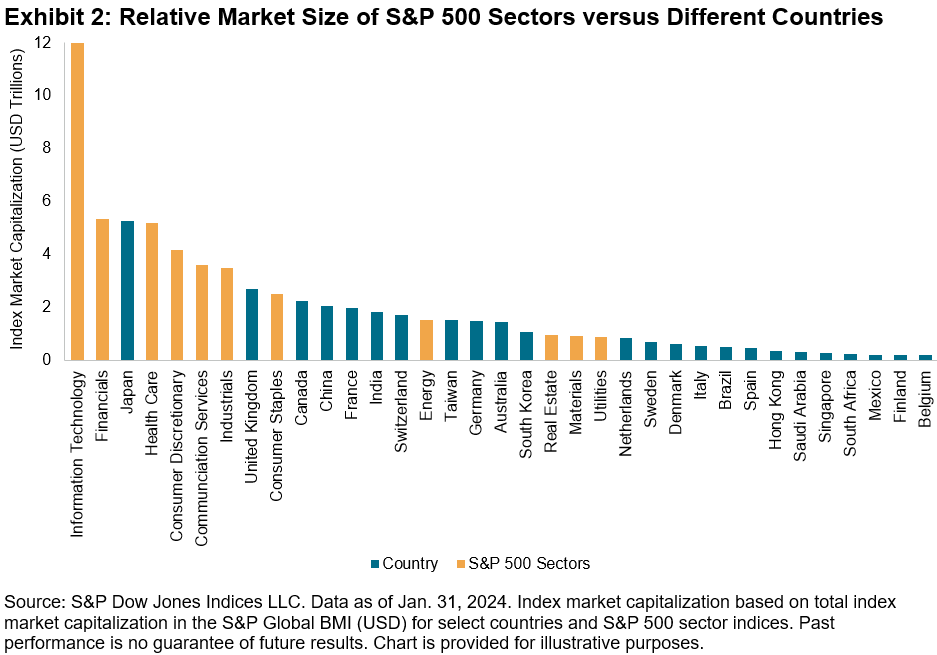
Moreover, the breadth and depth ofย the U.S.ย equities market meansย that the size of S&P 500 sectors is comparable to many countries. For instance, as of Jan. 31, 2024, the market capitalization of the S&P 500 Information Technology (USD 12 trillion) was second only to the entire U.S. market in the S&P Global BMI (USD 50 trillion). The S&P 500 Financials and S&P 500 Health Care are comparable in size to the Japanese market. The size of U.S. sector segments means that expressing views through a sector lens could have presented similar opportunities – as measured by market size orย capacity-adjusted dispersionย – as expressing views through a country lens, historically.
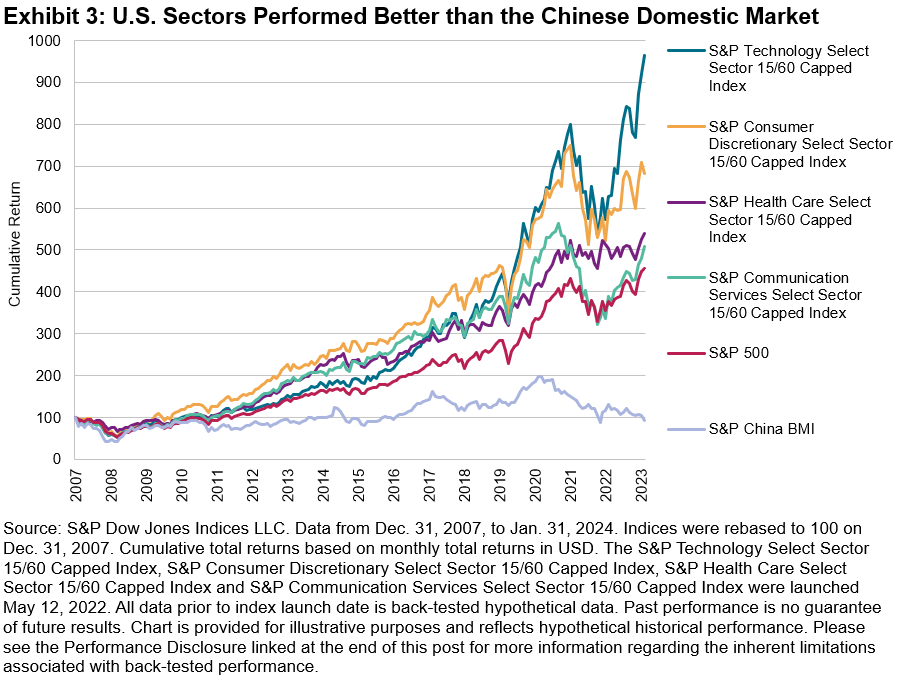
Theย S&P Select Sector 15/60 Capped Indicesย measure the performance of S&P 500 companies across the 11 GICS sectors while employing a capping mechanism that limits the weight of the largest companies in the index. These U.S. sector indices could help Chinese investors diversify their strategies, especially when the domestic market is underperforming.
In recent years, China has grappled with a slower-than-expected recovery from the COVID-19 pandemic and encountered various internal and external challenges. During the same period, however, certain U.S. sectors showcased remarkable resilience and delivered substantial returns. For example, theย S&P Communication Services Select Sector 15/60 Capped Index, which experienced a larger decline than the S&P China BMI in 2022 (-34% versus -22%, respectively), rebounded with a 42% return in 2023, while the S&P China BMI saw an additional 10% drop.
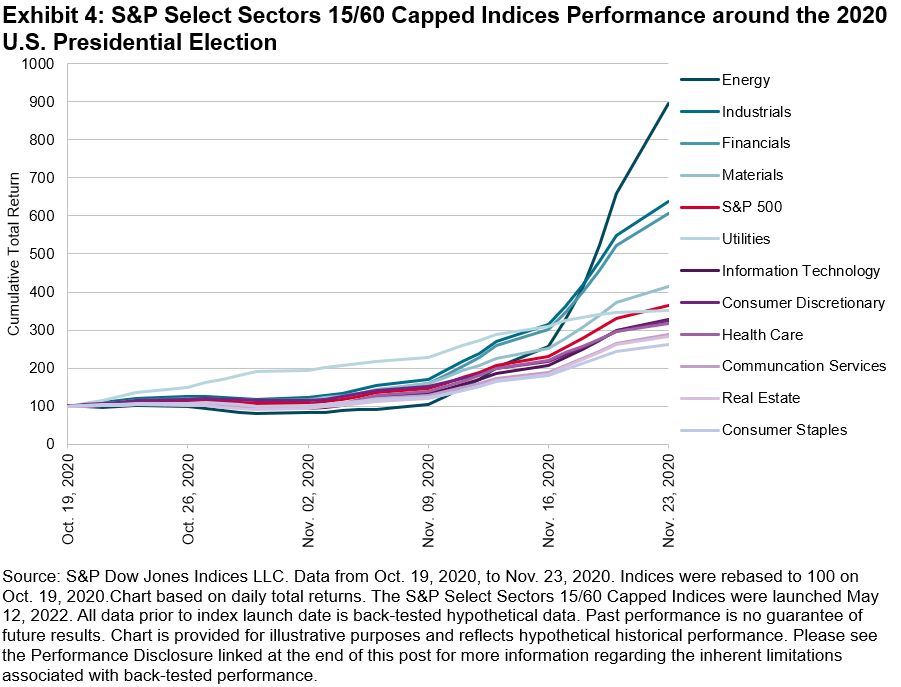
Historical evidence highlights the potential value of utilizing sectors to express views on the U.S. Presidential election, as investors often factor in the anticipated impact of candidates’ policies on various market segments.ย The 2016 electionย saw a significant divergence between the best- and worst-performing sectors, emphasizing the potential value of expressing views through a sector lens. More recently, sector performance around the 2020 election was influenced by several dynamics, including surging oil prices which helped Energy companies to outperform (see Exhibit 4).
As we approach the end of 2024, a new round of the presidential election is underway. Given the prevailing global and U.S. conditions, Chinese investors could still leverage U.S. sectors to convey their perspectives on the potential impacts of the election.
Overall, U.S. sectors represent significant market segments and could offer opportunities that Chinese investors may not want to overlook, whether for global equities exposure or tactical strategies. The upcoming presidential election further provides a platform for investors to express views on U.S. matters, adding an additional dimension to the strategic considerations for Chinese investors.
Disclosure:ย Copyright ยฉ 2024 S&P Dow Jones Indices LLC, a division of S&P Global. All rights reserved. This material is reproduced with the prior written consent of S&P DJI. For more information on S&P DJI, please visitย S&P Dow Jones Indices. For full terms of use and disclosures, please visitย www.spdji.com/terms-of-use.
Editor’s Note: The summary bullets for this article were chosen by Seeking Alpha editors.