
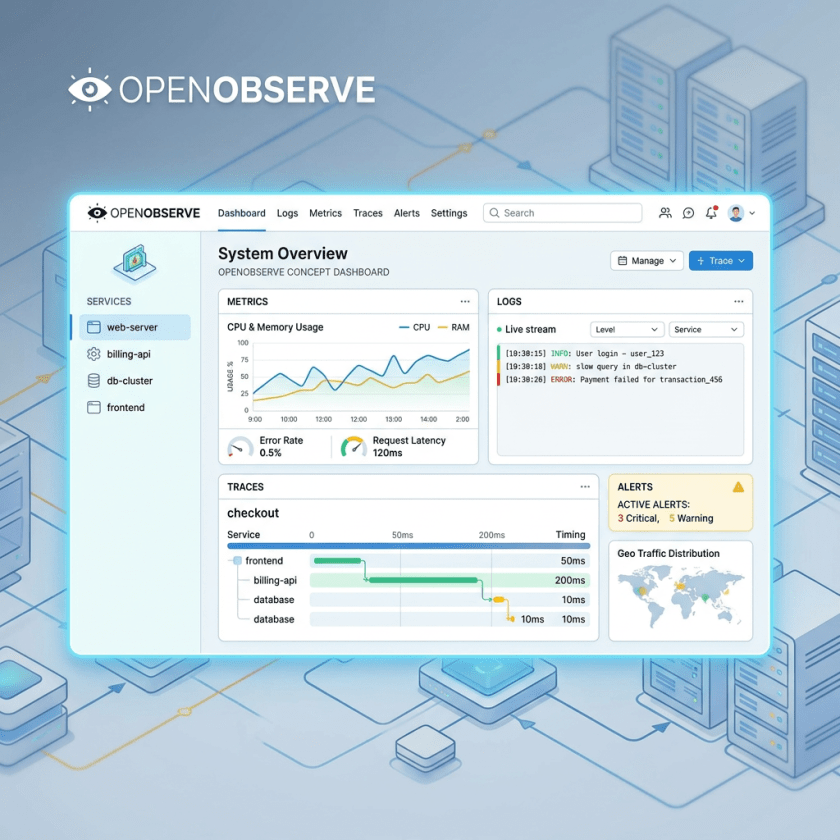
Engineering teams drowning in five- and six-figure monthly observability bills now have a production-proven alternative with serious traction: OpenObserve, the Rust-built unified observability platform, announced July 15 that its open-source repository surpassed 20,000 GitHub stars, placing it among the most-starred observability projects in the world. More than 8,000 organizations are already running it in production — including Fortune 100 enterprises that ingest over 2.5 petabytes of telemetry each day — and the platform claims 140 times lower costs than Elasticsearch.
That 140x figure is not marketing abstraction. It is the result of a specific architectural decision made possible by starting from scratch in 2022 rather than inheriting the design assumptions of a decade-old search engine.
Why Parquet Beats an Inverted Index at Observability Scale
Elasticsearch, which forms the storage layer in the ELK stack and underlies much of Datadog’s log management, was designed around an inverted index — a data structure optimized for full-text search. An inverted index maps every unique term in every field of every log line back to the documents containing it. That approach is extraordinarily fast for keyword search. It is extraordinarily expensive for telemetry, because modern systems produce thousands of unique trace IDs, session IDs, service names, and user identifiers per second. At that cardinality, the index itself balloons to the point where the index overhead often exceeds the size of the actual data being stored.
OpenObserve abandons the inverted-index model entirely. Instead, it stores all telemetry — logs, metrics, and traces — as Apache Parquet files in object storage such as Amazon S3, Google Cloud Storage, or Azure Blob. Parquet is a columnar file format: rather than organizing records row by row, it stores all values for a given field contiguously on disk. When a query needs to compute the average latency across a set of traces, the engine reads only the latency column from the relevant Parquet files — it never touches the trace IDs, user agents, or request bodies that would fill adjacent columns in a row-oriented store.
The query engine is Apache Arrow DataFusion, a columnar query engine that can directly interrogate Parquet files without loading them into an intermediate database. Combined with Parquet’s native compression (approximately 40x for typical telemetry workloads), this produces the 140x cost gap: the index overhead disappears, the compression ratio rises, and the storage layer becomes commodity object storage priced in cents per gigabyte rather than the capacity-constrained SSDs that Elasticsearch clusters require.
The entire stack is written in Rust, which eliminates the JVM tuning overhead that makes Elasticsearch cluster management a specialized skill. The result is a single binary that can run on a developer laptop or scale horizontally to petabyte-class production workloads with no architectural change — stateless nodes coordinate via NATS messaging, and data durability is delegated to S3’s own eleven-nines reliability guarantee.
LLM Monitoring as a Native Signal, Not a Bolt-On
The milestone lands at an inflection point for the observability market. Engineering teams moving AI applications from prototype to production are discovering that the telemetry problem changed shape: a single user interaction with an LLM-powered product may now involve a prompt construction step, multiple model API calls, tool invocations, vector database retrievals, guardrail checks, and a final response synthesis — each of which has latency, cost, and failure characteristics that need to be traced and debugged.
Purpose-built LLM observability platforms capture model-level data but sit disconnected from the infrastructure logs and application traces that show what the rest of the system was doing during the same request. OpenObserve’s native LLM observability module places token and latency data inside the same queryable store as the container logs and Kubernetes metrics from the host that served the request.
The integration layer is already substantive. As of June 2026, the platform supports tracing Amazon Bedrock model calls and Bedrock Agents using OpenTelemetry’s gen_ai semantic conventions, can trace Claude Agent SDK pipelines including tool calls and MCP server interactions, and maps all of these signals to the same session and trace context as the surrounding infrastructure. That correlation matters in practice: a token cost spike that is invisible at the model layer often has a visible cause in the infrastructure layer — a cold-start latency, a database query returning a larger payload than expected, or a retry loop from a downstream dependency.
Datadog’s $3.4B Market Defines the Competitive Moment
The commercial observability market OpenObserve is entering is mature, well-funded, and demonstrably expensive. Datadog posted $3.43 billion in revenue for fiscal year 2025, up roughly 28% from the prior year. Splunk, which Cisco acquired for $28 billion in March 2024, now operates as the cornerstone of Cisco’s security and networking portfolio. Both platforms are formidable — deeply integrated, trusted at enterprise scale, and backed by sales organizations that OpenObserve cannot yet match. But their pricing models are a recurring source of engineering frustration.
Datadog meters ingested gigabytes, indexed log events, hosts, custom metrics, and seats across dozens of SKUs. Teams that leave Splunk’s per-gigabyte ingestion pricing over unpredictable bills sometimes discover they have traded one cost-management project for another. OpenObserve’s self-hosted open-source version eliminates per-host and per-seat pricing entirely. The company’s own benchmarking suggests that teams migrating from Datadog or Splunk typically see 60–90% reductions in total observability spend.
Independent analysts offer a more cautious picture of the tradeoffs. OpenObserve’s enterprise support ecosystem lags behind Datadog’s and Grafana’s in maturity. The platform does not yet offer eBPF-based auto-instrumentation, which Datadog uses to capture traces without requiring any code changes in the instrumented application. Incident management features — on-call scheduling, phone and SMS escalation, integrated runbooks — are in active development on the Enterprise tier and are not yet at the maturity level of dedicated tools like PagerDuty.
The AGPL-3.0 license also matters for enterprise procurement teams. Organizations that embed or modify OpenObserve inside a commercial software-as-a-service product must open-source their modifications under the same license — a constraint that requires legal review before deployment in certain commercial contexts.
Where Does OpenObserve Stand Against SigNoz?
The nearest architectural peer in the open-source observability space is SigNoz, which also unifies logs, metrics, and traces in a single platform and is also OpenTelemetry-native. The key architectural distinction is at the storage layer: SigNoz uses ClickHouse, a purpose-built columnar OLAP database that runs as its own server process, while OpenObserve stores data directly as Parquet files in object storage. OpenObserve’s approach removes the database server from the operational picture entirely — there is no ClickHouse cluster to size, tune, or back up. The tradeoff is that ClickHouse’s richer aggregation and real-time analytics capabilities may edge out DataFusion for certain query patterns, particularly complex multi-dimensional GROUP BY workloads common in product analytics.
What Comes Next
OpenObserve in April 2026 announced a $10 million Series A co-led by Nexus Venture Partners and Dell Technologies Capital, simultaneously with the launch of its Observability 3.0 capabilities — an autonomous AI SRE agent that performs deep semantic analysis across logs, metrics, and traces to produce root cause summaries and recommended action items during incidents, alongside anomaly detection and the LLM monitoring module.
Version 0.91.0, released June 23, added a redesigned UI and introduced AI agent observability with MCP protocol support and agent tracing. In June the platform launched in the AWS Mumbai region, aimed at APAC customers with data residency requirements.
The questions ahead for OpenObserve are the familiar ones for ambitious open-source infrastructure projects scaling toward enterprise buyers: whether the $10M in Series A capital is sufficient to build the professional services organization, compliance certifications, and 24×7 support structures that large-company procurement teams require, and whether the AGPL license and APM feature gaps cost the platform deals that a more mature commercial or permissively licensed competitor wins.
Developers can access the project at github.com/openobserve/openobserve. The open-source edition is licensed under AGPL-3.0 and described by the company as production-ready and feature-complete for self-hosted deployments.
Frequently Asked Questions
How does OpenObserve actually reduce storage costs compared to Elasticsearch?
The mechanism is architectural, not just a matter of using cheaper cloud storage. Elasticsearch builds an inverted index — a full mapping of every term to every document that contains it — which balloons in size as telemetry cardinality grows (every unique trace ID and user ID adds index entries). OpenObserve instead stores telemetry as Apache Parquet files, a columnar format that groups similar field values together and compresses them at ratios around 40x for typical log data. When the Apache Arrow DataFusion query engine reads a Parquet file, it can retrieve only the columns a specific query needs rather than reading full records. Those two changes — no inverted index and column-only reads — together produce the claimed 140x cost gap over Elasticsearch at typical observability workloads.
Can OpenObserve replace a dedicated LLM observability tool like Langfuse or Helicone?
For teams that want a single platform covering both infrastructure and AI workloads, OpenObserve’s native LLM observability module handles token consumption, cost tracking, latency, and error rates, and correlates those signals with the infrastructure logs and traces from the same request. That correlation is OpenObserve’s main advantage over dedicated LLM tools, which capture model-layer data but cannot show what the surrounding infrastructure was doing. The tradeoff is that Langfuse offers deeper evaluation frameworks and prompt-management features that OpenObserve does not yet match.
What does the AGPL-3.0 license mean for enterprise teams evaluating OpenObserve?
Self-hosted use inside a company’s own infrastructure for internal observability purposes does not typically trigger AGPL obligations. The license becomes a procurement issue when an organization wants to embed or modify OpenObserve as part of a commercial software product it distributes to customers, in which case the modified source code must also be released under AGPL. Teams in that situation should engage legal counsel before deployment and may wish to evaluate the commercial Enterprise license, which has different terms.
Is OpenObserve ready for production at enterprise scale?
The 8,000+ organizations running OpenObserve in production — including Fortune 100 companies processing petabytes of telemetry daily — suggest it has cleared the proof-of-concept threshold. The practical gaps to evaluate for enterprise buyers are: less mature enterprise support SLAs compared to Datadog or Grafana Enterprise, no eBPF auto-instrumentation (meaning every service must be instrumented through OpenTelemetry SDKs or agent sidecars), and incident management features that are still maturing toward production readiness for on-call workflows.
Enjoyed this article? Sign up for our newsletter to receive regular insights and stay connected.