
Checking In On The U.S. Consumer

For ETF investors, the key takeaway is not just whether the U.S. consumer is strong, but how uneven that strength is. A consumer-led economy can look resilient at the headline level while still hiding strain in lower-income cohorts, revolving credit, and discretionary spending. That matters because broad market ETFs often carry significant exposure to retailers, restaurants, travel, housing-linked activity, and credit-sensitive financials.
One useful portfolio angle is sector transmission. If spending remains concentrated among higher-income households, the firms most exposed to premium consumption may hold up better than those serving price-sensitive buyers. By contrast, weak real wage growth and rising delinquency can show up first in discount retail, consumer finance, and select discretionary names. Investors using sector ETFs should therefore think in terms of customer mix and financing dependence, not just “consumer” as a single bucket.
The second angle is portfolio rebalancing discipline. When markets have rewarded cyclical and consumer-exposed assets for a period, it can be tempting to let those weights drift higher. But if spending is being maintained through debt rather than broad income growth, the risk profile changes. Rebalancing can help keep exposure aligned with a long-term plan instead of a late-cycle narrative.
Finally, watch the consumer through multiple lenses. Income, savings, debt service, and delinquencies can diverge for long stretches, so ETF positioning should be based on a range of indicators rather than one headline confidence survey. For long-term investors, that usually means pairing consumer-sensitive allocations with more defensive or diversified exposures rather than treating the U.S. consumer as uniformly healthy or weak.
Why Does Consumer Data Matter?
Consumer spending comprises about 70% of US Gross Domestic Product (GDP) and has always been the leading driver of GDP. As a result, the US economy relies on the health and trends of consumer spending. In other words: as the consumer goes, the economy goes.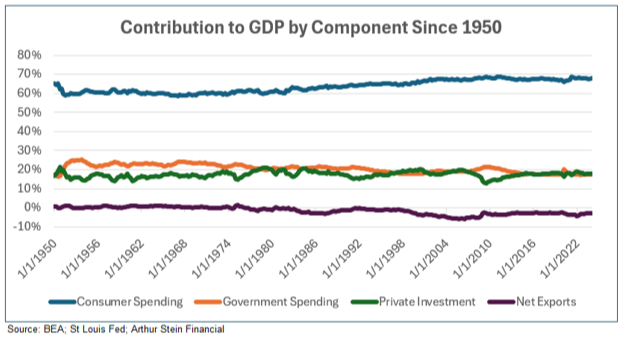
The Consumer Income Statement
Income minus Spending = Savings. We will not address taxes, but that is another “expense” people must pay before they can turn earnings into savings.Income
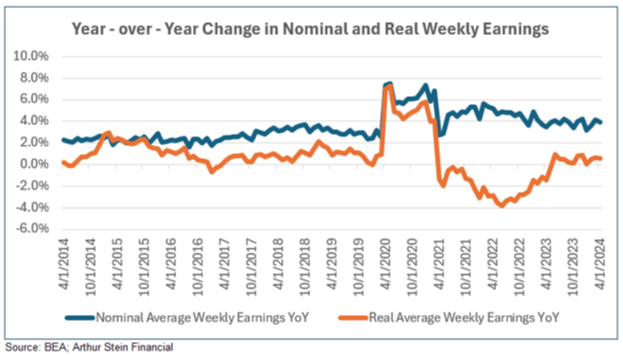
Nominal wages, salaries, and income have increased steadily over time but range widely between the lowest earners and top earners.
Spending
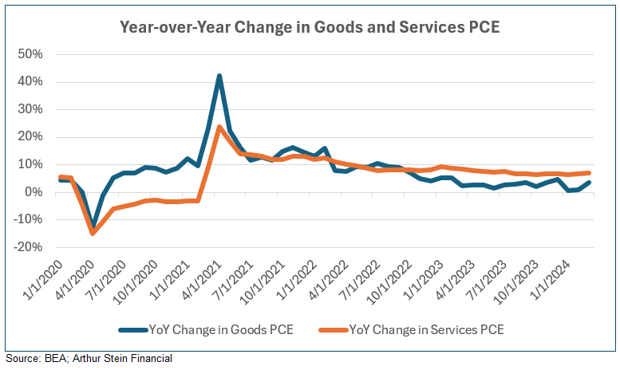
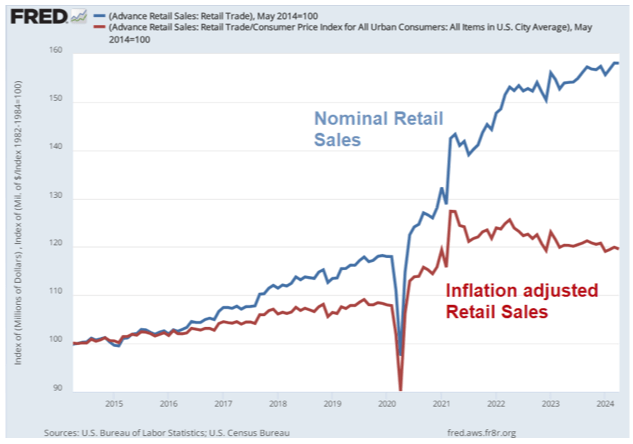
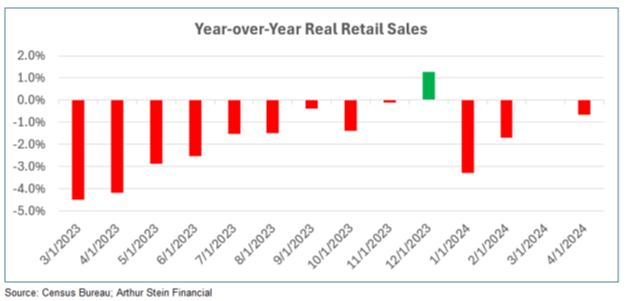
Consumer spending has been strong, but some cracks have emerged recently. The two primary ways to measure consumer spending are Real Personal Consumption Expenditures (Real PCE) and another called Retail Sales. Real PCE measures the value of the goods and services purchased by U.S. residents and includes goods as well as things like healthcare, rent, and insurance. Retail Sales measures spending at a variety of retail locations including auto dealers, bars & restaurants, clothing stores, gas stations, and others. PCE has remained strong, growing about 2-3% for much of the last year or so.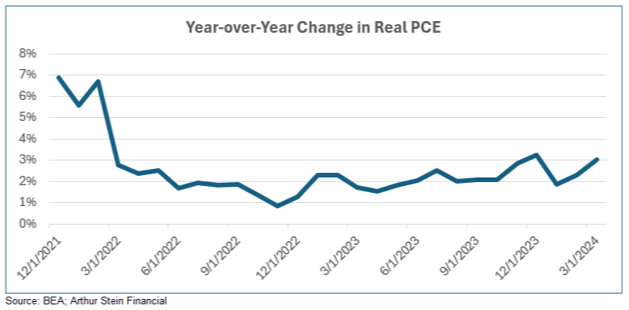
Savings
In aggregate, the savings rate among US consumers is at one of its lowest levels in the last 50 years and well below average. Although savings levels were high during the Covid-era, the savings rate has dropped back near the lows of 2022.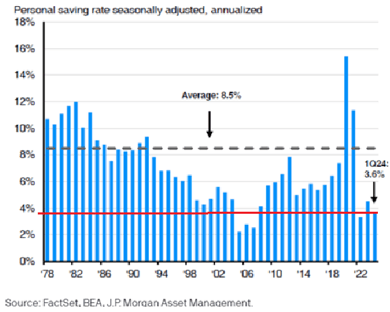
Consumer Debt
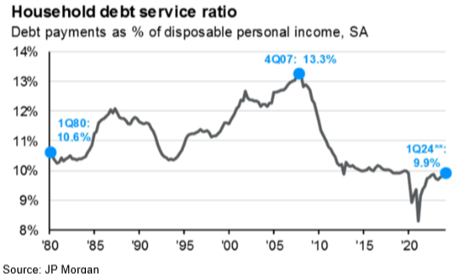
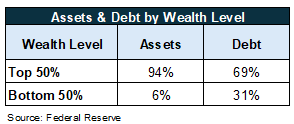
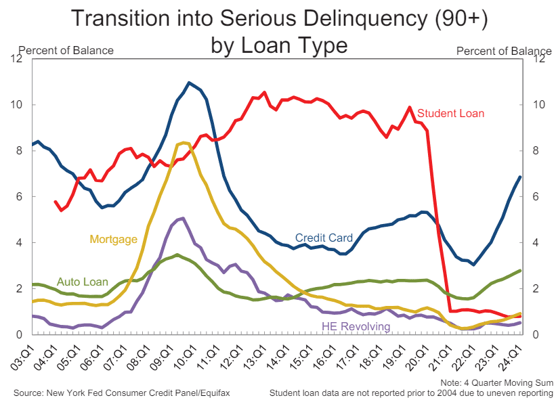
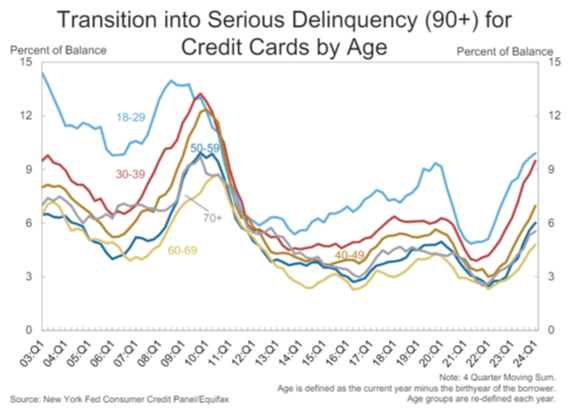
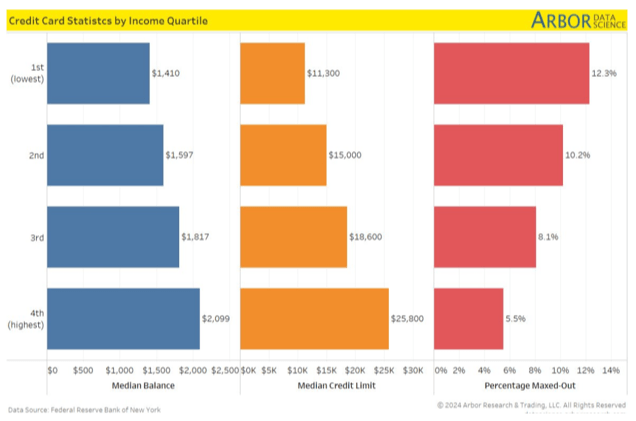
Americans have a lot of debt. That is not necessarily a bad thing because having a mortgage on a house or taking out a loan to pay for a car enables people to utilize their asset now while paying for it over time. Debt only becomes an issue when debt payments can’t be paid for with income or modest savings withdrawals. Each quarter, the New York Fed puts out the Original Postdf/HHDC_2024Q1" target="_blank" rel="nofollow noopener">Household Debt and Credit Report which contains valuable insights to consumers debt levels. As of the end of the 1Q24, consumers held $17.69 trillion in debt, mostly through mortgages.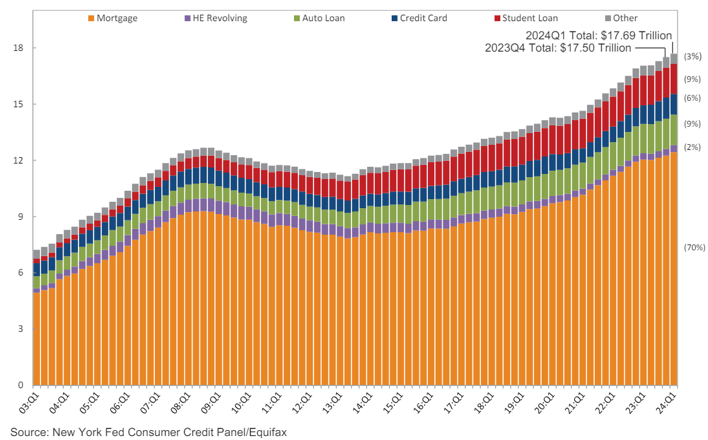
How is the Consumer Feeling?
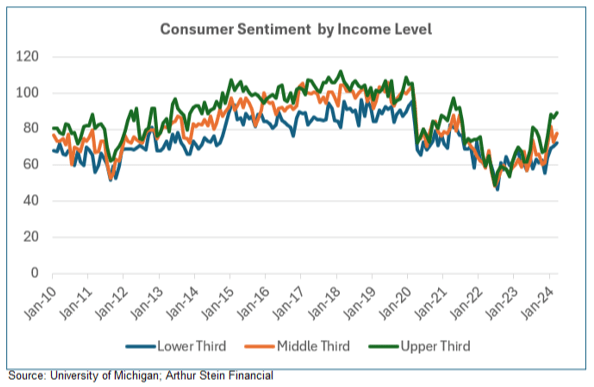
Survey data have varying degrees of reliability and some are better than others, but let’s see how consumers have been reporting their confidence and sentiment. The University of Michigan has been polling consumers since the 1940s. Overall, consumer sentiment has increased since 2022 but is still well below pre-Covid levels and has started to decline during the last few months. Sentiment by income level diverges quite a bit with poorer people reporting less favorable sentiment.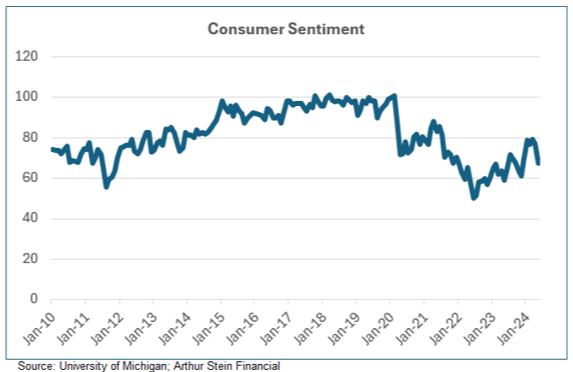
Conclusion
This has been a notably difficult economic environment to understand, and it remains difficult to get a good sense of the state of the US consumer. Many economists and pundits have predicted a recession and a slowdown for the consumer due to higher inflation and interest rates than consumers have been used to. We haven’t seen that in a major way so far. To determine whether or not the consumer is in good shape, it may depend on which consumer. Based on the data, the consumer appears to be resilient in the aggregate. However, lower- and middle-class consumers clearly appear to be struggling and are increasingly resorting to debt that they can’t pay to make purchases. It’s most appropriate to think of this economy as one that is being held up by consumers in the top half of the income bracket while the lower half may be falling behind.Enjoyed this article? Sign up for our newsletter to receive regular insights and stay connected.