Summary
- The Vanguard Small-Cap Growth ETF is down 23% YTD, and unfortunately, I expect more downside. A shocking 37% of VBK’s constituents didn’t turn a profit last quarter.
- Its 29.18 forward price-earnings ratio is also understated. After applying Morningstar’s 60 P/E cap to these non-profitable companies, VBK’s forward P/E skyrockets to 36.96.
- Application Software and Biotechnology are two industries in danger. They combine to total 17% of VBK, and I’ll give my reasons why I think you should avoid them.
- Given these poor metrics, it’s much more prudent for growth investors to just buy the Nasdaq-100 Index. I’ll provide VBK’s fundamentals alongside QQQ to make this clear.
- It’s not worth waiting around for sentiment to improve. VBK is one of my easier “sell” recommendations.
- Looking for a portfolio of ideas like this one? Members of Hoya Capital Income Builder get exclusive access to our model portfolio.
Investment Thesis
The Vanguard Small Cap Growth ETF (NYSEARCA:VBK) is a well-diversified group of nearly 700 companies with market capitalizations averaging just under $4 billion. Vanguard charges a modest 0.07% annually to own this popular $13 billion ETF. After a tumultuous 2021 and 2022 that’s seen VBK underperform its small-cap-value counterpart by 40%, it’s logical investors might consider VBK a tremendous “value” opportunity. Perhaps a return to 2020, where VBK outperformed small-cap value by 40%, is in order.
While anything is possible, I believe it’s unlikely. Moreover, even if sentiment turns positive again, investors are much better off with the large-cap growth stocks in the Nasdaq-100 Index. This article will present VBK’s fundamentals alongside the Invesco QQQ ETF (QQQ), highlight how VBK’s 29.18 forward price-earnings ratio is understated, and why a focus on profitability is your best defense against a bear market.
ETF Overview
VBK tracks the performance of the CRSP US Small Cap Growth Index, classifying growth stocks based on the following factors:
- Future long-term earnings per share growth
- Future short-term earnings per share growth
- Three-year historical earnings per share growth
- Three-year historical sales per share growth
- Current investment-to-assets ratio
- Return on assets
CRSP employs a banding and migration method that allows securities to appear in growth and value indexes with different weightings. Therefore, although it’s not a “pure” small-cap growth Index, it’s pretty close. According to the ETF Research Center, VBK and the Vanguard Small Cap Value ETF (VBR) have 103 overlapping holdings but just a 3% overlap in weight.
VBK’s top holdings include numerous Technology and Real Estate securities. Semiconductor stock Entegris (ENTG) and Residential REITs Equity LifeStyle Properties (ELS), and American Homes 4 Rent (AMH) are a few examples.
Vanguard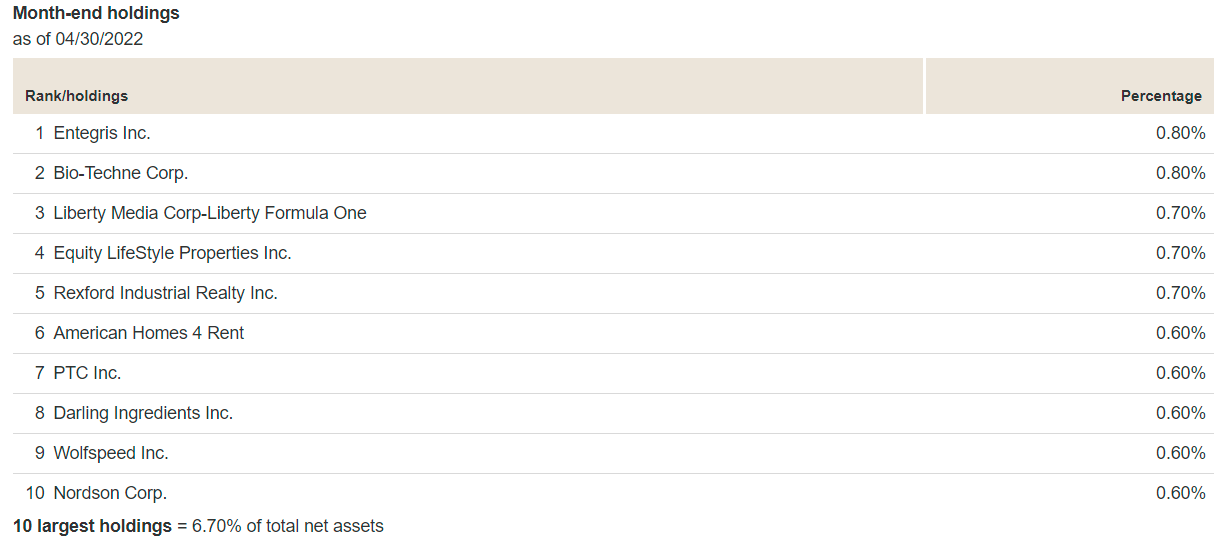
I’ve listed a few other small-cap growth ETFs worth considering. Instead of a CRSP Index, you could buy an ETF tracking the S&P SmallCap 600 Index (SLYG, IJT) or one tracking the Russell 2000 Growth Index (IWO, VTWG). Vanguard often has the edge in fees, so all else being equal, you should always go for the cheaper product.
Morningstar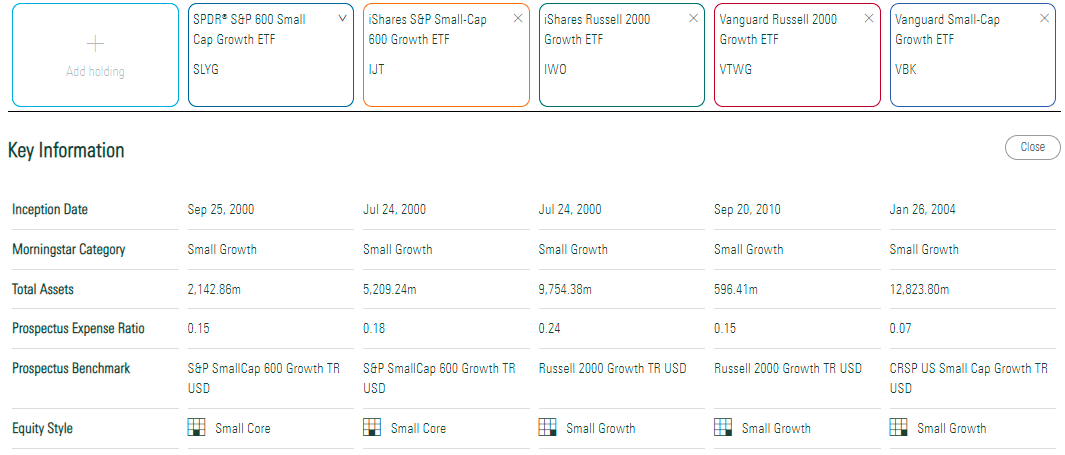
Of these five ETFs, VBK has the most exposure to Technology (26.06%) and Real Estate (8.95%) and slightly underweights all other sectors. VBK probably is one of the more aggressive small-cap growth ETFs.
Morningstar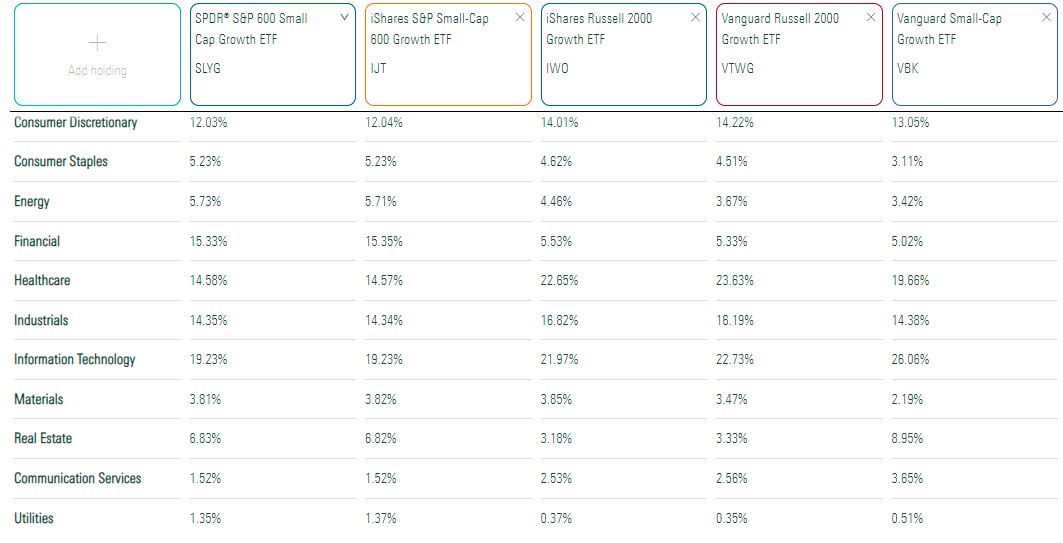
I was able to generate an additional four years’ worth of history for VBK by backfilling with the Vanguard Small Cap Growth Index Investor Shares (VISGX). The graph below highlights VBK’s potential, easily outpacing SLYG, IWO, and QQQ with less volatility and a lower maximum drawdown since November 2000.
Portfolio Visualizer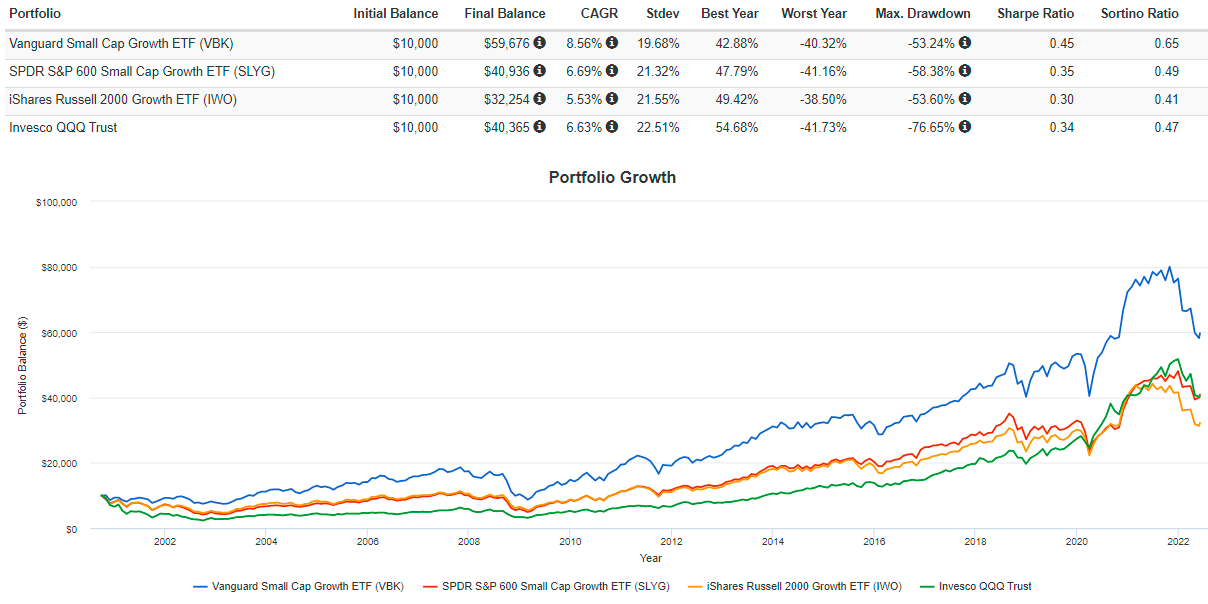
Still, given its many ups and downs, I don’t recommend blindly holding VBK over such a long time. Being strategic with your buys and sells is crucial. From this annualized rolling three-year return graph, it’s clear that VBK (the blue line) hasn’t meaningfully outperformed its peers since the early 2000s. Instead, it’s been large-cap growth stocks that have provided more growth and stability. It makes sense because, unlike 20 years ago, large-cap growth stocks are incredibly profitable. Although markets are often irrational, quality has a way of working its way into share prices eventually.
Portfolio Visualizer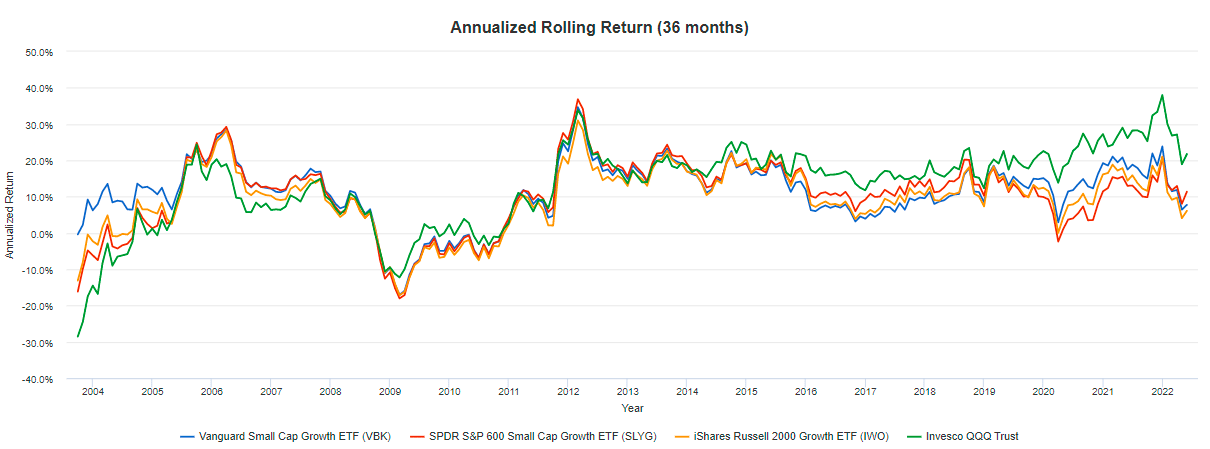
Profitability Is A Problem
I compiled dozens of fundamental metrics for nearly all of VBK’s 700 constituents, and I thought I’d provide you with some interesting highlights before diving deeper into the ETF.
1. 30% have negative trailing-twelve-months operating cash flow (15% of the total weight).
2. 82% don’t pay a dividend (71% of the total weight).
3. 58% have a negative annualized three-year EBITDA growth rate (40% of the total weight).
4. 27% have negative trailing-twelve-month EBITDA margins (18% of the total weight).
4. 37% reported negative earnings per share last quarter (23% of the total weight).
5. 34% are expected to report negative earnings per share next quarter (20% of the total weight).
6. 21% have a Seeking Alpha Profitability Grade of “D+” or worse (13% of the total weight).
Profitability is a problem, and I want readers to understand the challenges investors face when it comes time to calculating critical metrics like a forward price-earnings ratio. Since 34% of constituents (20% of the total weight) have negative expected earnings per share, you can’t compute their price-earnings ratios. Morningstar’s methodology document confirms their exclusion from the fund’s calculation.
Morningstar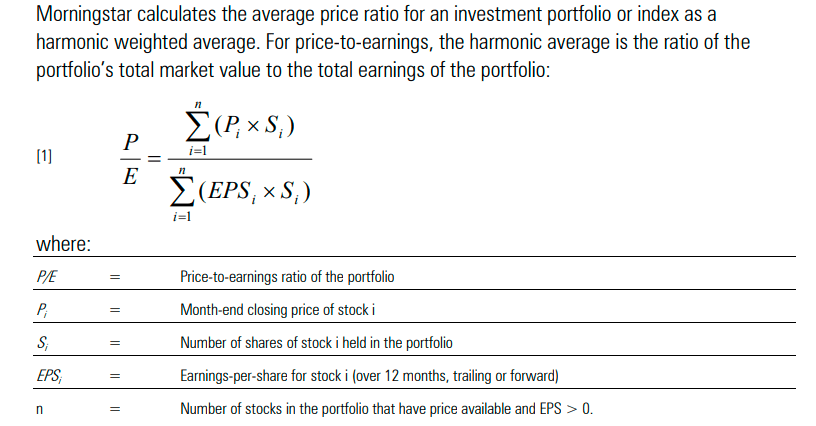
Morningstar also calculates price ratios using the harmonic average rather than the arithmetic average. Without going into the details, the result is always a lower value. Furthermore, a P/E ratio cap of 60 is placed on each constituent. While this is rarely an issue with value ETFs, 10% of VBK’s current holdings (9% of the total weight) exceed this limit. The result is that Morningstar and other third-party websites almost certainly understate VBK’s true valuation.
Fundamental Analysis
In my thesis, I suggested QQQ was a superior choice, and I hope that will be evident after assessing the table below. This table highlights selected fundamental metrics for VBK’s top 20 industries, with summary metrics for the entire fund and QQQ in the final rows. As you can see, both ETFs have similar revenue, EBITDA, and earnings per share growth, and even with the understating of VBK’s forward price-earnings ratio, QQQ is priced better. If you assigned Morningstar’s cap of 60 to the unprofitable companies, VBK’s forward price-earnings ratio would be 36.96.
The Sunday Investor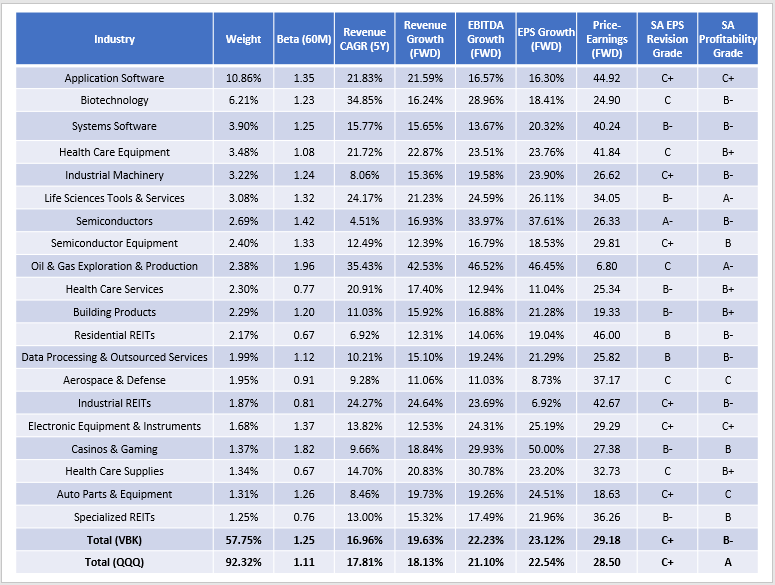
Application Software
Application software is VBK’s most prominent industry, with 73 companies combining for a 10.86% exposure. The primary issue here is that 58 have negative earnings margins and far too much debt, which will be devastating as interest rates rise. These companies have a weighted-average cash to total debt ratio of just 16.03%. For reference, QQQ’s application software stocks have a 60.93% cash to total debt ratio. They are in a far better position to withstand interest rate increases, and the icing on the cake is that they’re also trading at a cheaper valuation. While application software stocks in VBK have a 44.92 forward price-earnings ratio, QQQ’s are trading at 40.39x forward earnings. Add in the stronger Seeking Alpha Profitability Grade (A- vs. C+), and it’s an easy win for the large caps.
Biotechnology
Next up is small-cap biotechnology, one of the more speculative industries. Seventy-one biotechnology holdings in VBK combined to generate an operating cash flow loss of $1.89 billion over the last twelve months. Contrast that with the six in QQQ that generated positive operating cash flow of $46.98 billion, and the difference is night and day. It’s not a surprise or even a bad thing, but you should be clear on how much speculation you’re willing to do.
The big attraction is the possibility these companies will be acquired. M&A activity has picked back up in 2022, with 15 deals done YTD compared to 24, 29, 28, and 35 from 2018 to 2021.
BioPharma Dive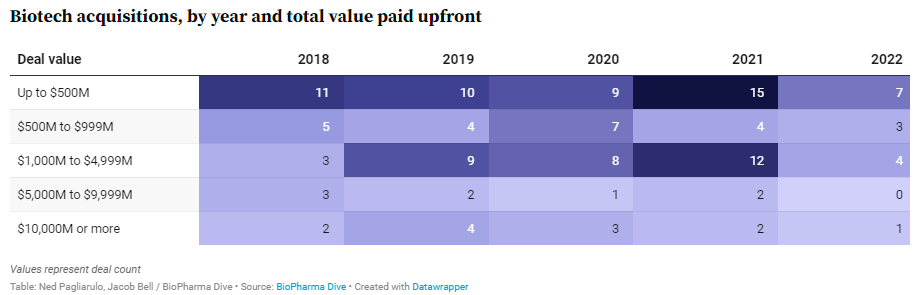
While this is good news for the industry, acquirers aren’t paying the same significant premiums as before. There were only three instances this year where the premium paid exceeded 100%, and only one of these had total consideration greater than $1 billion. That was the acquisition of Turning Point Therapeutics (TPTX) by Bristol-Myers Squibb (BMY) on June 3, 2022. In contrast, there were five such cases in 2019, highlighted by Sanofi buying Synthorx for $2.5 billion, or a 172% premium, to close the year.
BioPharma Dive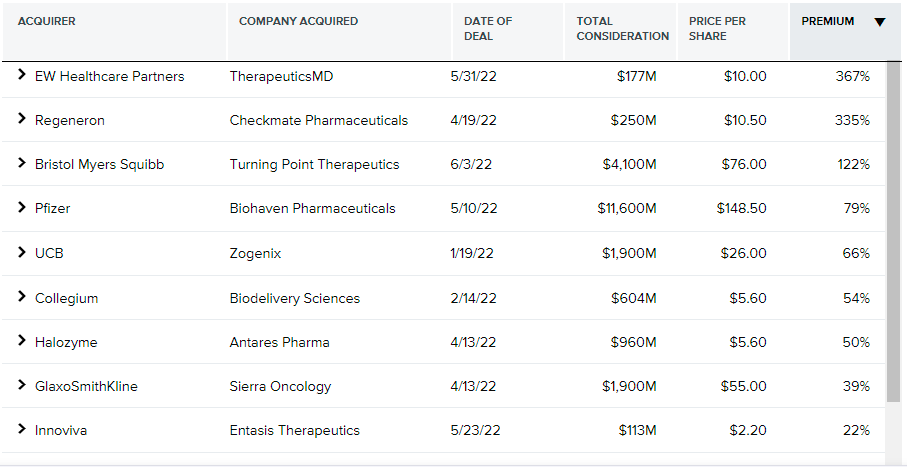
Can VBK Recover?
VBK has had some exceptional years throughout its history, producing returns above 30% in six since 2000.
- 2003: 42.88%
- 2009: 42.79%
- 2010: 30.95%
- 2013: 38.26%
- 2019: 32.75%
- 2020: 35.93%
All these years have something in common: sentiment was highly positive. Investors were less likely to be concerned with a company’s lack of profitability or high valuation and instead focused on the potential. The market wore rose-colored glasses, so to speak.
An easy way to see this is to plot the returns of value-weighted portfolios formed based on earnings yield, which is the inverse of the price-earnings ratio. The Ken French Data Library has this data recorded to 1952. Below is an annual summary since 2000, showing that in most of these years, returns for unprofitable companies climbed to unusual highs. Most recently, in 2020, returns were 79.49% compared to a 3.30% loss for the lowest 30% of stocks by P/E. It’s no wonder growth, particularly small-cap growth, had such a phenomenal year.
Chart Source: The Sunday Investor; Data Source: Ken French Data Library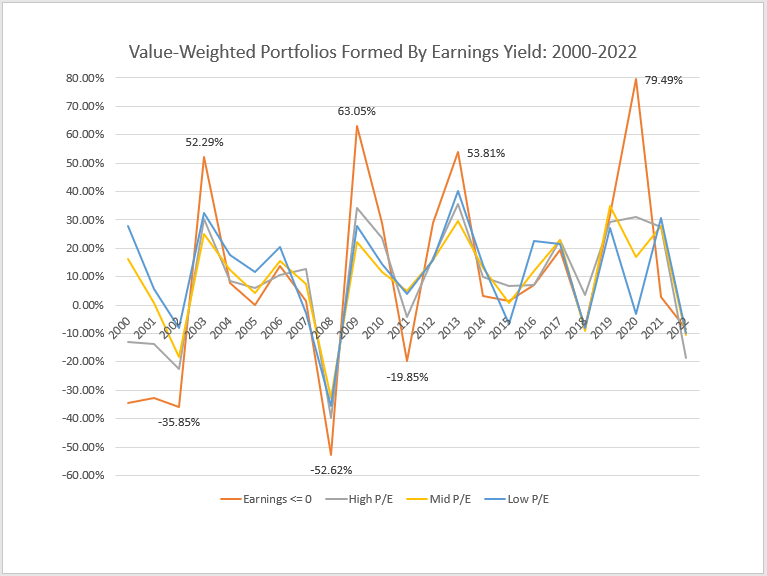
This graph also highlights the inevitable reversals. In 2003 after unprofitable stocks gained 52.59%, they gained only 7.83% in 2004, underperforming all other groups. Unprofitable companies had an excellent 2009, gaining 63.05%, but that fell to 28.97% in 2010 and finished with a 19.85% loss in 2011, 15% worse than the high P/E stocks you’d likely find in the Nasdaq-100 Index. 2013 saw unprofitable companies gain 53.81%, outpacing high P/E stocks by 18.28%. However, five consecutive years of underperformance followed before a slight beat in 2019.
For VBK to be worth the risk, you should have a good reason to believe unprofitable companies have bottomed. In my view, the data doesn’t support that. Unprofitable companies still managed a 2.82% gain in 2021 and are down just 8.25% in 2022 through April, ironically better than the 18.51% loss high P/E stocks registered. If anything, it’s the latter group that’s due for a rebound, and I recently argued my reasons for being optimistic about QQQ.
Investment Recommendation
VBK is a low-cost and efficient way to gain exposure to some of the most promising U.S. small-cap growth stocks. For more than 20 years, VBK has delivered some excellent returns, but it holds an excessive number of unprofitable companies that make it an extremely speculative ETF. For example, most of its application software stocks lost money over the last twelve months, and the premiums large-cap companies paid acquiring biotechnology stocks this year are substantially lower than pre-pandemic. With rising interest rates, this environment is not conducive for speculators.
Speculators will have their chance again, but I think it’s too early. Losses YTD are nowhere near where they were in the early 2000s, 2008, and even 2012. I advise you to wait for more downside in VBK before taking a position and focusing your buys on the highly profitable large-cap growth stocks in QQQ. Your downside risk is far less, but your upside may be just as large.
Enjoyed this article? Sign up for our newsletter to receive regular insights and stay connected.