
With the advent of the 2022 bear market, and the end of near 0% interest rates, “value” investing has become more popular – and more rewarding. The Vanguard Mega Cap Value ETF is a cost-efficient way for investors to gain exposure to the largest value stocks in the market. Being a value fund, MGV is by definition significantly more defensively positioned as compared to the broad market averages like the S&P 500 and Nasdaq 100.
MGV ETF: Cost-Efficient Vanguard Fund For Diversification
Since my first Seeking Alpha BUY rated article last July, the Vanguard Mega Cap Value ETF (NYSEARCA:MGV) is up 4.5% and has outperformed the S&P500 by almost 3%. Investors in the MGV ETF get low-cost (0.07%) and diversified exposure to the largest value stocks in the U.S. stock market. The fund has a strong long-term performance track record (a 10-year average annual total return of 11%+) because many of these mega-cap “value” companies also deliver growth and income as well. That being the case, investors who want to build a well-diversified portfolio built for the long-term, and one that can weather challenging markets (like the current one), should consider the relatively defensively positioned MGV ETF as a core portfolio holding.
Investment Thesis
My followers know I advise investors to build and maintain a well-diversified portfolio – and to hold it – through the market’s up-n-down cycles (strategically adding on down-cycles). The MGV Mega-cap Value is an excellent candidate to add cost-efficient and relatively defensive diversification to a portfolio that already has decent exposure to the broad market indexes like the S&P500, DJIA, and Nasdaq-100. Defensive sectors like HealthCare, Energy, and Financials typically outperform the broad market during times of inflation and higher interest rates. So, let’s take a closer look at the MGV ETF to see how it has positioned investors for success going forward.
Top-10 Holdings
The top-10 holdings in the MGV ETF are shown below and were not taken directly from the Vanguard MGV ETF homepage, where you can get additional information on the fund, but were taken by using the Vanguard Fund compare tool to show the differences in the MGV ETF as compared to the Vanguard S&P 500 ETF (VOO).
The top-10 holdings in the MGV ETF equate to 26.3% of what I consider to be a well-diversified portfolio of 145 companies:
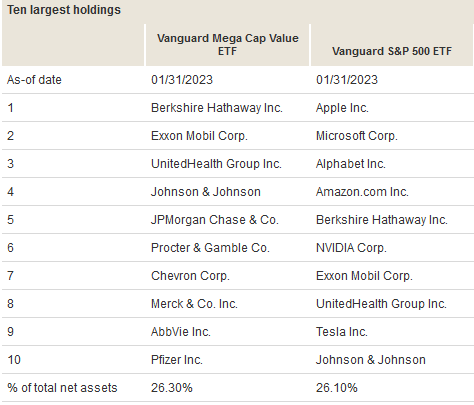
My first observation as to the differences between the MGV ETF versus the typical S&P500 fund is that the MGV portfolio holds only 145 total companies versus 500. That is, the MGV ETF is not only significantly more concentrated as compared to the typical S&P500 ETF, it is more concentrated in “value”.
Secondly, gone are the typical S&P500 fund’s top-3 holdings like Apple (AAPL), Microsoft (MSFT), and Alphabet (GOOG) – which are replaced in the MGV ETF by Berkshire Hathaway (BRK.B), Exxon Mobil (XOM), and UnitedHealth Group (UNH), respectively.
For the #1 holdings in the two funds, note that Berkshire currently trades with a forward P/E of 19x while Apple trades with a forward P/E of 25.2x.
For the #2 holdings in the two funds, Exxon has a forward P/E of only 10.4x and yields 3.23% while Microsoft currently has a forward P/E of 27.3x and yields 1.07% – indicating significantly more value (and arguably less long-term growth).
UnitedHealth Group, the #3 holding in the MGV ETF, trades with a forward P/E of 19.2x and yields 1.38%, while Google – in the S&P500 ETF – trades with a forward P/E of 18.4x but pays no dividend. This is one reason why Google should pay a dividend: with such a low forward P/E in comparison to its growth rate and free-cash-flow profile, even a modest dividend would likely put GOOG into the “value” category. This is why Google continues to be my favorite large-cap stock.
However, although GOOG is not in the MGV portfolio, my overall favorite technology stock, Broadcom (AVGO), is – it is the #13 holding with a 1.66% allocation. As I predicted in a Seeking Alpha article late last month, Broadcom significantly beat consensus earnings estimates last Thursday due to “urgent” demand for regenerative AI related products. AVGO stock was +$34.11/share (5.7%) Friday and with a $18.40/share annual dividend, yields 2.91%. Note Broadcom generated $3.9 billion in free-cash-flow in Q1 FY23, or an estimated $9.10/share.
With Exxon, Chevron (CVX), and Berkshire Hathaway in the top-10 holdings, the MGV ETF has strong exposure to the energy sector (and their dividends). I added Berkshire to that list because, as you likely already know, BRK owns $27.6 billion worth of Chevron stock (its #3 holding and 8.3% of the Berkshire portfolio of stocks) as well as $11.9 billion worth of Occidental Petroleum (OXY) (3.6% of the BRK portfolio).
Along with UNH, with the #8-10 holdings being big-pharma companies Merck (MRK), AbbVie (ABBV), and Pfizer (PFE), the health-care sector is well represented in the MGV ETF. These three companies are strong dividend payers and yield 2.73%, 3.79%, and 3.99%, respectively.
From a total portfolio perspective, the MGV ETF is defensively positioned with over-weight positions (as compared to the S&P500) in the HealthCare, Financials, Industrials, Consumer Staples, and Energy sectors:
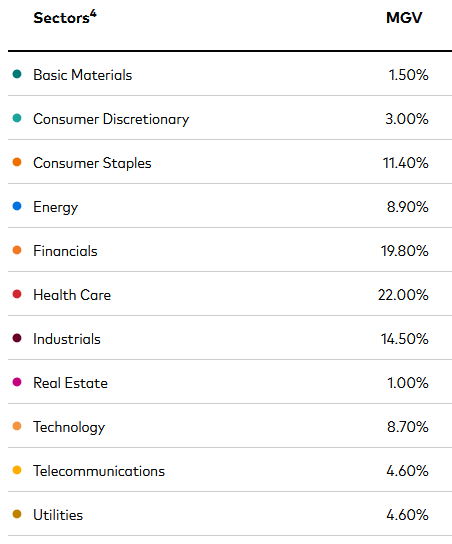
For example, the HealthCare sector currently represents 14.3% of the S&P500 while the energy sector equates to 4.9% of the index. These weights were taken by the representation in the S&P 500 by the SPDR S&P Healthcare ETF (XLV) and the SPDR S&P Energy ETF (XLE), respectively.
From a valuation perspective, the MGV ETF trades at a significant discount to the S&P500:
That being the case, clearly the MGV ETF gives investors significant diversification as compared to the S&P500 – and the value comparisons are even more favorable with respect to the Nasdaq-100.
Performance
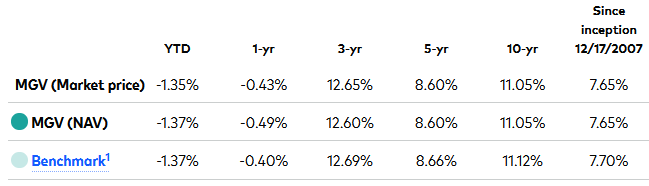
The chart below shows the long-term performance track-record of the MGV, and a very solid 10-year average annual return of 11.1%:
The following graphic compares the 5-year total returns of the MGV ETF with those of some of its peers, including the SPDR S&P Value ETF (SPYV), the Fidelity Value Factor ETF (FVAL), and the Vanguard Value ETF (Original Post>
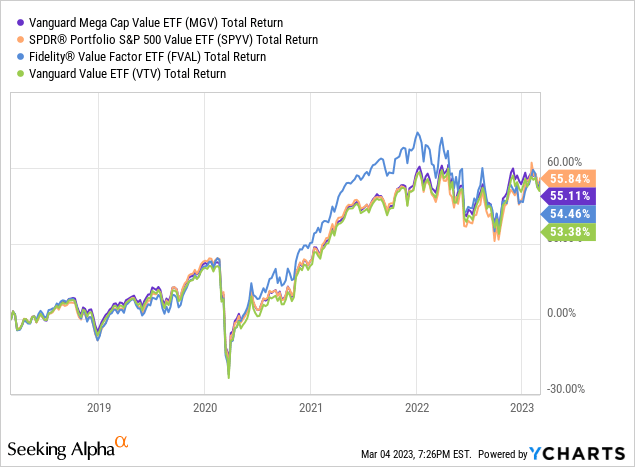
As can be seen in the chart, this is a pretty tight group for a 5-year comparison and the SPYV ETF won by a nose. Part of that might be because the SPYV ETF’s expense fee is 3 basis points lower than MGV (0.04%).
Risks
While the MGV ETF has outperformed the S&P500 over the past year, that could change if the interest rate outlook becomes more favorable for growth. Meantime, the companies in the MGV ETF are not immune from the headwinds of the global economy: high inflation – in part due to Putin’s horrific war-on-Ukraine that broke the global energy & food supply chains – higher interest rates, on-going trade tensions between the U.S. and China, and on-going challenges with respect to the global pandemic’s impact on global supply-chains (but these continue to recede).
While the current 30-day SEC yield of the MGV ETF is 2.48% is decent, note it does not compare with current fixed-income rates (anecdotally, I got a 5% 18-month CD last week).
Summary & Conclusion
I like the MGV ETF because it is a differentiator in my portfolio as compared to my holdings in the broad market averages ETFs (primarily VOO, DIA, and QQQ). Exposure to the relatively lower-valuation holdings in MGV appear to be prudent in the current environment. I reiterate my BUY on the MGV ETF, but suggest investors wanting to establish a position do so by averaging into the fund over time (perhaps as long as 3-6 months) in order to take advantage of market volatility. Perhaps chop-up your full-position allocation into tenths, and make a purchase every couple of weeks – while paying close attention to any potential market down-turns.
Enjoyed this article? Sign up for our newsletter to receive regular insights and stay connected.