
Clara Bastian
(This article was co-produced with Hoya Capital Real Estate)
Introduction
The best place to start is by defining what a “cash cow” stock is since that is the basis of the ETFs used by the Pacer Funds Trust- Pacer Cash Cows Fund of Funds ETF (NASDAQ:HERD). For that, I turned to Investopedia:
A cash cow is one of the four categories (quadrants) in the growth-share, BCG matrix that represents a product, product line, or company with a large market share within a mature industry. A cash cow is also a reference to a business, product, or asset that, once acquired and paid off, will produce consistent cash flows over its lifespan. Cash cows are part of mature, slow-growing industries, have a large chunk of the market share and require minimal investment to thrive.
Source: investopedia.com
The aim of Pacer Cash Cows ETFs is to provide capital appreciation by screening indices to identify quality companies with high free cash flow yield.
Why Cash Cows?
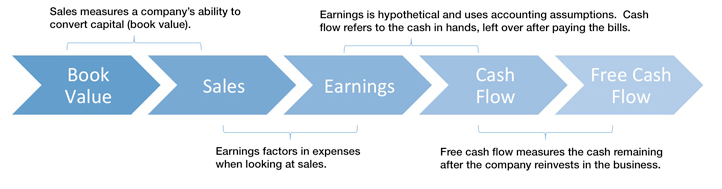
Pacer provides potential investors with why they believe Free Cash Flow Yield is a good Value measure to use. The following charts are pulled from that document: The Power of Free Cash Flow Yield
paceretfs.com: PFCFY PDF
paceretfs.com: PFCFY PDF
Companies without free cash flow will either need to borrow funds or restrict where the spend them; which could slow their growth down. The attributes and benefits Pacer sees for companies are outlined in the next chart they provided.
paceretfs.com: PFCFY PDF
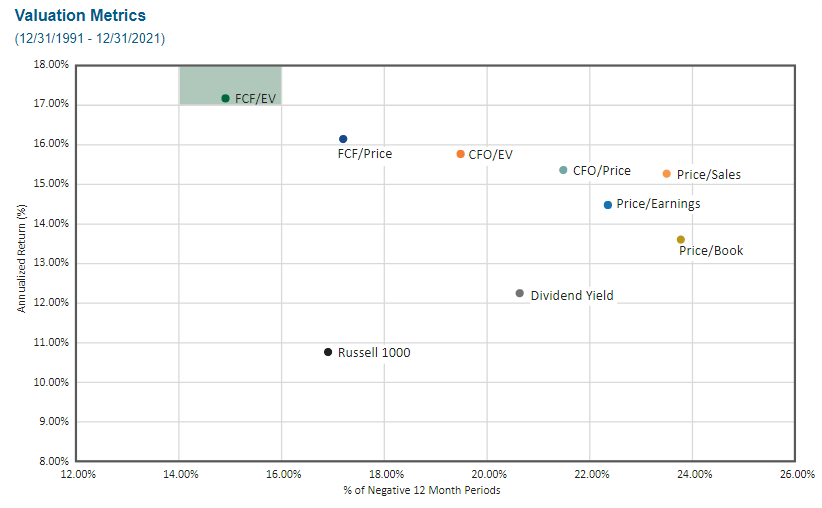
Finally, they showed this chart on how various Value measures have performed from 1992-2021.
paceretfs.com: PFCFY PDF
The measure used by the Pace Cash Cows ETFs has the highest return and the fewest negative 12-month periods.
Pacer Advisors described
Both the underlying index and the five “Cash Cow” ETFs used by the HERD ETF, are all designed and managed by Pacer Advisors or one of its affiliates. They describe their mission as:
Our mission is to provide our clients with long-term core investment strategies that follow a rules based discipline and have the potential to outperform certain benchmark indexes over various market cycles. We are dedicated in our commitment for continuous improvement in operational efficiency and the effectiveness of our investment process. Aligning our interests with our clients and providing exceptional client service is of the utmost importance to us.
Source: paceradvisors.com
Pacer Cash Cows Fund of Funds ETF review
Data by YCharts
Seeking Alpha describes this ETF as:
The Pacer Cash Cows Fund of Funds ETF is an exchange traded fund of fund launched and managed by Pacer Advisors Inc. The fund invests in funds which invests in public equity markets across the globe. It invests in funds which invest in stocks of companies operating across diversified sectors, excluding financial sector. The fund invests in funds which invest in stocks of companies across diversified market capitalization. It seeks to track the Pacer Cash Cows Fund of Funds Index. HERD started in 2019.
Source: seekingalpha.com HERD
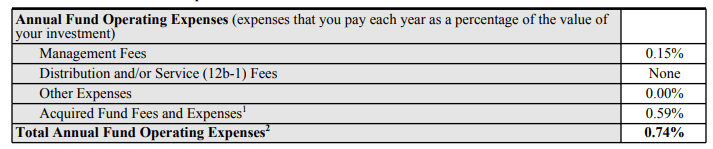
HERD has about $45m in AUM and provides a 2.4% yield. The 74bps in fees result from two costs:
Index review
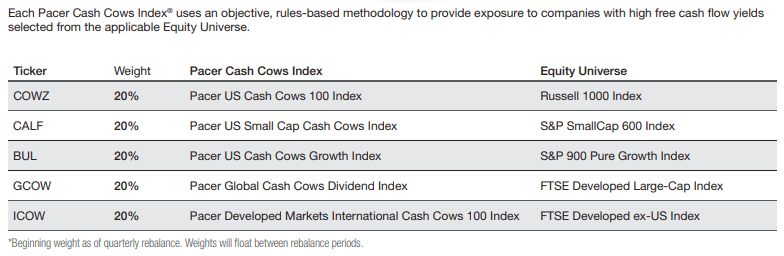
The Pacer Cash Cows Fund of Funds Index is simply an equal weight of each of the five other Pacer Cash Cows indices.
paceretfs.com/media/herd.pdf
HERD holdings review
The current allocation amongst the five ETFs and cash is as follows.
paceretfs.com HERD
The weights indicated how the underlying components have more relatively since the end of 2021 when the last rebalancing took place.
Morningstar shows the following Growth/Value and Market-Cap allocation of HERD.
morningstar.com Allocations
Here the country allocations are compared against the Morningstar Global Value Index.
morningstar.com Countries
Country weights differ little, except for China's underweighting, from the index used. As we will see later and shown here, sector allocations do differ widely from that index.
morningstart.com Sectors
Defensive stocks, which should hold up better if the world experiences a recession, total about 21% for HERD, or about 4% less than the index's allocation to that group.
Each of the five ETFs held will now be reviewed individually. All will follow the same pattern. Some are compared to an ETF that invests based on the equity universe that respective ETF can draw from. The others are compared to an index.
Pacer US Cash Cows 100 ETF (COWZ) review
Data by YCharts
Seeking Alpha describes this ETF as:
The investment seeks to track the total return performance, before fees and expenses, of the Pacer US Cash Cows 100 Index. The index uses an objective, rules-based methodology to provide exposure to large and mid-capitalization U.S. companies with high free cash flow yields. COWZ started in 2016.
Source: seekingalpha.com COWZ
COWZ has $12.5b in assets and has a 1.9% yield. The ETF has 49bps in fees.
Important Index rules include:
- The initial universe is screened based on the average consensus forward year free cash flows and earnings estimates. Companies with negative values are excluded. If no forward year estimated values are available, the company will be included.
- The remaining securities are ranked by their Free Cash flow yield: Trailing twelve month Free Cash Flow / Enterprise Value.
- The 100 securities with the highest values are selected.
- The 100 securities are weighted by their trailing TTM free cash flow. There is a 2% weight cap.
COWZ holdings review
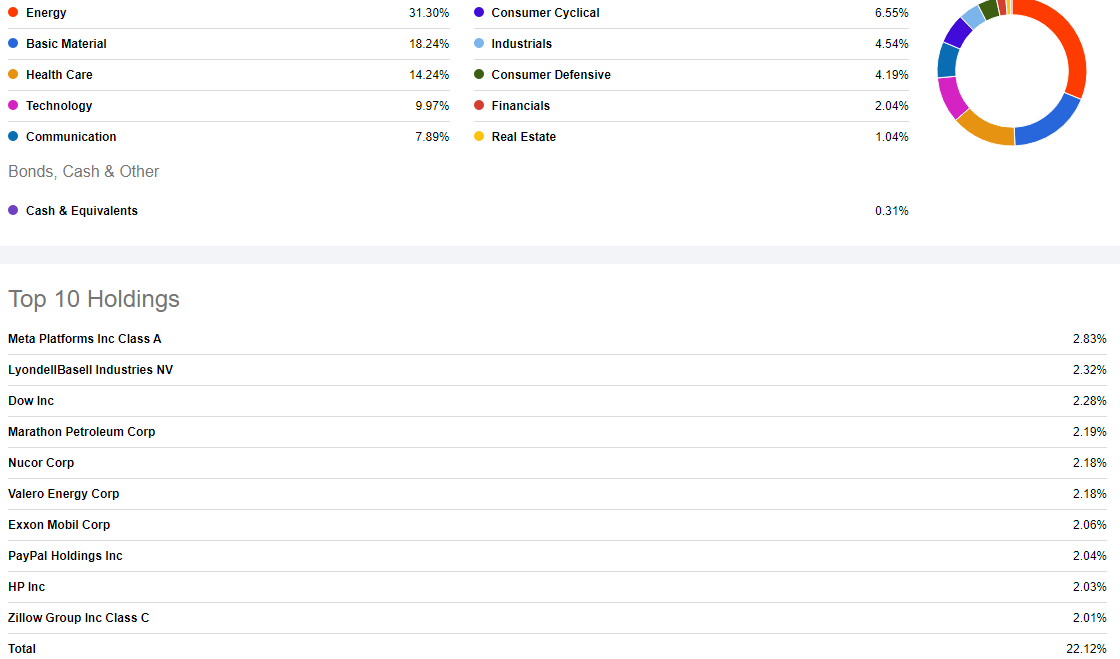
seekingalpha.com COWZ
COWZ is heavily-weighted toward Energy stocks currently, plus Basic Materials. If we get a recession, hopefully they won't be slow in changing that focus.
Pacer US Small Cap Cash Cows 100 ETF (CALF) review
Data by YCharts
Seeking Alpha describes this ETF as:
The investment seeks to track the total return performance, before fees and expenses, of the Pacer US Small Cap Cash Cows Index. The index uses an objective, rules-based methodology to provide exposure to small-capitalization U.S. companies with high free cash flow yields. CALF started in 2017.
Source: seekingalpha.com CALF
CALF has $1.9b in assets and has .8% yield. The ETF has 59bps in fees.
Important Index rules include:
- The initial universe is screened based on the average consensus forward year (FY1 and FY2) free cash flows and earnings estimates. Companies with negative values are excluded. If no forward year estimated values are available, the company will be included.
- The remaining securities are ranked by their Free Cash Flow yield: Trailing twelve month Free Cash Flow / Enterprise Value.
- The 100 securities with the highest values are selected.
- These 100 securities are then weighted by their trailing 12M Free Cash Flow. There is a 2% weight cap.
CALF holdings review
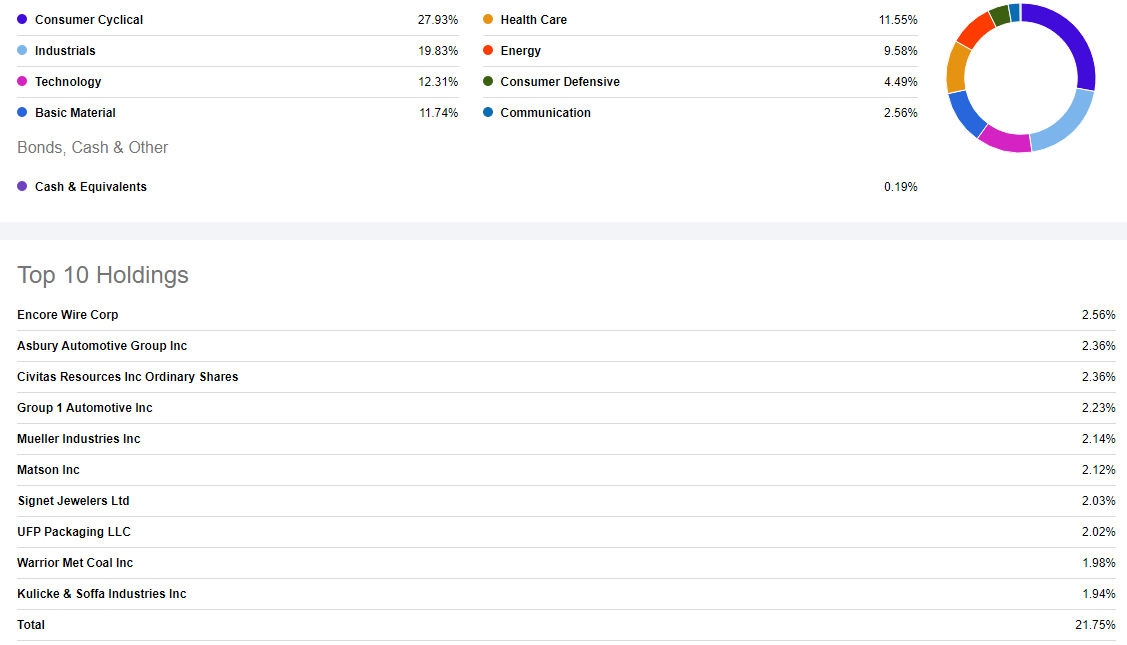
seekingalpha.com CALF
CALF's low weight in Energy helps lower HERD's overall allocation to that sector. That said, CALF's top sectors would all be negatively affected by a slowdown in the economy in the US.
Pacer US Cash Cows Growth ETF (BUL) review
Seeking Alpha describes this ETF as:
The investment seeks to track the total return performance, before fees and expenses, of the Pacer US Cash Cows Growth Index. The index uses an objective, rules-based methodology to provide exposure to mid- and large-capitalization U.S. companies with high free cash flow yields. BUL started in 2019.
Source: seekingalpha.com BUL
BUL has $40m in assets and has a .7% yield. The ETF has 60bps in fees.
Important Index rules include:
- The initial universe is screened based on the average consensus forward year (FY1 and FY2) free cash flows and earnings estimates. Companies with negative values are excluded. If no forward year estimated values are available, the company will be included.
- The remaining securities are ranked by their Free Cash Flow yield: Trailing twelve month Free Cash Flow / Enterprise Value.
- The 50 securities with the highest values are selected.
- These 50 securities are then weighted by their current Market Cap. There is a 5% weight cap.
BUL holdings review
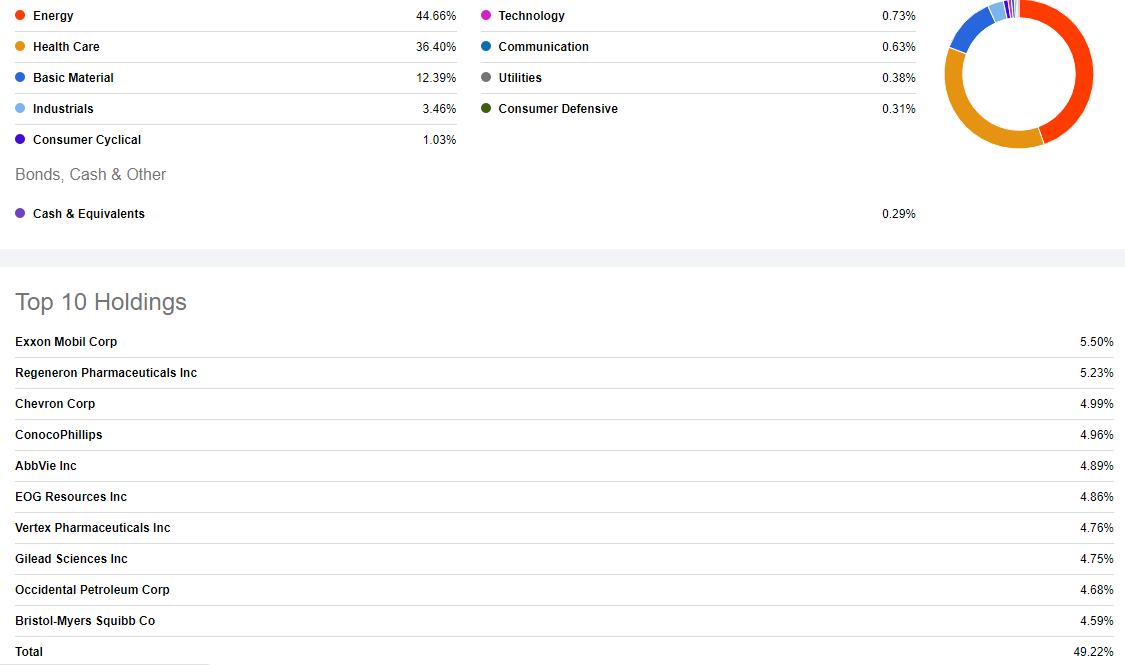
seekingalpha.com BUL
Over 80% of the portfolio allocation in the 53 stocks held by BUL are in Energy or Health Care, with Basic Materials pushing that allocation to more than 90% of the portfolio. The Top 10 stocks are also just short of 50% of the portfolio, a very concentrated strategy to say the least.
Pacer Global Cash Cows Dividend ETF (GCOW) review
Data by YCharts
Seeking Alpha describes this ETF as:
The investment seeks to track the total return performance, before fees and expenses, of the Pacer Global Cash Cows Dividend Index. The index uses an objective, rules-based methodology to provide exposure to global companies with high dividend yields backed by a high free cash flow yield. GCOW started in 2016.
Source: seekingalpha.com GCOW
GCOW has $1.35b in assets and has a 4.2% yield. The ETF has 60bps in fees.
Important Index rules include:
- The initial universe is screened based on the average consensus forward year (FY1 and FY2) free cash flows and earnings estimates. Companies with negative values are excluded. If no forward year estimated values are available, the company will be included.
- The remaining securities are ranked by their Free Cash flow yield: Trailing twelve month Free Cash Flow / Enterprise Value.
- The 300 securities with the highest values are selected. These are ranked by their dividend yield: Trailing twelve month dividend per share / price.
- The 100 securities with the highest values are selected. There is a 2% weight cap.
GCOW holdings review
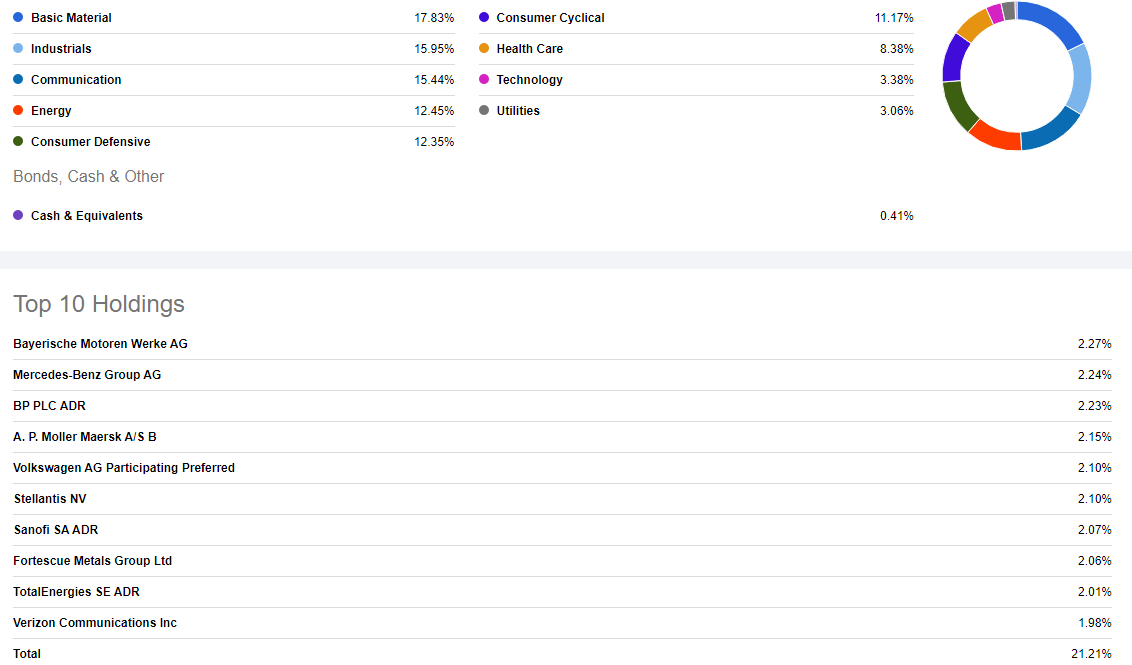
seekingalpha.com GCOW
Sector allocations are more balanced in GCOW, with six having weights between 11-18%. With a Top 10 weight of 21%, that is more aligned with the first two reviewed ETF levels, not BUL's.
Pacer Developed Markets International Cash Cows 100 ETF (ICOW) review
Data by YCharts
Seeking Alpha describes this ETF as:
The investment seeks to track the total return performance, before fees and expenses, of the Pacer Developed Markets International Cash Cows 100 Index. The investment seeks to track the total return performance, before fees and expenses, of the Pacer Developed Markets International Cash Cows 100 Index. The index uses an objective, rules-based methodology to provide exposure to large and mid-capitalization non-U.S. companies in developed markets with high free cash flow yields. ICOW started in 2017.
Source: seekingalpha.com ICOW
ICOW has $342min assets and has a 4.9% yield. The ETF has 65bps in fees.
Important Index rules include:
- The initial universe is screened based on the average consensus forward year (FY1 and FY2)1 free cash flows and earnings estimates. Companies with negative values are excluded. If no forward year estimated values are available, the company will be included.
- The remaining securities are ranked by their Free Cash Flow yield: Trailing twelve month Free Cash Flow / Enterprise Value. The 100 securities with the highest values are selected.
- These 100 securities are then weighted by their trailing 12M Free Cash Flow. There is a 2% weight cap.
ICOW holdings review
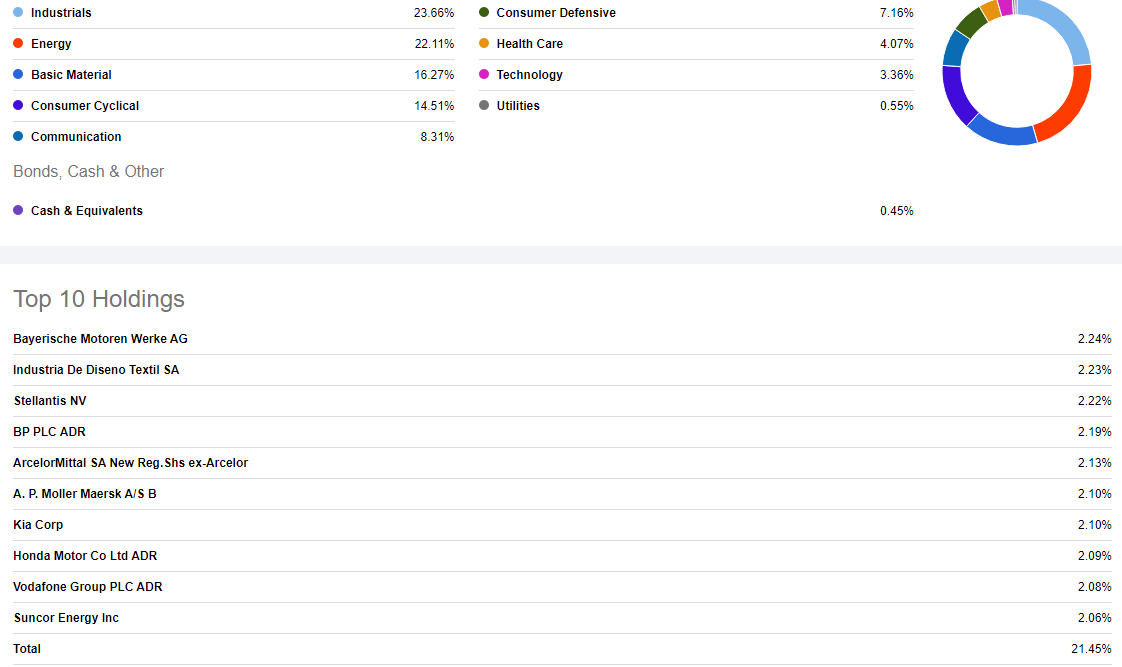
seekingalpha.com ICOW
The only pure international ETF in HERD shows sector allocations also dependent on the world economy staying strong.
Comparing results
Here I will compare each ETF against another ETF or index. For HERD, I chose to use the iShares MSCI ACWI ETF (ACWI).
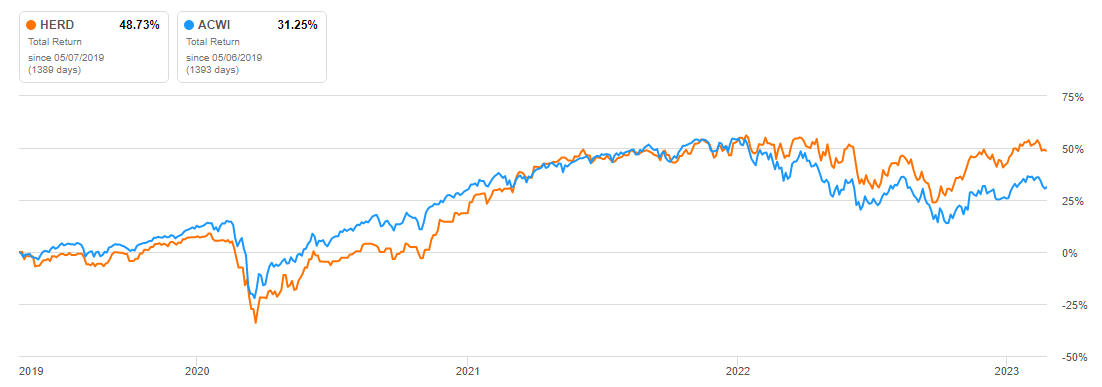
seekingalpha.com HERD charting
Since it started, HERD has provided a better return than the ACWI ETF. Though HERD shows a higher StdDev, its Sharpe and Sortino ratios are still superior.
For COWZ, I found the iShares Russell 1000 ETF (IWB). Recent outperformance has COWZ ahead since it started in late 2016.
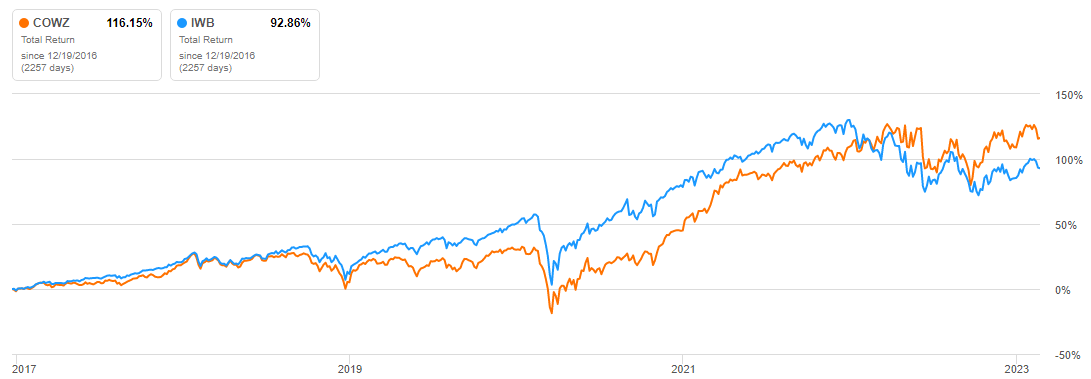
seekingalpha.com COWZ charting
COWZ shows more risk than IWB, as measured by StdDev and the risk ratios only slightly favor COWZ.
For CALF, I chose the iShares Core S&P Small-Cap ETF (IJR).
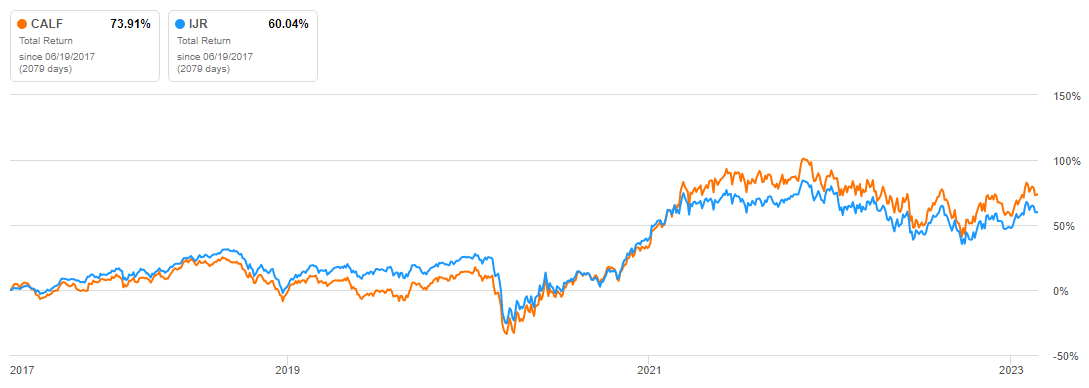
seekingalpha.com CALF charting
Like COWZ, its large US counterpart, CALF went from lagging to passing the comparison ETF in recent years. Like the others, CALF shows a higher StdDev and here the risk ratios split as to which is better, but both are close.
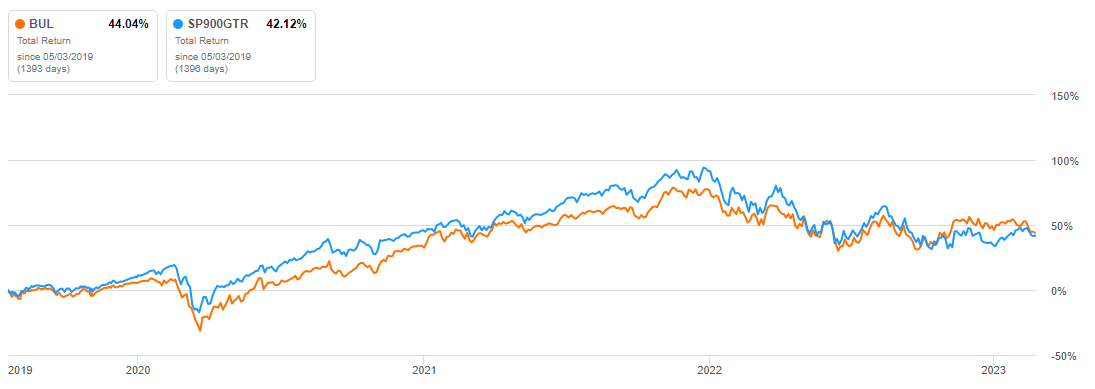
seekingalpha.com BUL charting
I did not find an ETF based on the S&P 900 Pure Growth index, but did find the index itself, which shows the BUL ETF has provided little extra return.
For the GCOW ETF, I found no comparable ETF, but the manager provided this data.
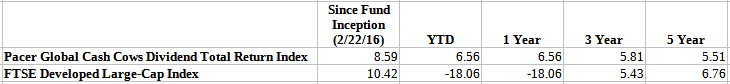
paceretfs.com GCOW
Thanks to the past year, GCOW is looking better but still lags its index since inception by over 200bps.
The ICOW has a good match in the Vanguard FTSE Developed Markets ETF (VEA). While ahead now, like the others, that has been due to recent performance.
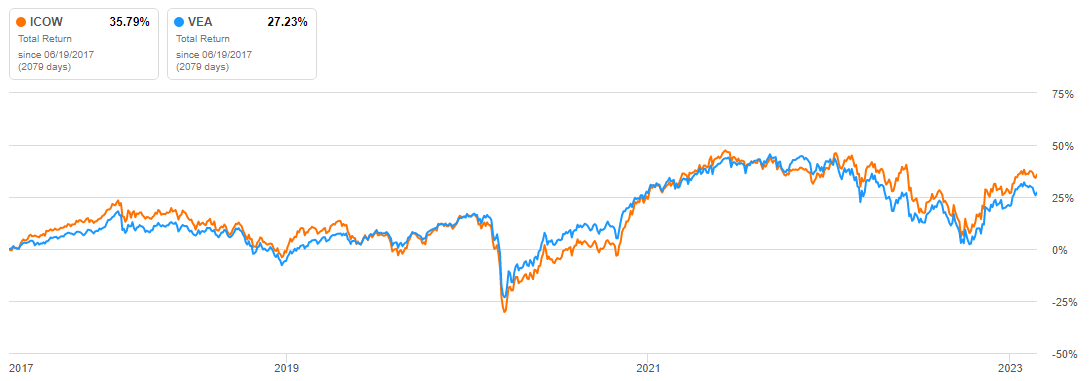
seekingalpha.com ICOW charting
Once again, the Cash Cow ETF has the higher StdDev and this time, slightly better risk ratios.
Here is how all the ETFs, plus ACWI have done since 2019, when the last ETF started.
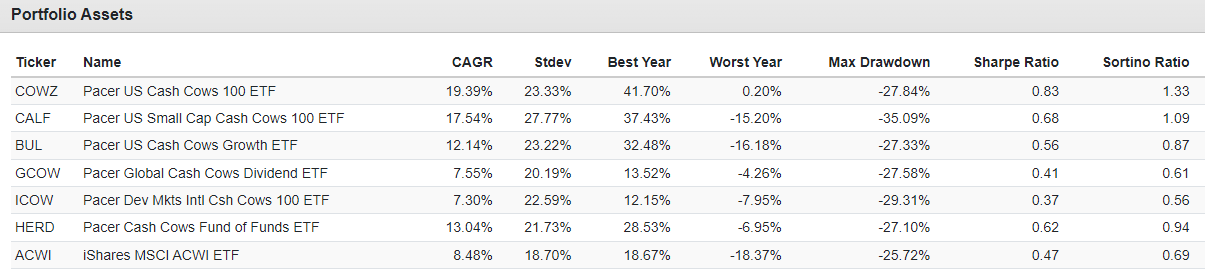
portfoliovisualizer.com
As expected, based on how US/INTL stocks in general have performed, the US-based ETFs have the best results.
One tool I would use in doing due diligence is using an investment site that lets you compare two ETFs against each other based on their holdings. I did that for some of the above pairs and they showed wide sector weighting differences between the Cash Cow and standard ETF.
Portfolio strategy
Exchange-Traded-Funds are an important part of the investment universe, especially for individual investors. Latest data shows almost 1800 ETFs trade in the US, with trading volume for the 4th quarter topping $53b, highest on record. ETFs are a small, but growing part of the market.
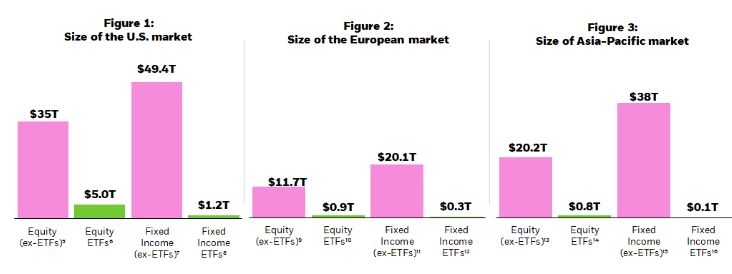
ishares.com ETF facts
While it seems ETFs are a minor part of the US equities market, when you discount the 75-80% held by institutions, ETFs account for a large percentage of what is held by other investors.; plus some of that institutional money is invested in ETFs.
A growing phenomenon in ETFs, are ETFs like HERD, a subset known as funds-of-funds. Like HERD, many hold other ETFs from the same manager, offering investors a simplified means to diversify their portfolio.
Final thoughts
The Pacer CEO posted a commentary why they believe their Cash Cow ETFs are well positioned for the earnings recession they see developing. For investors not wanting to do their own “cash Cow” allocations, the HERD ETF has done well when compared to the ACWI ETF.