
The US economy has been mired in a slowdown for well over a year, which has caused a significant amount of fatigue among investors, forecasters, and policymakers.
The fallout from the pandemic and the enormous stimulus measures created abnormal behavior across various parts of the economy.
The economy follows a repeatable sequence that has held true across nearly every economic cycle over the last 50 years. The current economic cycle is following the same pattern, but the lead time of traditional recession warnings has reached historic extremes.
Many investors and policymakers, with dwindling patience, are starting to feel that extremely long lead times could mean that “this time is different” and the economy can evade a recession despite reliable signals.
In this post, we’ll look at the typical recessionary sequence by studying the patterns of the Leading Economy, the Cyclical Economy, and the Total Economy.
We’ll also analyze the historical lead and lag times of a developing recession, address the few false recessionary signals that exist, and offer some thoughts on how business cycles impact different investors.
Leading Economy, Cyclical Economy & Total Economy
When economic data is released, the information should be contextualized based on where the data point falls in the economic cycle sequence.
We can separate the economy into three buckets: the Leading Economy, the Cyclical Economy, and the Total Economy.
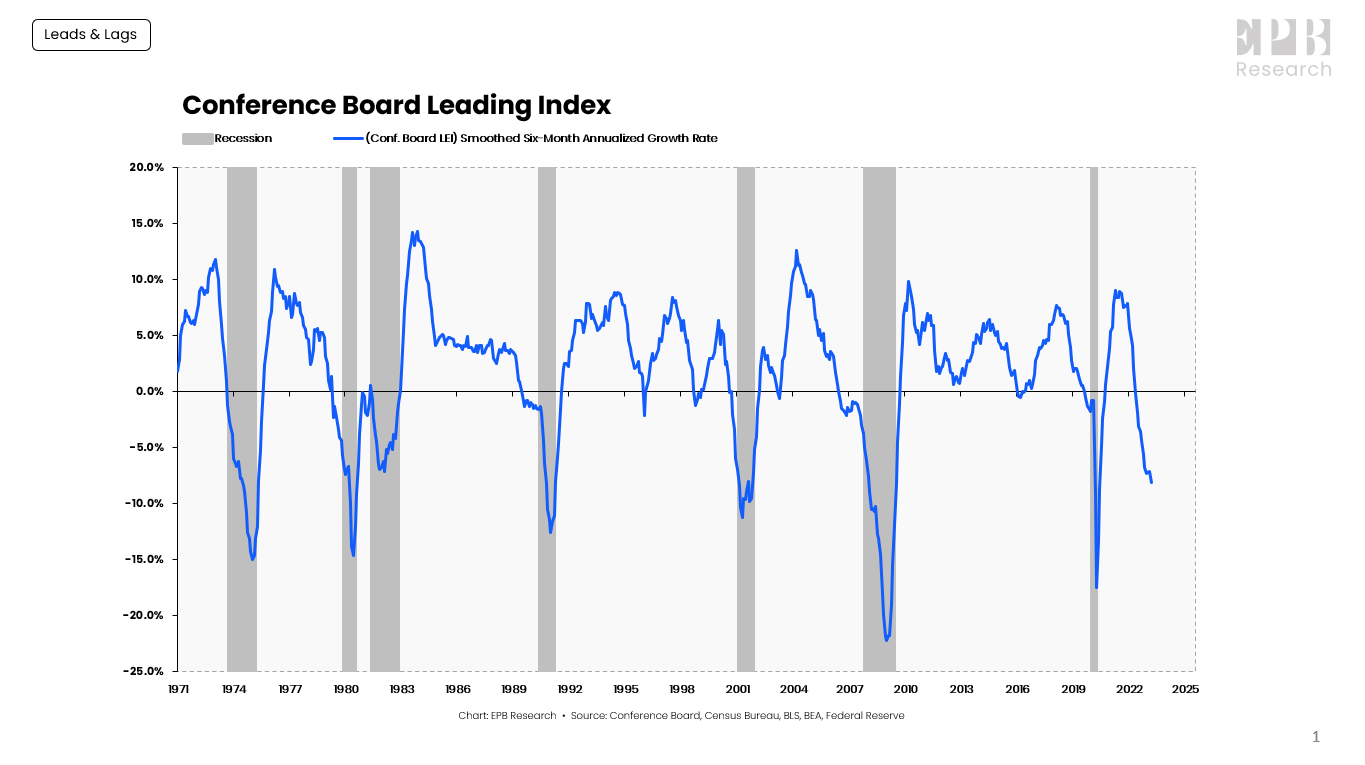
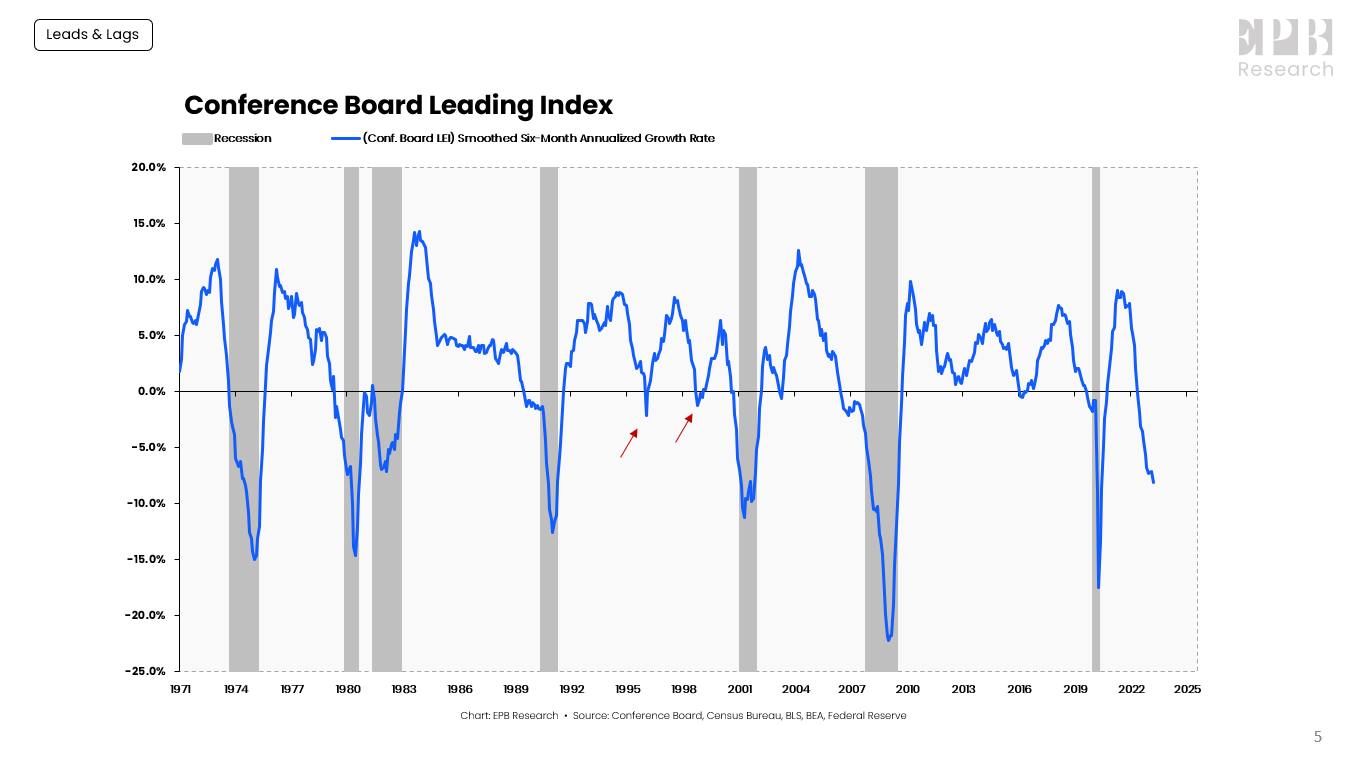
The Leading Economy is defined by the Conference Board Leading Index, which is a basket of ten leading economic variables such as building permits, new orders, and stock prices.
The Leading Index has turned negative before every recession, without exception.
Conference Board, Census Bureau, BLS, BEA, Federal Reserve
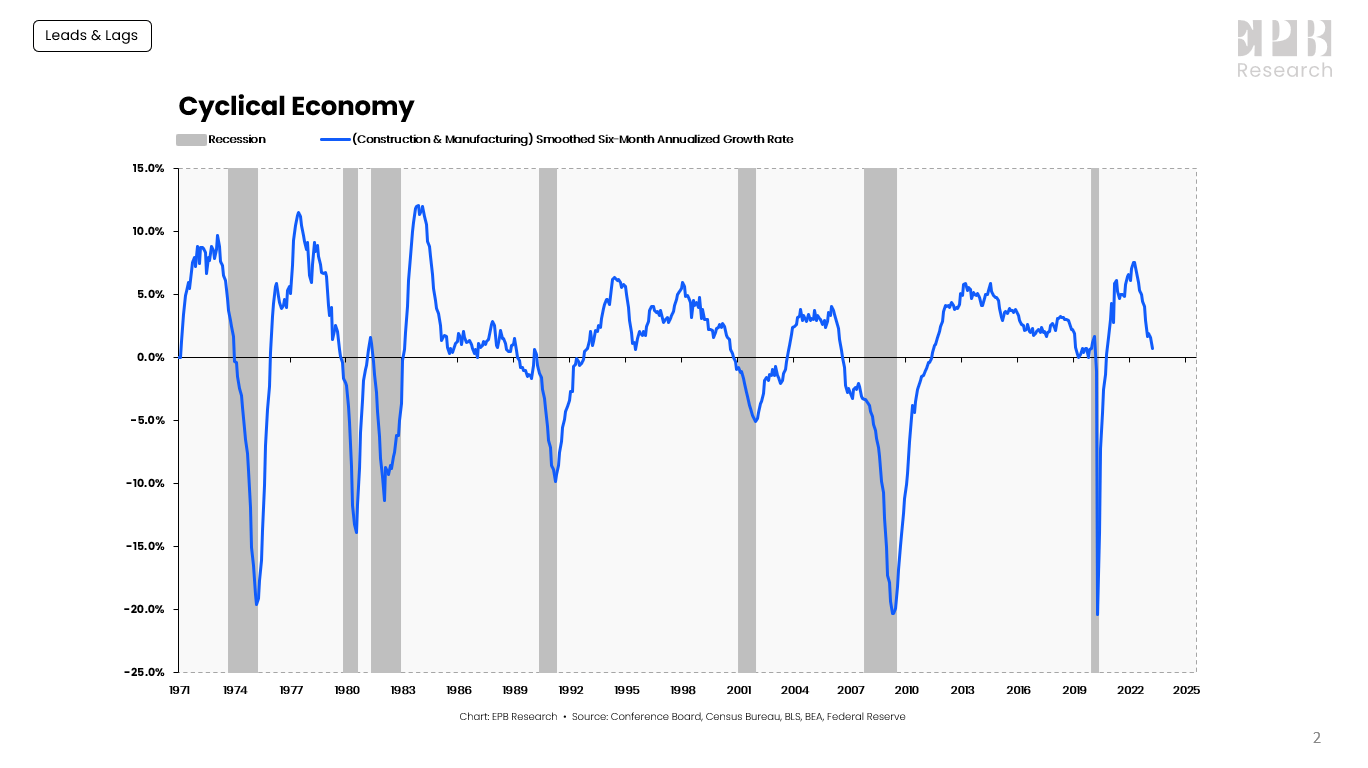
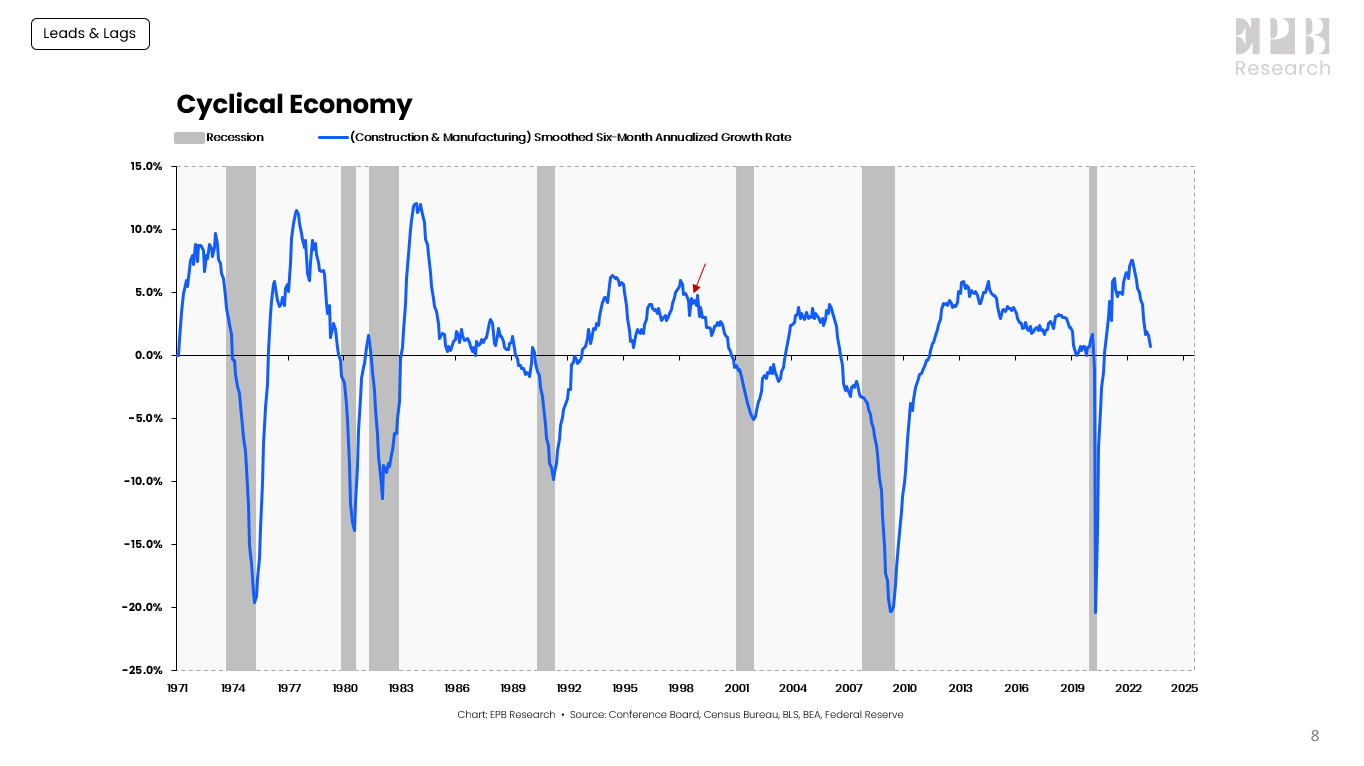
The Cyclical Economy represents the construction and manufacturing sectors. The Cyclical Economy is the driving force behind recessions, always turning negative before the Total Economy, and never giving a false signal; when the Cyclical Economy turns negative, the Total Economy turns negative several months later.
Conference Board, Census Bureau, BLS, BEA, Federal Reserve
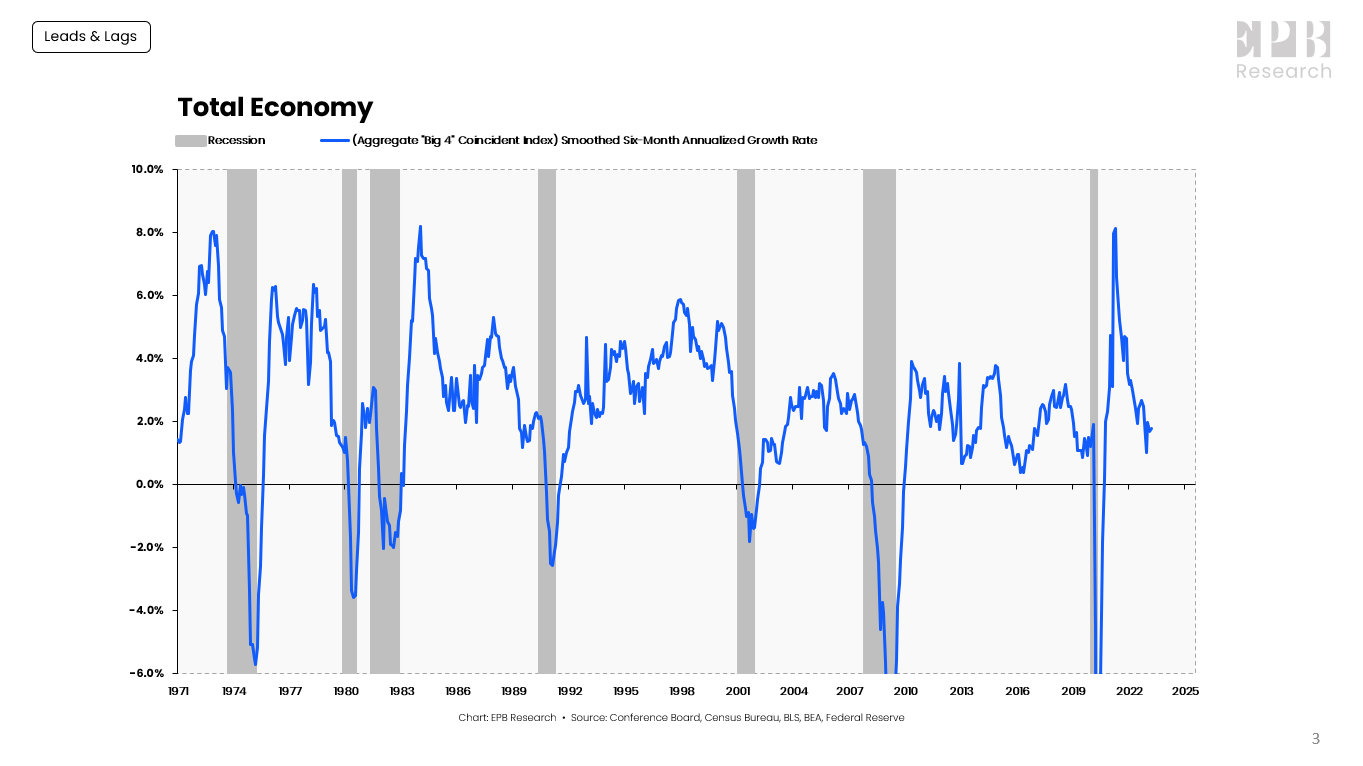
The Total Economy is defined by the “Big-4” Coincident Indicators of economic activity. Nonfarm payrolls, real personal income less transfer payments, real personal consumption, and industrial production are four major economic indicators that the NBER uses as the core of their recession dating procedure.
Conference Board, Census Bureau, BLS, BEA, Federal Reserve
A sustained contraction in the “Big-4” Coincident Indicators is the definition of a recession.
The Total Economy starts showing contracting growth rates about four months into the recession.
Historical Leads & Lags
The Leading Economy, Cyclical Economy, and Total Economy move in a sequence.
The Leading Economy moves into recession, then the Cyclical Economy moves into recession, and then the Total Economy moves into recession.
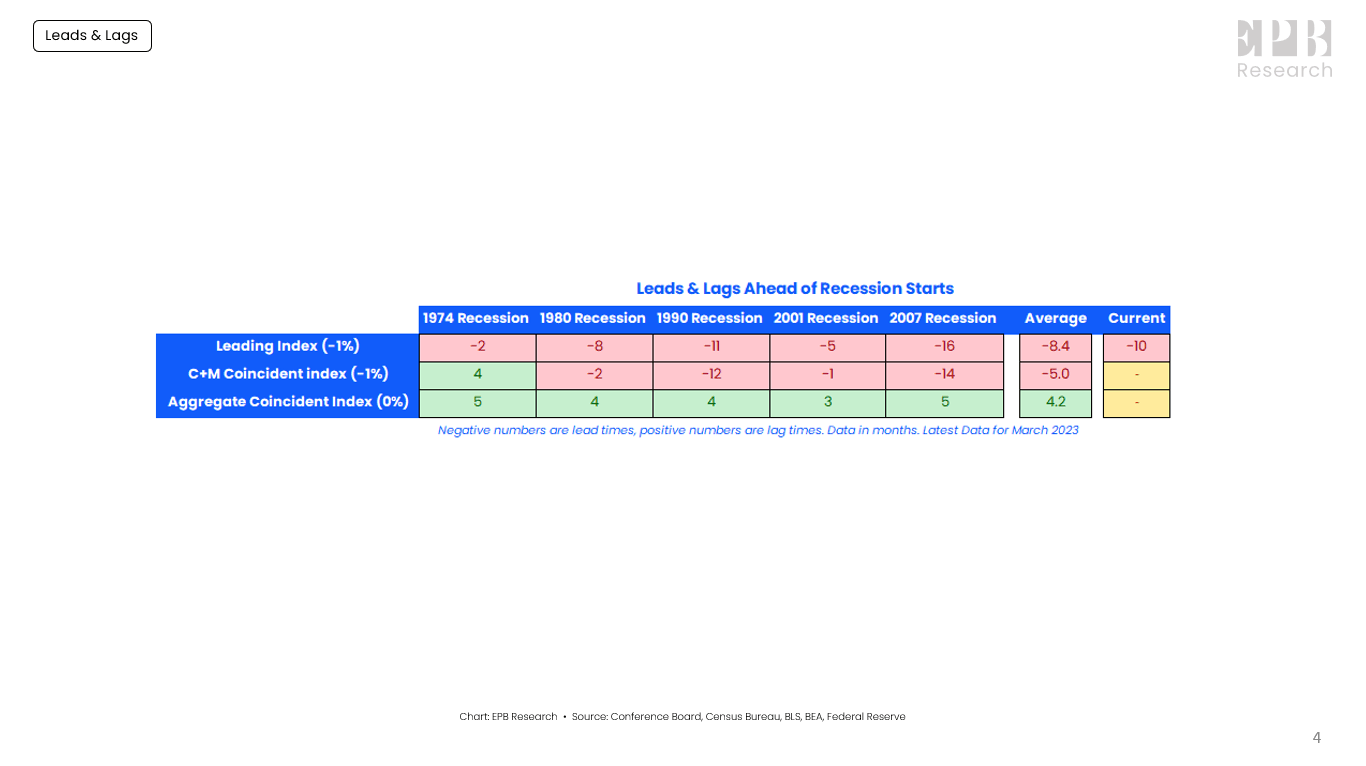
When the Leading Index falls below -1%, a recession reliably follows within 8.4 months, on average. The average is 8 months, but the range of outcomes is wide, with the shortest lead time ahead of the 1974 recession (2 months), and the longest lead time ahead of the 2008 Recession (16 months).
Conference Board, Census Bureau, BLS, BEA, Federal Reserve
Shortly after the Leading Economy moves into recession (<-1%), the Cyclical Economy normally moves into recession just a few months later. The Cyclical Economy moves into recession an average of 5 months before Total Economy recessions, on average, but the range is variable with the shortest lead time ahead of the 1974 recession (4-month lag) and the longest lead time ahead of the 2008 recession (14 months).
If the Leading Economy and the Cyclical Economy are both in recession (<-1%), the Total Economy will experience a recession without exception. The lag times are again variable.
The Total Economy moves into recession (<0%) about four months after the recession actually starts.
False Signals
When the Leading Index falls below -1%, a recession is on the way. Two exceptions exist to that rule, but both instances can be easily negated.
In January 1996, the Leading Index fell to a growth rate of -2.2%.
Conference Board, Census Bureau, BLS, BEA, Federal Reserve
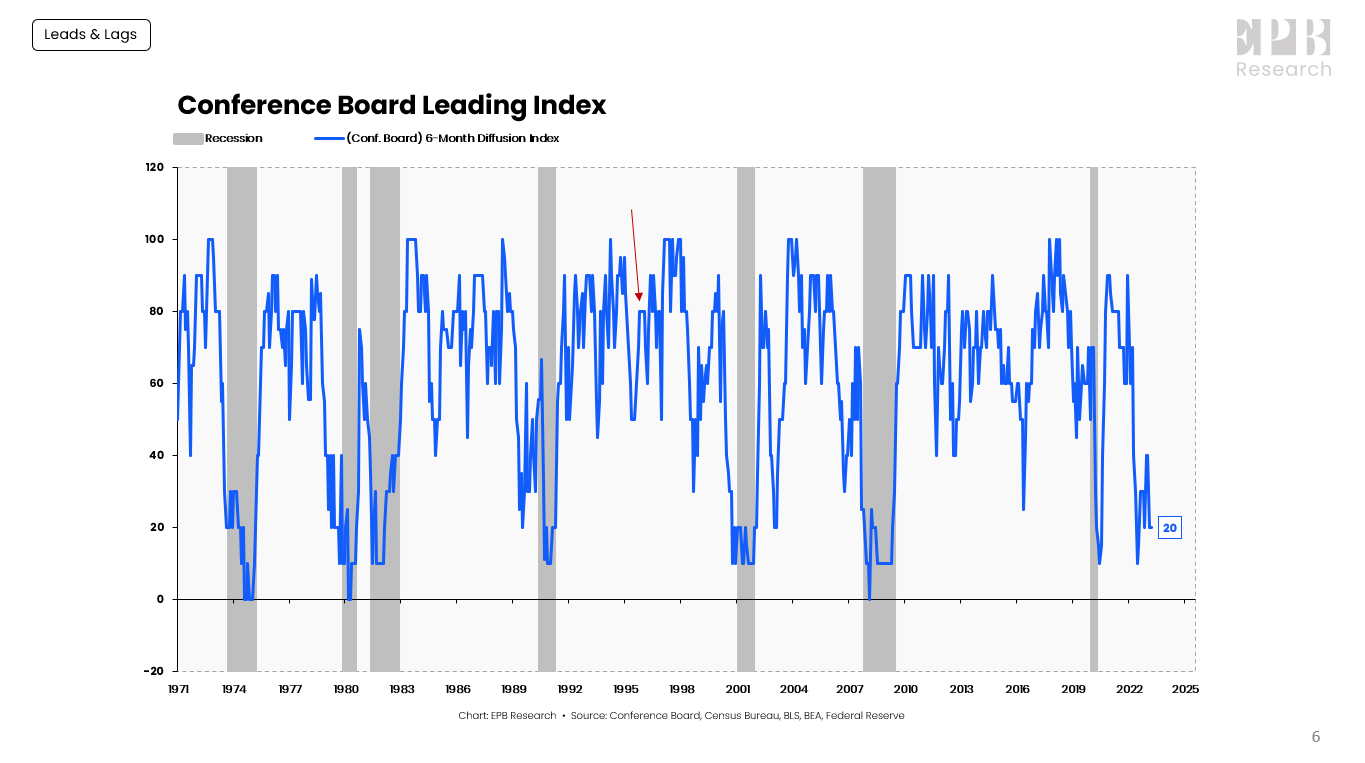
When looking for recessionary periods, the Conference Board and the NBER look for three criteria: depth, duration, and diffusion.
In other words: How Deep? How Long? How Widespread?
Recessions always satisfy all three. Recessions come with contractions in economic activity that last more than a few months that impact many sectors of the economy.
This expert is from the NBER Business Cycle Dating Procedure:
“The NBER’s definition emphasizes that a recession involves a significant decline in economic activity that is spread across the economy and lasts more than a few months…
…Because a recession must influence the economy broadly and not be confined to one sector, the committee emphasizes economy-wide measures of economic activity.”
When the Leading Index contracted in January 1996, the diffusion index showed that 80% of the components were increasing.
Conference Board, Census Bureau, BLS, BEA, Federal Reserve
At the average recession start, 30% of the components are increasing while 70% are contracting, meeting the criteria of “widespread.”
Conference Board, Census Bureau, BLS, BEA, Federal Reserve
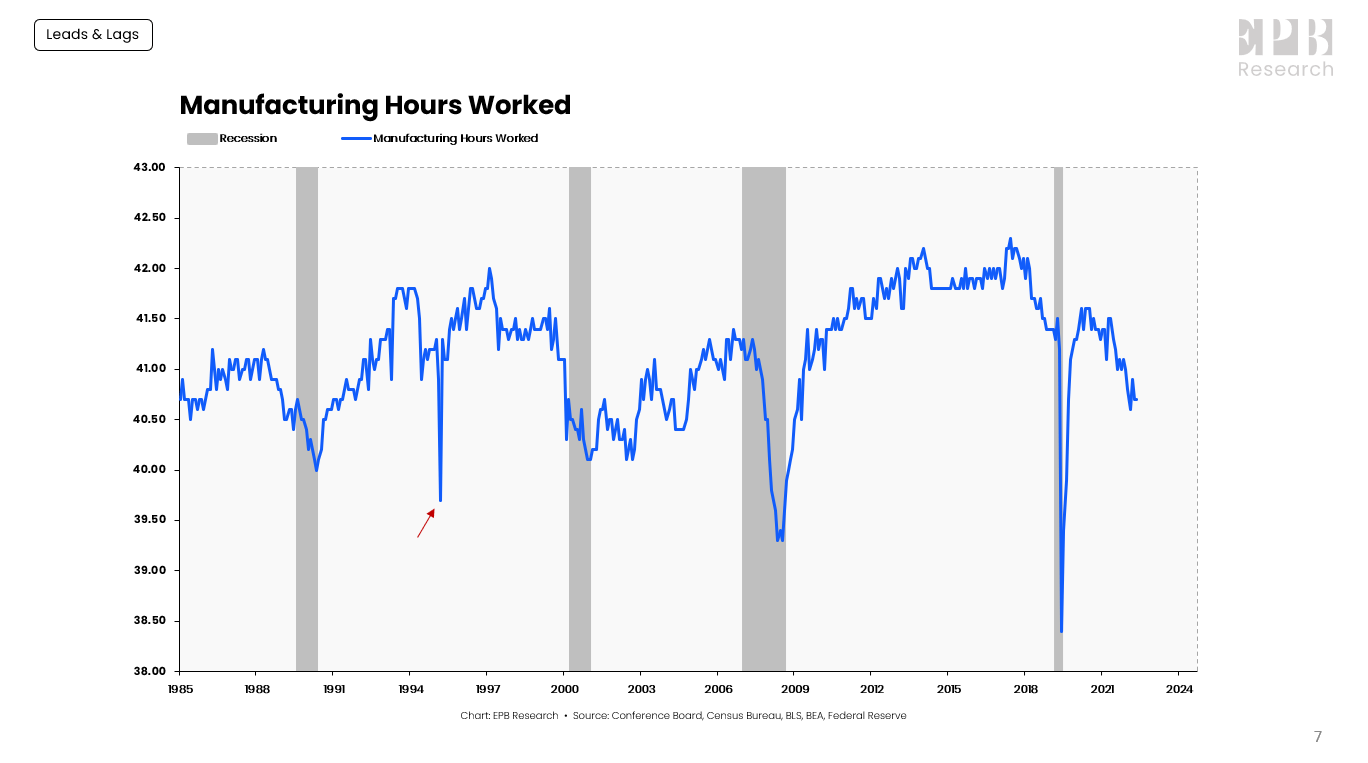
Further review shows the decline was related to a sharp drop in manufacturing weekly hours, clearly an abnormal reading and not part of a cyclical trend.
When the Leading Index contracted in 1998, about 50% of the components were rising. This signal can be negated because, at that time, the Cyclical Economy was growing at a 4.8% annualized pace.
Conference Board, Census Bureau, BLS, BEA, Federal Reserve
As noted in a recent post titled “Three Sequential Signals of Recession,” a true recession signal is when the Leading Index falls below -1% while the Cyclical Economy and Total Economy are growing below 2%.
So the Cyclical Economy was too strong in 1998, and then the Leading Index recovered quickly, rising above +1%, officially negating the recession flag.
Today’s Lag
What’s going on today?
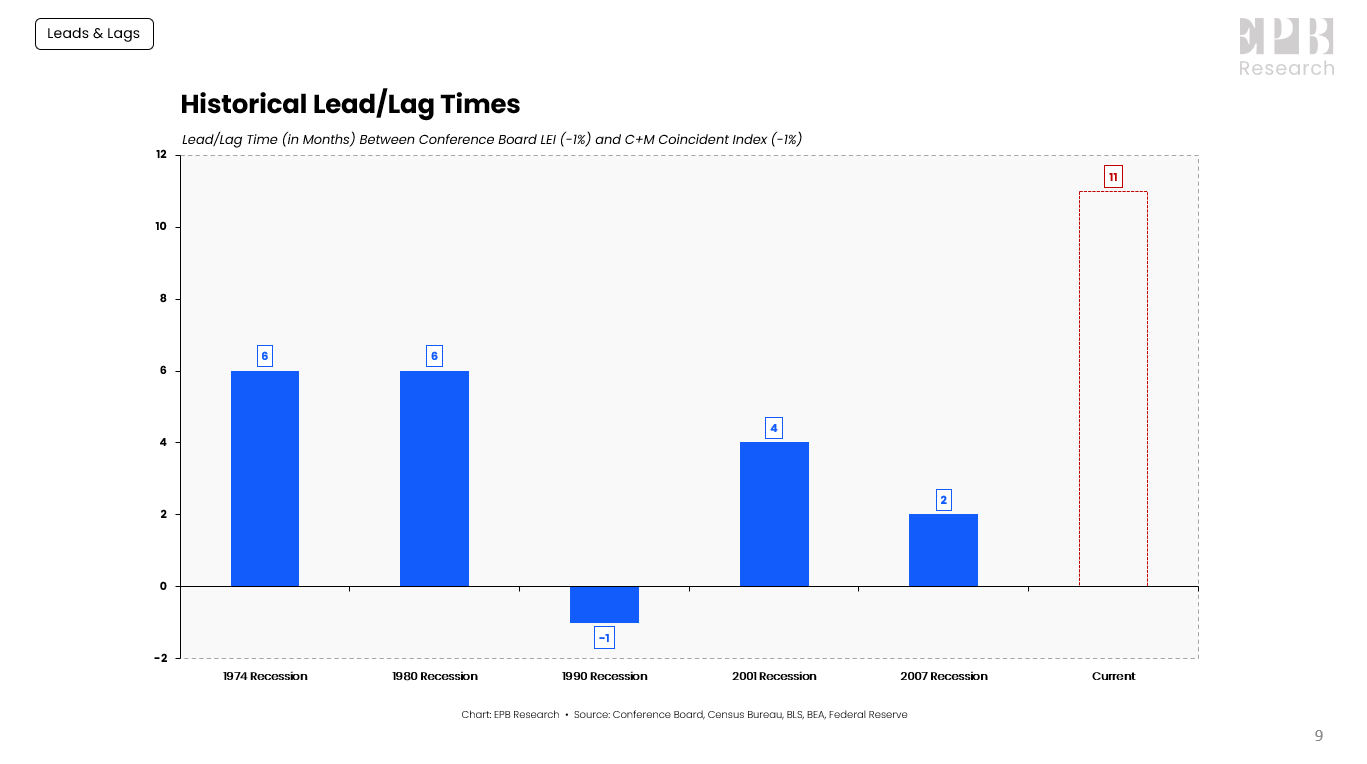
When the Leading Index moves below -1%, the Cyclical Economy moves below -1% about one quarter later on average.
In the 1974 and 1980 recessions, the lead time was six months. In the 1990 recession, the Leading Index lagged the Cyclical Economy by one month.
Conference Board, Census Bureau, BLS, BEA, Federal Reserve
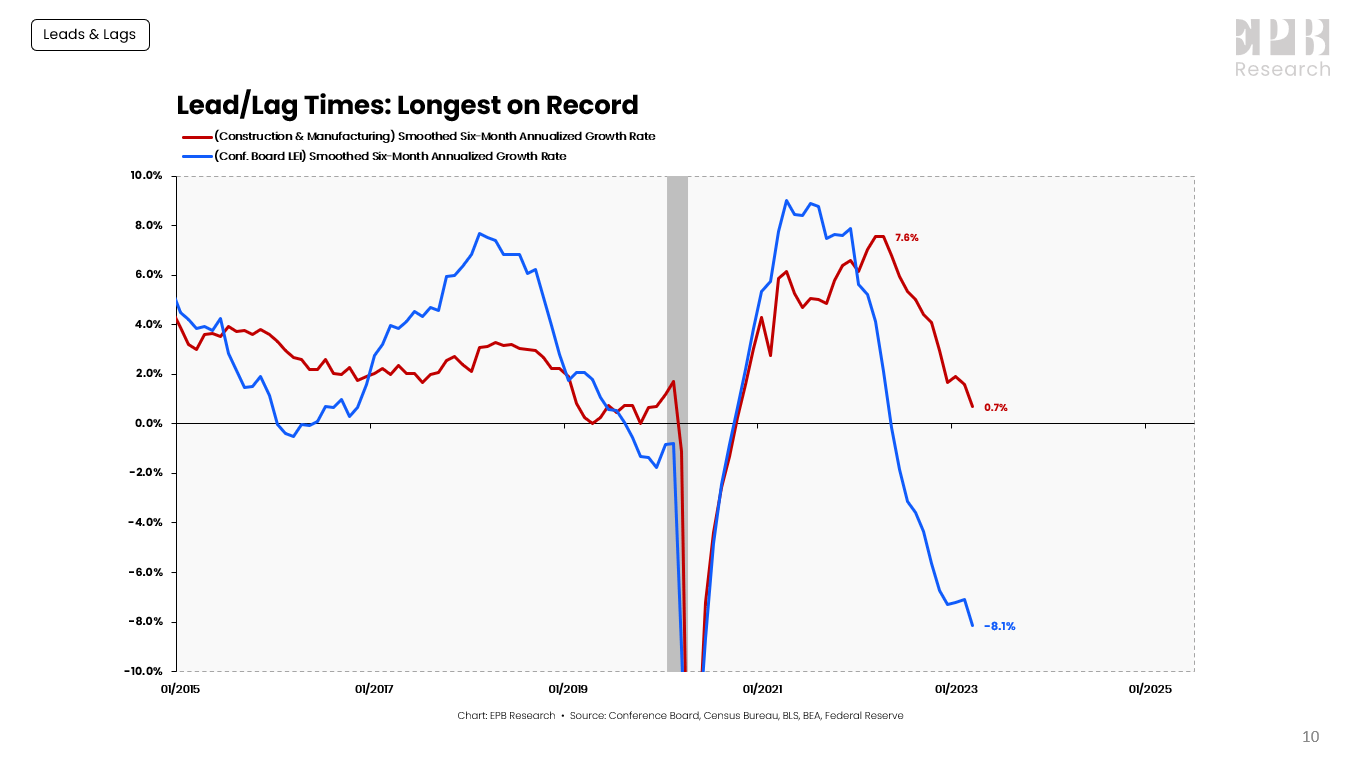
The Leading Index fell below -1% in June 2022. With data as of March 2023, the current lag is 10 months, the longest on record, and the Cyclical Economy has not yet contracted over a six-month time period.
The Cyclical Economy is clearly decelerating, however, with an extremely sharp angle of attack, falling from 7.6% growth to 0.7% growth in less than a year.
The Leading Index remains in deep contraction, with 80% of components showing declines, a high conviction signal.
The Cyclical Economy will likely turn negative with April data and potentially below -1% by May data should the current downward slope remain.
That would push the lag between the Leading Economy and the Cyclical Economy to 11 months, the longest on record.
Conference Board, Census Bureau, BLS, BEA, Federal Reserve
Nevertheless, the Leading Economy and Cyclical Economy will both be in recession which moves the Total Economy recession odds to 100%, based on history.
But when?
Perspective
The dating of a recession is left to the NBER using various criteria, but the questions are typically used to forecast changes in asset prices or Federal Reserve policy.
When the Leading Economy and Cyclical Economy are both lower than -1%, a recession, as dated by the NBER, occurred an average of 5 months later, with a range of a 4-month lag to a 14-month lead.
That means if the conditions are satisfied by May economic data, a recession could be dated from January 2023 to July 2024, based on the historical range of outcomes.
However, the two inflationary recessions of 1974 and 1980 had a 4-month lag and a 2-month lead, which hold some resemblance to the inflationary dynamics of today.
Even still, the question is further complicated by the particular asset in question.
Liquid and defensive assets like the S&P 500 have hovered in the -10% to -20% range, while other assets, like parts of commercial real estate, have become illiquid and hard to sell or refinance.
Final Thoughts
The Leading Economy moved into recession in June of last year. The signal has increased in validity as the decline is widespread, with 80% of components contracting and the depth increasing to -8%.
The Cyclical Economy will undoubtedly soon join the Leading Economy in recession which means the Total Economy will also sink into recession, if not already there, which remains possible based on the 1974 analog.
Asset prices, in the broadest sense, perform poorly in the lead-up to recessions and during recessions.
The recession is already underway for large parts of the real estate market, the banking sector, the small-cap and micro-cap universe, and other areas of private credit.
The recession has not fully developed in public credit markets or public equity markets as defined by the S&P 500, but the risk of substantial declines remains on the rise as recessionary conditions proliferate.
Editor’s Note: This article covers one or more microcap stocks. Please be aware of the risks associated with these stocks.
Recession or Not, There Will Be Pain
Enjoyed this article? Sign up for our newsletter to receive regular insights and stay connected.