The sharp increase in volatility within the monetary system in recent weeks has pushed the price of gold much higher. Gold is now back above $2000/oz and is nearly breaking above the resistance level its held since 2020. I have had a bullish view of gold and gold miners for some time, as I believe a new bullish rally may be around the corner. As detailed in a March article, it seems the VanEck Gold Miners ETF (NYSEARCA:GDX) may rally over the coming months as the Federal Reserve adjusts its inflation target to allow for a higher level. Fundamentally, I believe this will occur because the Federal Reserve will ultimately need to pursue some stimulus to offset the enormous surfacing risks in the financial system.
Most likely, the last interest rate hike has now occurred, meaning a “dovish pivot” is more likely. This shift coincides with the bottoming of the inverted yield curve, indicating re-steepening, which often occurs during the onset of an economic recession. With the M2 money stock falling and manufacturing growth reversing, we’re seeing a substantial slowdown in inflation. However, core inflation is still 5.5% YoY and the annualized rate of April’s inflation was still 4.9%. The fact that inflation remains this high despite the broader economic slowdown and significant declines in the money supply indicates that the Federal Reserve cannot stop inflation without jeopardizing the wider economy.
Gold showed no overall solid reaction to the contentious CPI report on Wednesday. At its current price level, gold will likely reverse 10-20% lower back into its trading range or break higher to a potentially higher all-time high. Accordingly, I believe it is an excellent time to take a closer look at gold and gold miners as the GDX is, to me, a preferable way to speculate on changes in gold’s price. While there is undoubtedly potential for GDX to turn lower, the broader situation in the macroeconomic and monetary spheres may promote a much higher gold price.
Gold is Not (Exactly) a Hedge Against Inflation
There is no doubt that inflation is slowing today and should continue to stall as long as the US and global economy continue to shift in a negative direction. The ongoing pressures in the banking system could accelerate this change as banks reduce lending more rapidly to ensure solvency. Crude oil and natural gas are also very cheap today compared to their price over most of 2020-2022, alleviating pressure on goods prices and production costs. Demand for gasoline products also declines, indicating a broader decline in global economic demand and lowering prices. Of course, low fuel prices force energy companies to reduce drilling investments, causing future production levels to decline.
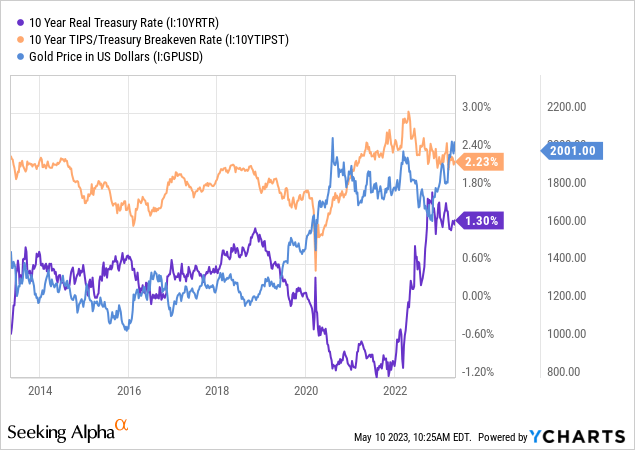
It is often said that gold is a hedge against inflation. In reality, it is a hedge against expected future inflation, less the potential returns found in fiat current investments. Gold does not rise when inflation is high; it rises when inflation is expected to grow over the coming years. Further, should interest rates on bonds (fiat investments) also increase in response to expected inflation, gold’s gains are usually limited since it does not pay a yield. As such, gold’s price is primarily tied to the inflation expectation rate in bond prices and the real yields on those bonds (or yields after expected inflation). Today, the inflation expectation rate has moderated while the real rate remains elevated. See below:
Data by YCharts
Gold usually has a robust inverse correlation to the 10-year real interest rate. However, the real interest rate remains very high today compared to the price of gold, potentially indicating overvaluation in gold. The breakeven inflation rate has moderated but is still above its 10-year range, potentially promoting a higher gold price as investors are “pricing in” a decline in real interest rates.
Gold’s abnormal strength compared to real interest rates may be skewed since “real interest rates” are not accurately tied to inflation. The “real interest rate” on a 10-year inflation-indexed Treasury bond is linked to the CPI. However, if the CPI does not measure “true” inflation, as some models suggest, then the “true” real interest rate is much lower today. In other words, if inflation is actually around 8% today, then the real interest rate on a 10-year Treasury bond is very negative, promoting a much higher gold price. I believe this is a possible factor benefiting gold and untangling it from its typical relationship with inflation-indexed Treasury bonds.
There are important implications to the potential inaccuracy of the CPI model., as suggested by the long-term increase in “spread” between CPI and alternate inflation measures. For one, that would imply the US economy has been in a recession since mid-2021. While most popular official metrics do not confirm this, abysmal consumer confidence figures since then indicate that a household’s financial stability has been declining (that is, living costs rising faster than incomes). If so, then we may expect inflation to remain high even if the economy “officially” enters a recession. To me, the fact that inflation has remained so high despite record-low consumer confidence implies that supply-side issues are still driving inflation far more than changes in consumption levels (as is historically more common).
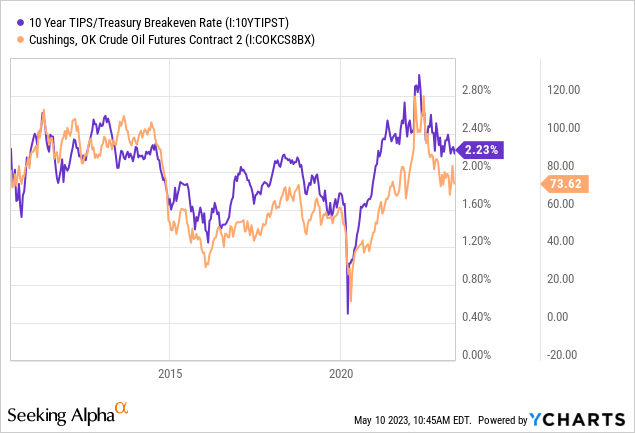
At any rate, the expected CPI inflation level, as implied by Treasury bond yields, strongly correlates to true inflation, even if the CPI model does not measure true inflation accurately. The inflation expectation rate, or “breakeven inflation rate,” is fundamentally tied to the price of crude oil because of its keystone importance in goods’ costs. Crude oil’s price is also outside the Federal Reserve’s purview, as raising interest rates does not directly lower the oil price. As you can see below, the primary cause for the decline in the breakeven inflation rate is the drop in crude oil since 2022:
Data by YCharts
Oil remains very low today compared to its 2021-2022 range and is nearly below the breakeven production price (which is rising). Due to this, the US “rig count,” which measures oil drilling levels, has begun to decline, indicating a decline in US oil production levels. For now, the demand outlook appears to be falling at a similar or faster pace to the oil production forecast, so there is limited impact on oil prices. However, as in 2020, I believe we could see an overreaction that pushes oil production too low, eventually causing oil prices to rise much higher. This is important for gold because it may mean a decline in inflation expectations will be short-lived and followed by a more significant increase as producers (of oil and other items) overreact to falling economic demand, creating more considerable shortages.
Gold is a Hedge Against Dollar Instability
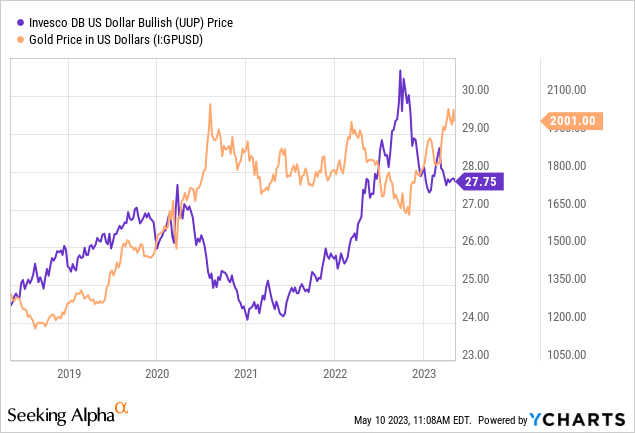
As discussed in numerous recent articles, the current instability in the banking system and the statistically high recession risk put the Federal Reserve in a challenging situation. On the one hand, they must supply sufficient liquidity to mitigate contagion risks and slow strain in financial markets. On the other hand, they must avoid providing too much stimulus that inflation spikes higher, as occurred following its overreaction in 2020. With banks facing a multi-trillion dollar issue and the US Treasury running low on funds (due to the debt ceiling), I believe it may be challenging for the Federal Reserve to walk that thin tightrope. The US dollar remains strong today, implying the Federal Reserve has some leeway in allowing for a more significant dovish pivot. Of course, doing so would depress the US dollar, which would likely benefit gold. See below:
Data by YCharts
Gold has been near an all-time high in most countries since 2022 and has fluctuated mainly with changes in currency values. The US dollar may be in a “head and shoulders” pattern that indicates a more considerable decline is around the corner, likely benefiting the US dollar price of gold. This technical pattern in the dollar corresponds to the fundamental dovish pivot in the Federal Reserve, potentially creating a strong negative catalyst for the dollar. Based on its normal pricing, a normalization in the dollar exchange rate compared to the Yen and Euro should push the dollar price of gold up to $2200/oz, potentially boosting miner profits by >20% (given an AISC of ~$1200/oz).
What is GDX Worth Today?
I prefer GDX to “paper gold,” such as the SPDR Gold Trust (GLD) because it has closer ties to physical gold. Secondly, GDX generally offers a 2X “beta” to gold, making it a superior speculative asset as it can rise by a great deal given a minor increase in the price of gold. However, one potential issue in GDX today is its high valuation in its holdings. The current weighted average “P/E” for GDX is 24.6X based on TTM earnings. That valuation level is slightly above the TTM “P/E” average in the S&P 500 of 22.2X today.
Importantly, there is a large discrepancy between the twelve-month average gold price and the current gold price. Gold is around $2030/oz and averaged about $1800/oz over the past year. The average all-in production cost of gold in 2022 was $1230/oz, but it has been rising in recent years, so it may be closer to $1300/oz today by extrapolating that trend. Thus, to roughly measure, I believe most miners profited around $570/oz from Q2 2022 to Q1 2023 (or TTM, 1800-1230) and will profit around $730/oz today (2030-1300). This represents a 28% increase in forward estimated profits vs. TTM earnings, giving GDX an estimated forward “P/E” of 20.7X.
In my view, a 20.7X forward “P/E” indicates GDX is not overvalued today, nor is it undervalued based on the current price of gold. If I were not bullish on gold, I would not buy GDX. However, I believe gold may rise to around $2200/oz this year based on my outlook for the US dollar. Further, if the Federal Reserve pursues a more significant dovish pivot or oil begins to rise again (increasing inflation expectations), then $2400/oz or higher may be reasonable. This potential rally would boost the average gold miner’s estimated profit per ounce to $900/oz-$1100/oz, or 58% to 92% above the TTM level. If gold rises to that range, GDX’s forward “P/E” should fall to around 12.8X -15.5X.
Without a doubt, GDX’s forward valuation based on current gold prices is not sufficient to justify a bullish outlook. However, a 10-20% increase in the price of gold would easily make GDX undervalued today. Of course, the specific measures could differ because production costs correlate with currency prices, and GDX is exposed to many international firms. However, I believe this illustrates that GDX is fairly valued today and could quickly rise by ~20-30%, given a 10-20% increase in the price of gold.
I believe gold has sufficient positive catalysts to justify a bullish position in GDX. I also prefer GDX to specific gold miners to reduce the risks associated with mine shutdowns and other company-specific issues, which have been notable in the mining sector since 2020. Both gold and the US dollar are in key technical positions today that could either cause it to fall by ~10% back into its range (associated with an improvement in the dollar) or gold to enter a new bullish rally as it breaks above its current range. I believe the latter is more likely, but both are possible, so ample caution should be used. While I am bullish on GDX, the ongoing volatility in the monetary system and economy could easily whipsaw gold negatively, particularly if the Federal Reserve fails to make a dovish pivot.
Industry ETF’s of Gold Miners ETF List (2/5): Returns, Fund Flows, Expenses
Enjoyed this article? Sign up for our newsletter to receive regular insights and stay connected.