
The iShares BB Rated Corporate Bond ETF (HYBB) provides exposure to high-quality high yield bonds but has historically underperformed the broader high-yield market.Investors seeking high-quality high-yield bonds should consider the VanEck Fallen Angel High Yield Bond ETF (ANGL) instead.Fallen angels, like those included in the ANGL ETF, have shown better credit characteristics and the potential for outperformance.
The iShares BB Rated Corporate Bond ETF (NYSEARCA:HYBB) is a recently launched passive ETF that provides investors exposure to the highest quality tranche of the high yield bond market.
While the securities held within the HYBB ETF are supposedly the highest quality bonds in the high yield market, they have historically underperformed the broader high yield markets overall in terms of total returns.
Instead of the HYBB ETF, I recommend investors seeking the highest quality high yield bonds to consider the VanEck Fallen Angel High Yield Bond ETF (ANGL) instead.
Fund Overview
The iShares BB Rated Corporate Bond ETF provides investors with targeted exposure to a diversified portfolio of BB-rated corporate bonds. The HYBB ETF tracks the ICE BofA BB US High Yield Constrained Index (“Index”), which is a subset of the ICE BofA US High Yield Constrained Index and measures the performance of the BB-rated fixed-rate, U.S. dollar denominated corporate bond market. The HYBB index is market cap weighted, with a 2% cap on any single issuer.
To be eligible for the index, an issue of U.S. corporate bonds must have maturity of 1 year or more and outstanding face value of $250 million or more. The security must be rated between BB+ to BB- based on the average of Moody’s, Fitch, and S&P Global ratings.
Within the high yield universe, BB-rated securities are generally considered the highest ‘quality’ part of the universe, as they are only 1 notch below investment grade (BBB-rated or above) securities. Some investors believe BB-rated securities may provide better risk-adjusted returns than the broader high yield markets.
The HYBB ETF was recently launched in October 2020 and, so far, has only garnered $239 million in assets and charges a 0.25% expense ratio.
Portfolio Holdings
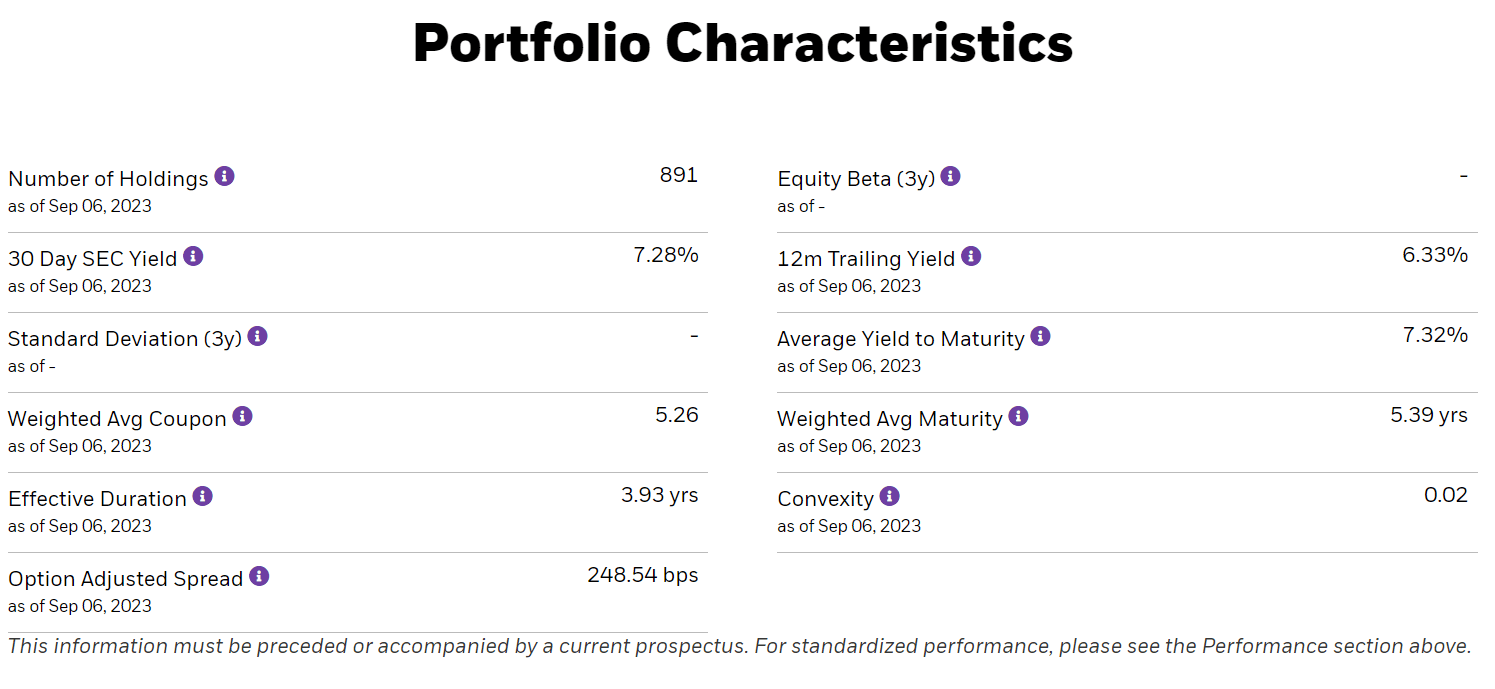
Figure 1 shows the portfolio characteristics of the HYBB ETF. The ETF holds 891 securities with a portfolio 30 Day SEC Yield of 7.3% and effective duration of 3.9 years. On average, the portfolio has an option adjusted spread of 249 bps.
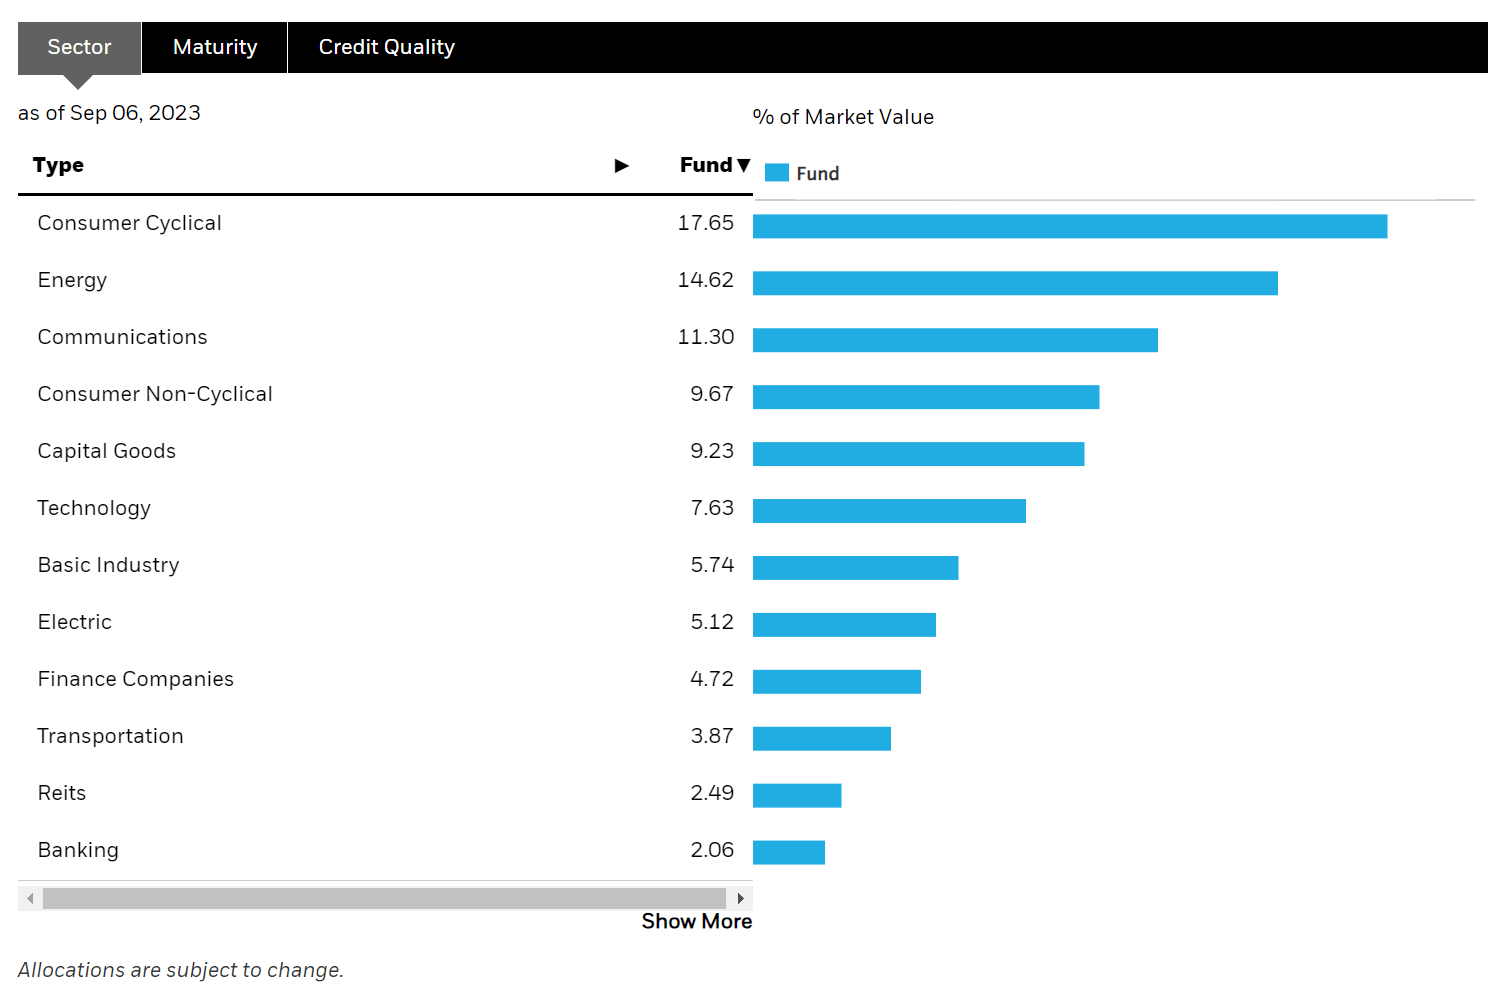
HYBB’s portfolio is diversified across sectors, with Consumer Cyclicals being the largest sector exposure at 17.7%, followed by Energy at 14.6%, Communications at 11.3%, Consumer Non-Cyclicals at 9.7%, and Capital Goods at 9.2% (Figure 2).
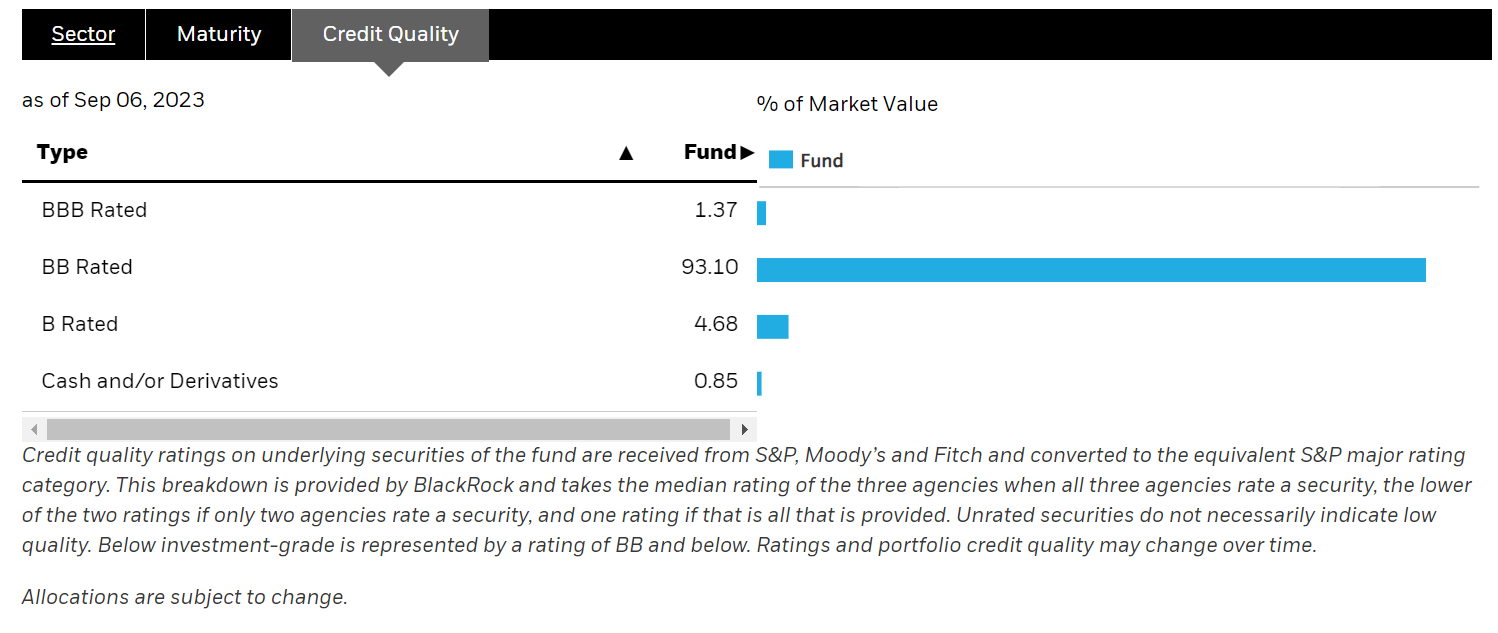
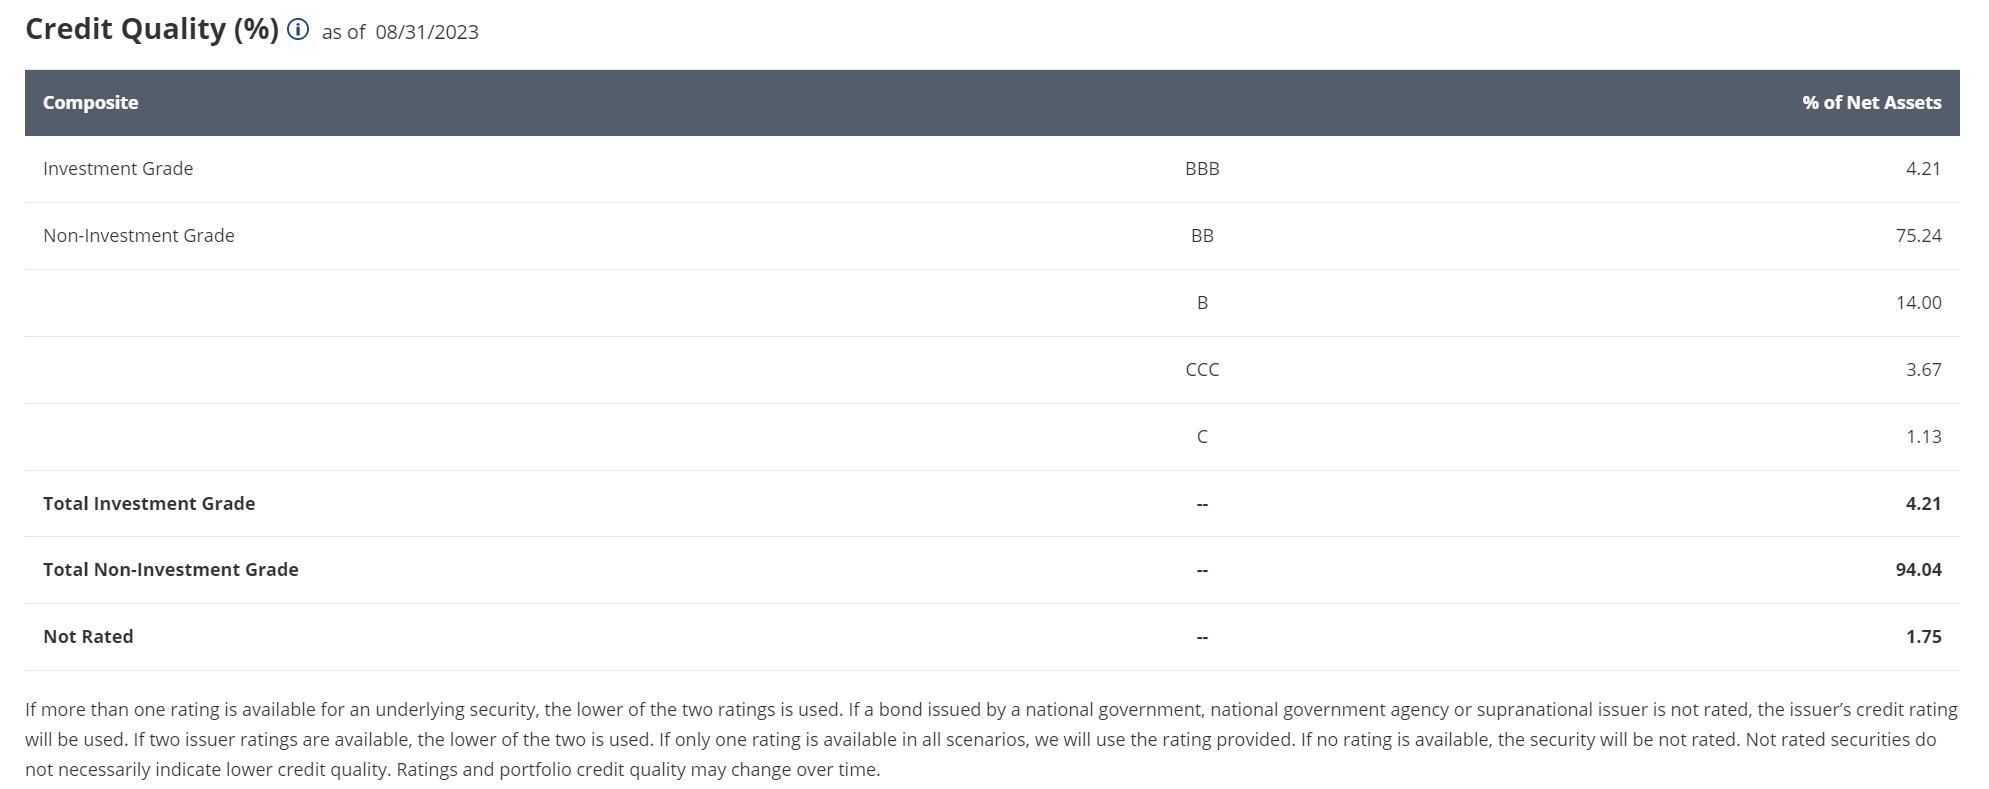
As designed, the HYBB ETF holds over 93% of its portfolio in securities that are rated BB (Figure 3). However, investors should note that it also holds some securities rated below BB. This could be due to recent rating downgrades on the securities that have not yet been reflected in the index, or it could be due to an intentional deviation from the index by the manager, as the HYBB ETF does not fully replicate the underlying index.
Returns
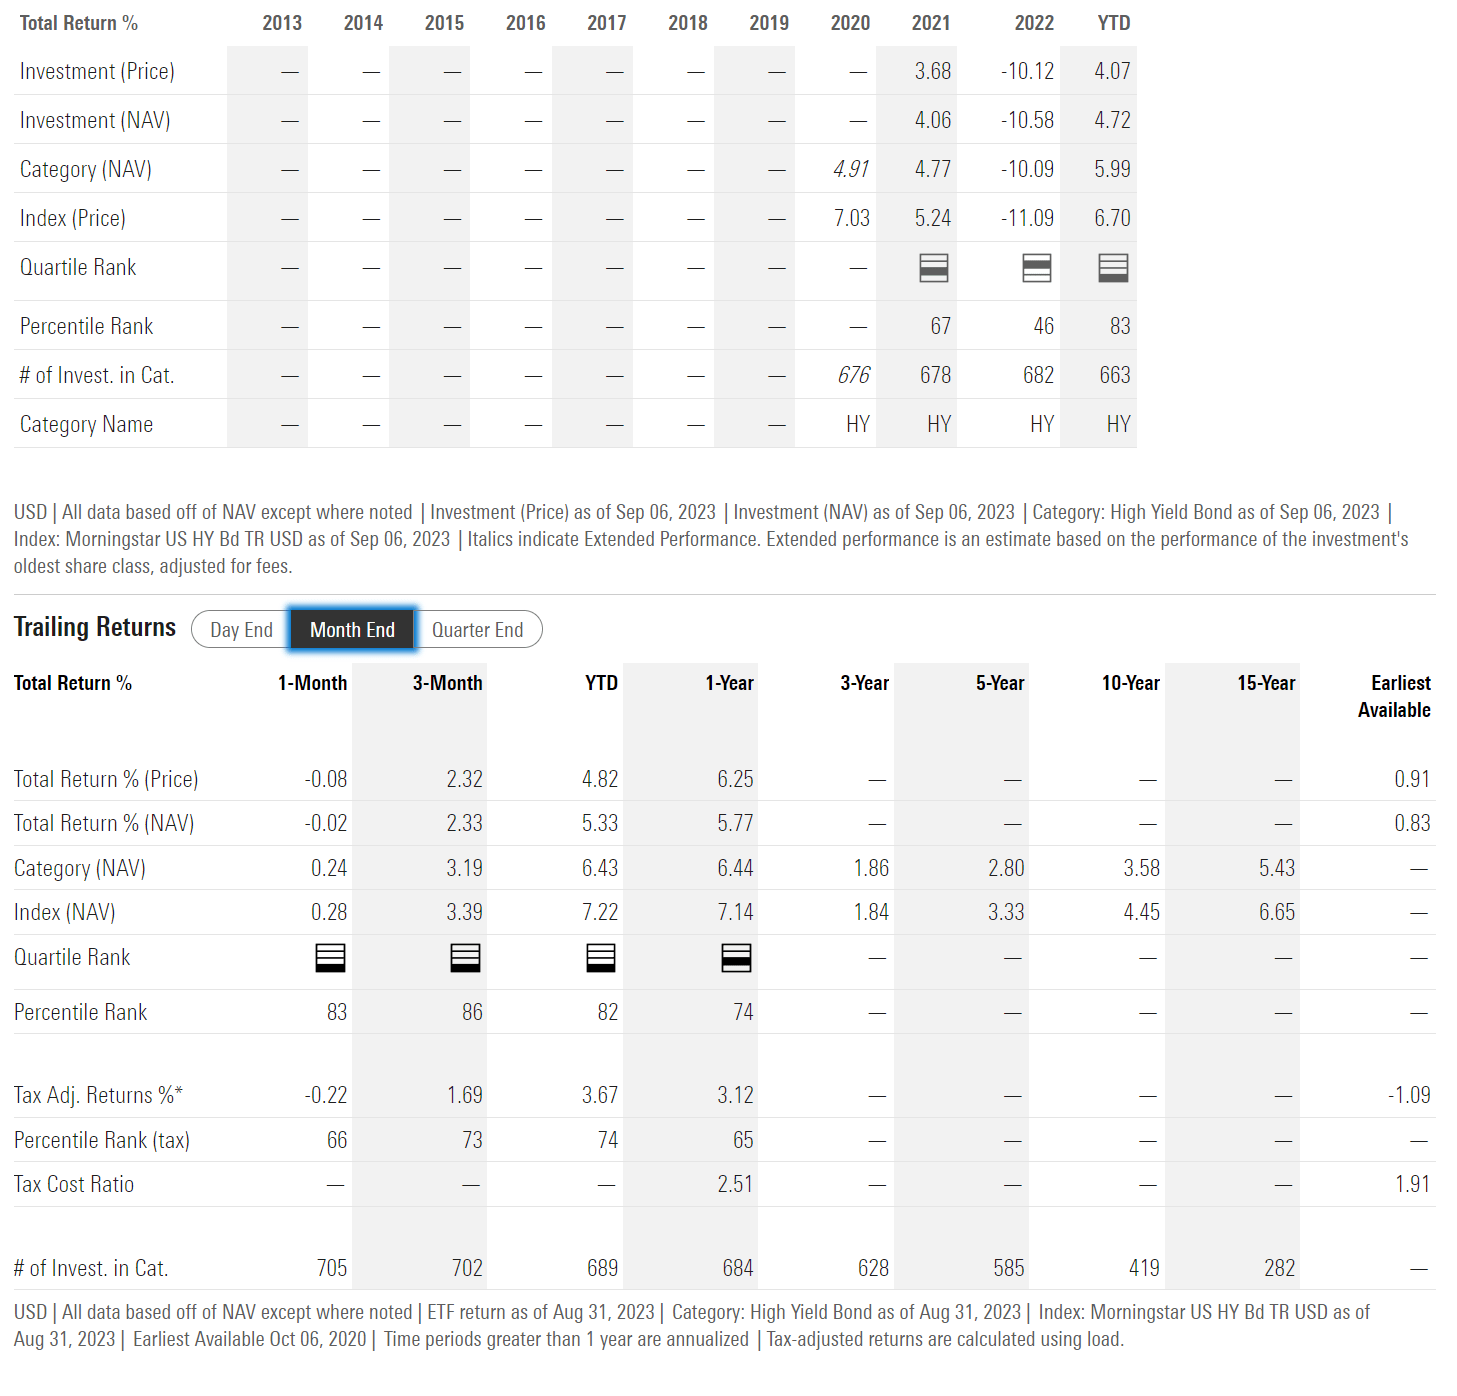
As mentioned above, the HYBB ETF was only launched in October 2020, so it does not have a long operating history. So far, historical returns for the HYBB ETF has been modest, with 1Yr returns of 5.8%, but since inception average annual returns of only 0.8% to August 31, 2023 (Figure 4).
Distribution & Yield
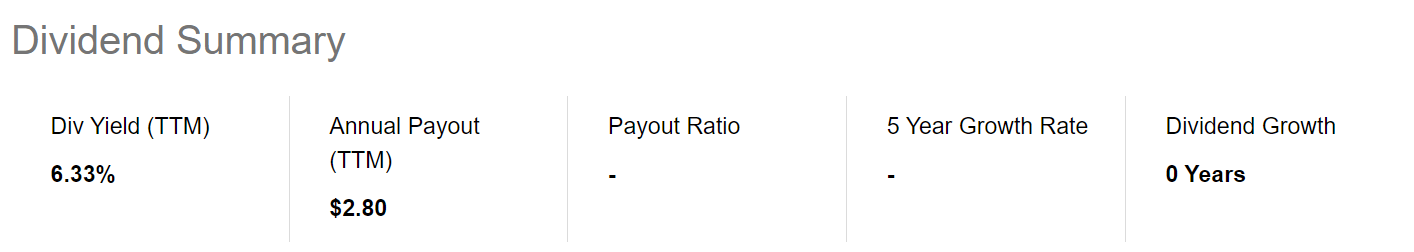
The HYBB ETF pays an attractive monthly distribution with a trailing 12-month distribution yield of 6.3% (Figure 5).
HYBB Vs. Peers
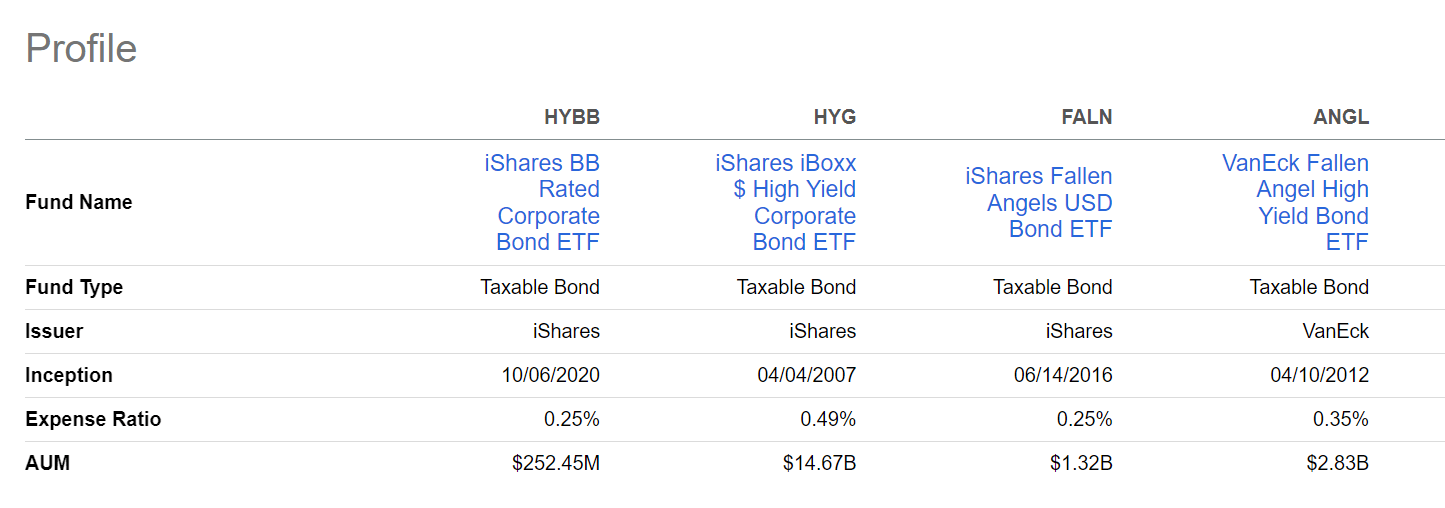
To judge the performance of the HYBB ETF, we can compare it against the iShares iBoxx $ High Yield Corporate Bond ETF (HYG), which tracks the overall high yield market. Furthermore, we can also compare HYBB to the iShares Fallen Angels USD Bond ETF (FALN) and the VanEck Fallen Angel High Yield Bond ETF (ANGL), both of which track bonds of issuers that have been downgraded out of the IG universe (i.e. formerly IG rated issuers now trading as high yield).
In terms of fund structure, the HYBB has the least assets out of the peer group. However, it is also the cheapest, with an expense ratio of only 0.25% (Figure 6).
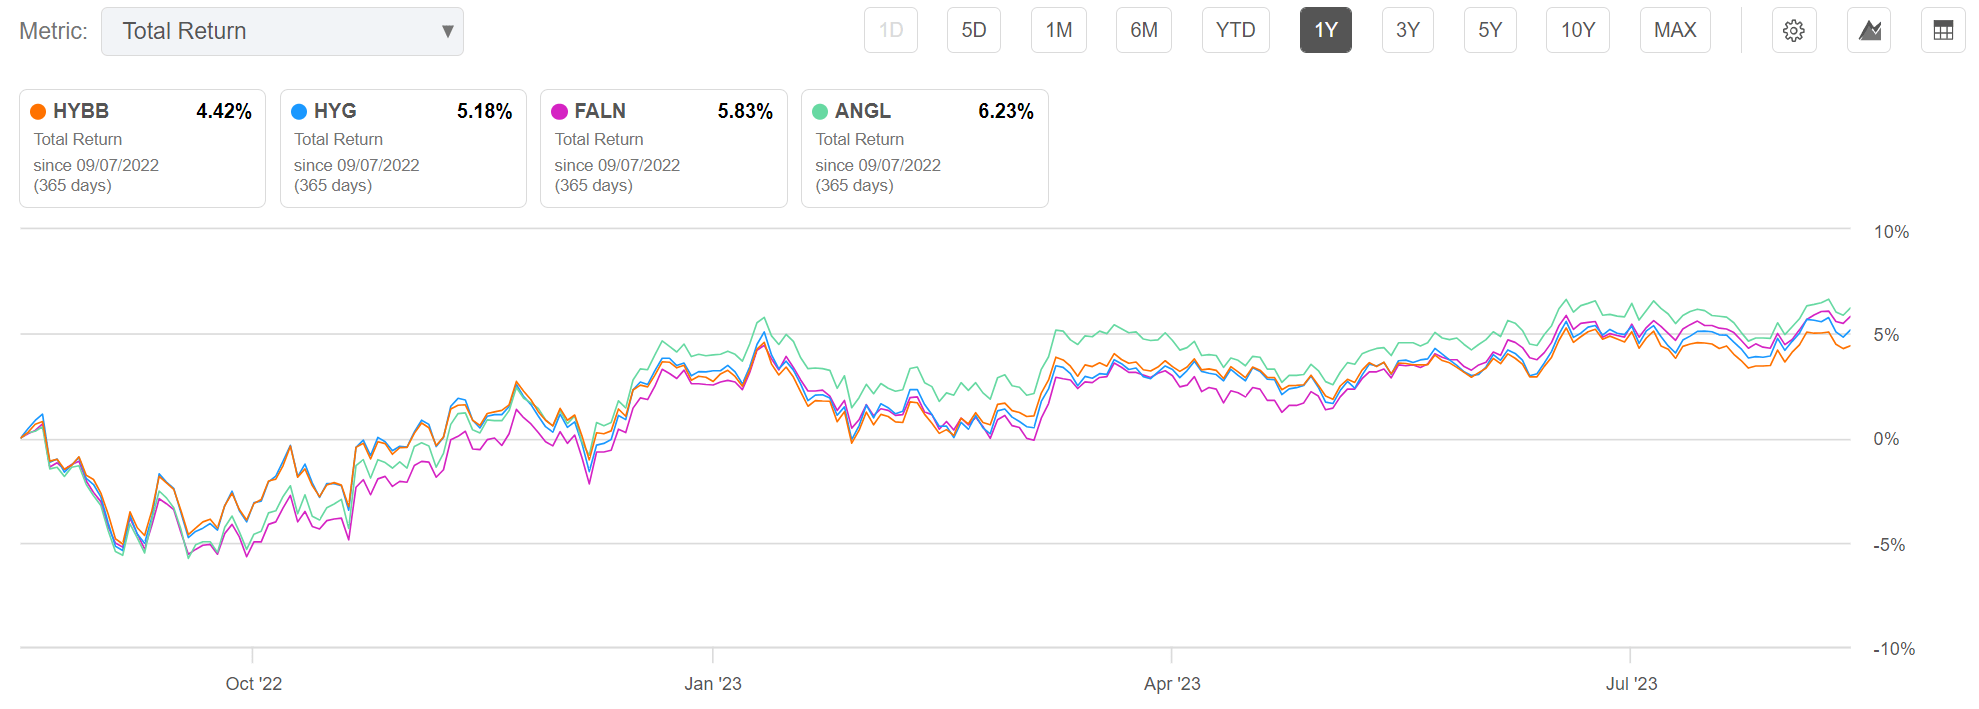
However, when we analyze the historical total returns, we find that the HYBB ETF has generally underperformed its high yield peers. On a 1-year basis, the HYBB ETF has only returned 4.4% compared to 5.2% for HYG, 5.8% for FALN and 6.2% for ANGL (Figure 7).
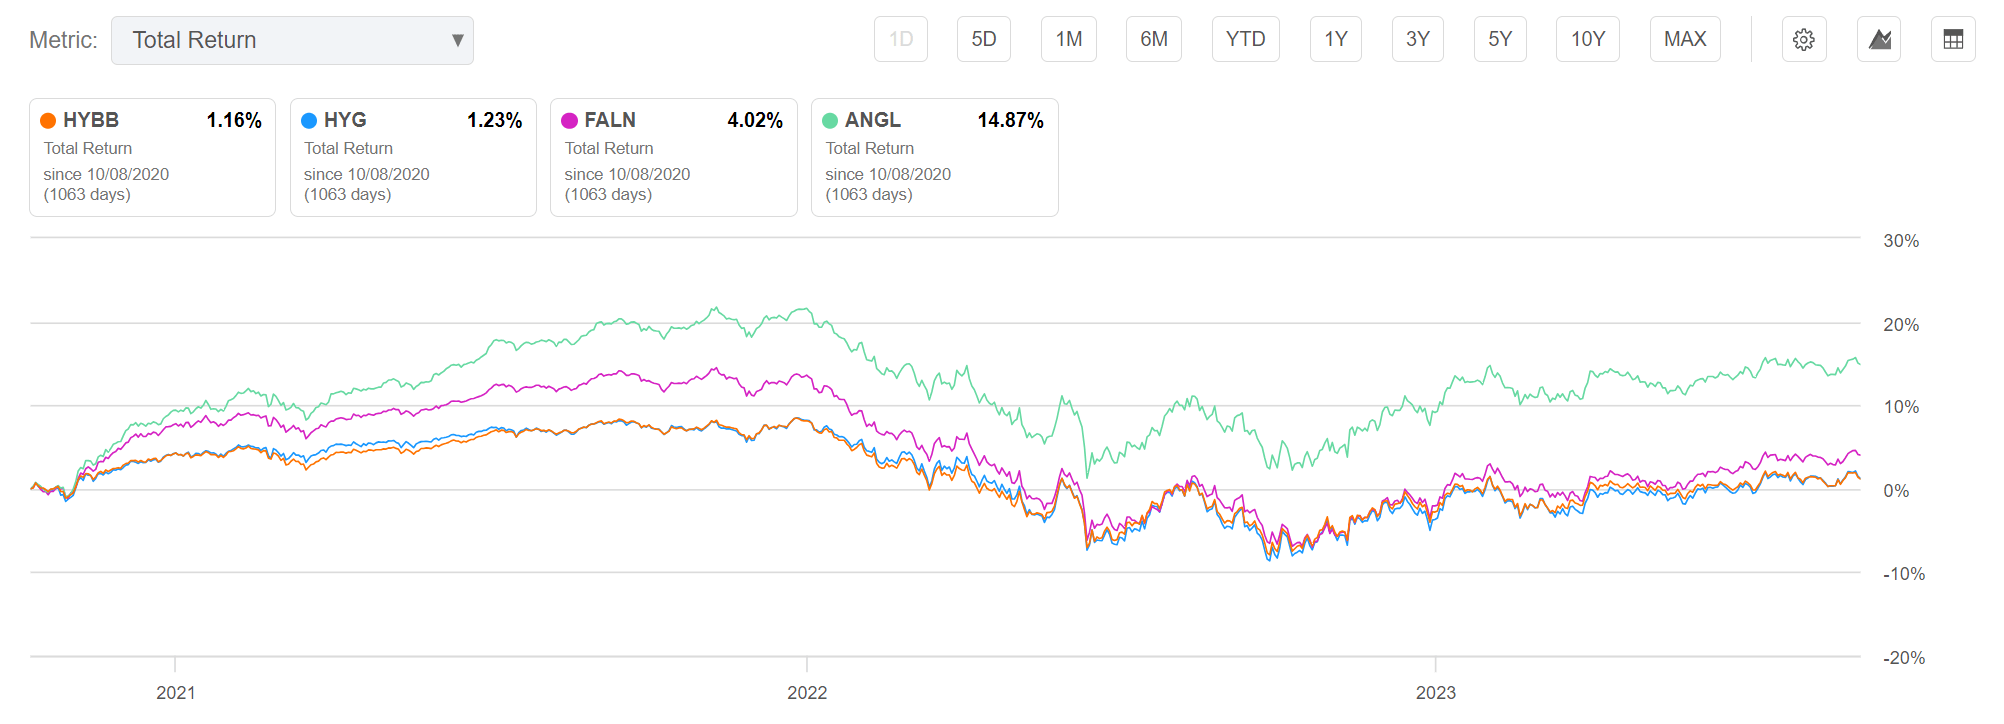
Since HYBB’s inception, it has returned 1.2% in total returns, matching HYG but underperforming FALN’s 4.0% return and ANGL’s 14.9% return (Figure 8).
Why ANGL May Be The Better High Quality Junk Bond Fund
Although some investors view credit downgrades as a negative event, contrarians may find fallen angels attractive, as there is the possibility of the issuer recovering its investment grade status in the future. In fact, when we look at the ANGL ETF’s portfolio, we see that over 75% of the portfolio is rated BB, similar to the HYBB ETF.
Furthermore, some academic studies have shown that fallen angels tend to have better credit characteristics than original-issue high yield bonds.
There may also be a fundamental reason why fallen angels to outperform. When a bond issuer falls on hard times and is downgraded below investment grade, investment grade fund managers are forced to remove the security from their portfolios. This forced selling causes the affected securities to be massively dislocated relative to their underlying business risks as they enter the ‘fallen angel’ indices. Over time, as business risk is normalized, the fallen angel may outperform others similarly rated junk bonds.
From Figure 8 above, we can see that fallen angel investing does outperform the vanilla high yield bond ETF HYG and the ‘high quality’ HYBB ETF. However, there is also a large difference between the returns of FALN and ANGL. This may be due to specific portfolio risks like duration that is differed between the two funds and may be explored in a future article. I wrote about the ANGL ETF here.
Conclusion
The iShares BB Rated Corporate Bond ETF provides investors exposure to BB-rated high yield bonds, typically considered the highest quality spectrum of the high yield bond markets.
Analyzing the historical returns of the HYBB ETF compared to the high yield bond markets overall, as represented by the HYG ETF, investing in BB-rated securities does not appear to add any alpha as the HYBB ETF has lagged or matched HYG since inception.
Instead of the HYBB ETF, investors interested in ‘high quality’ high yield bonds should consider the ANGL ETF that invests in ‘fallen angels’. Historically, investing in fallen angels has proved to deliver superior returns. I am neutral on the HYBB ETF and rate it a hold.
Enjoyed this article? Sign up for our newsletter to receive regular insights and stay connected.