
Schwab 1000 Index ETF (SCHK) covers over 90% of the total US stock market capitalization, but the market is considered expensive based on the revised Buffett Indicator and forward P/E ratio.SCHK had a challenging year in 2022 but has since recovered, delivering a positive return of 19.2%.The Federal Reserve's elevated interest rates and the possibility of a recession pose significant downside risks to SCHK's fund price, so investors should wait on the sidelines.
ETF Overview
Schwab 1000 Index ETF (NYSEARCA:SCHK) has a portfolio of 1,000 largest U.S. stocks. The fund covers over 90% of the total U.S. stock market capitalization. Based on our analysis using the revised Buffett Indicator and forward P/E ratio, we see the U.S. market as quite expensive right now. Given a possible recession is likely on the horizon as the Federal Reserve needs to keep the rate elevated to combat inflation, there is significant downside risk to SCHK's fund price. Therefore, we suggest investors to wait on the sidelines.
Fund Analysis
SCHK delivered impressive performance in 2023
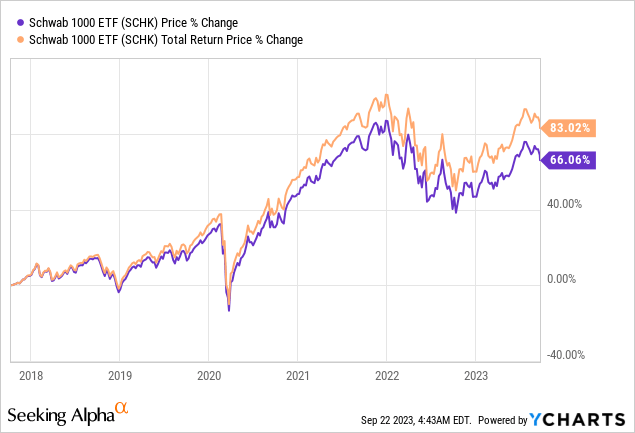
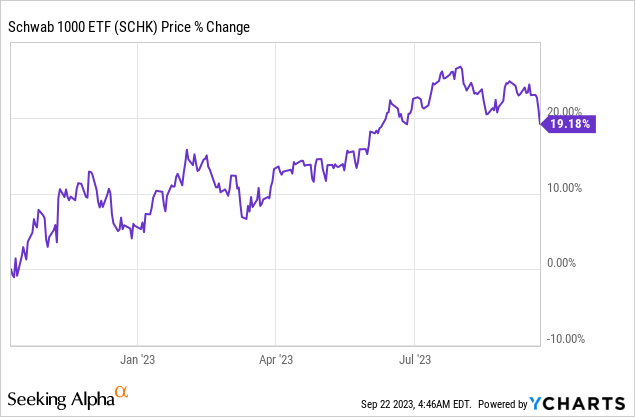
Last year was a challenging year for the broader stock market as the Federal Reserve aggressively raised the rate to combat inflation. Like many other funds, SCHK declined quite significantly in 2022. In fact, it has declined by over 25% in 2022. However, it has since recovered a significant portion of its loss since October 2022. As can be seen from the chart below, it has delivered a positive return of 19.2% since reaching the trough in October 2022.
The revised Buffett Indicator tells us that the broader market is quite expensive
Since SCHK’s portfolio of 1,000 largest U.S. companies covers over 90% of the total U.S. stock market capitalization, using investment guru Warren Buffett’s indicator to gauge whether the market is overvalued or not appears to be a suitable choice.
So, what exactly is the Buffett Indicator? In a Forbes interview in December 2001, Warren Buffett recommends using the ratio of total market capitalization to GDP to evaluate whether the broader stock market is overvalued or not. According to Warren Buffett, if the total market capitalization to GDP ratio is in the range between 75% and 90%, the market’s valuation is considered reasonable. If this ratio is above 90%, the stock market is somewhat expensive. If this ratio is above 120%, the broader stock market is very expensive.
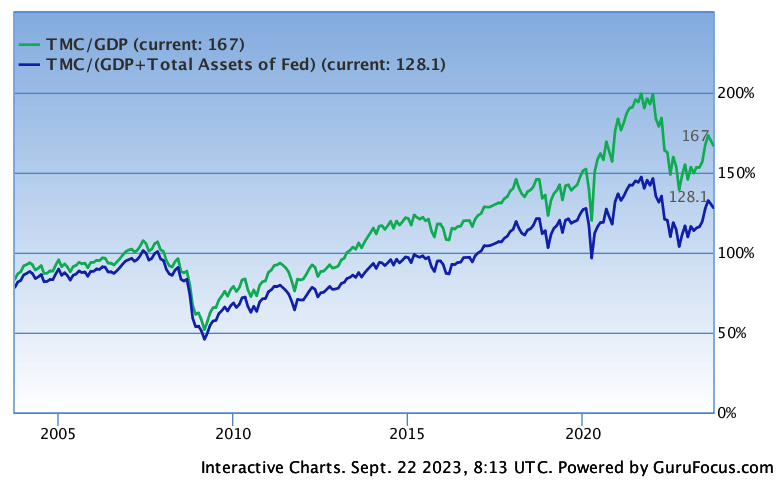
Since the current U.S. GDP is about $26.8 trillion, and the total market cap of U.S. stocks is about $44.8 trillion, the total market cap to GDP ratio is about 167%. This indicates to us that the U.S. stock is very expensive. However, investors should also take into consideration the Federal Reserve’s balance sheet. Given that the Federal Reserve has significantly expanded its balance sheet over the past 20 years, the denominator of the equation needs to be revised to include total assets of the Federal Reserve. Taking this into consideration, the revised ratio is equal to the total market capitalization divide by GDP plus Fed Assets ratio. Using this equation, the ratio is down to about 128.1%. Below is a chart that shows the historical total market cap to GDP plus Fed Assets ratio. As can be seen from the chart below, while this ratio has declined significantly from nearly 150% during the peak of the pandemic, it is still quite elevated compared to the period between 2010 and 2017. Therefore, we think the broader market is quite expensive.
Forward P/E ratio also shows that the market is quite expensive
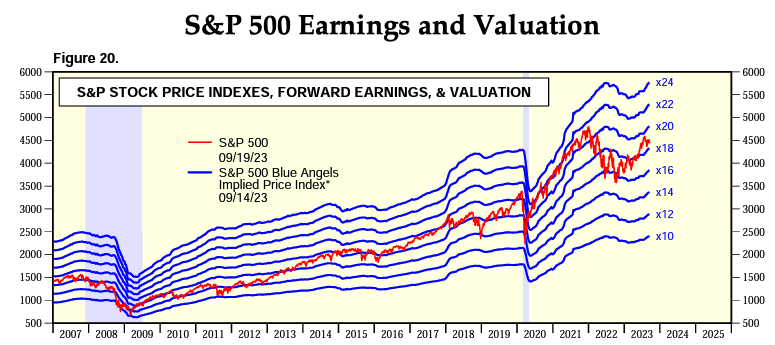
Besides the revised Buffett Indicator, below is a chart that shows the forward earnings, and forward P/E ratios of the S&P 500 index. This index represents over 80% of the total U.S. market capitalization. Therefore, it has significant overlaps with SCHK's 90% overlap of the total U.S. market capitalization. As can be seen from the chart below, S&P 500’s current forward P/E ratio is towards the high end of its historical range. Therefore, we believe SCHK is also overvalued.
A recession will lead to earnings revision and valuation compression
Looking forward into the first half of 2024, the Federal Reserve may be near the end of its rate hike cycle. While August’s inflation rate of 3.7% is dramatically lower than last year’s double-digit inflation rate, it is still far away from the Federal Reserve’s long-term inflation target of 2%. In addition, the recent surge in fuel prices will make it much harder for the Federal Reserve to tame inflation. Hence, this elevated rate will likely stick around for a lengthy period. Unfortunately, the longer the Federal Reserve keep the rate elevated, the likelier a recession will occur.
If a recession do occur towards the first half of 2024, we will likely see many companies in SCHK’s portfolio revise their earnings downward. This will add more pressure to their share prices. In addition, their lofty valuations will likely be compressed. Given stock markets usually finds its bottom during a recession, and not before a recession, it is very likely we will see the stock market trying to test the trough reached in late 2022. Therefore, there is likely significant downside risk ahead.
Investor Takeaway
We think SCHK is quite expensive at this level. Given that a recession may not be too far away from now, there is significant downside risk and investors should not ignore this risk. Investors should stay on the sidelines and wait for a better entry point.
Additional Disclosure: This is not financial advice and that all financial investments carry risks. Investors are expected to seek financial advice from professionals before making any investment.