
FNDE invests in large-cap emerging market stocks through a unique fundamentals-based weighting methodology.The fund has outperformed comparable EM ETFs, reflecting the advantages of its strategy, which also offers a 5% dividend yield.We are bullish on emerging markets and see an upside for FNDE going forward.
The Schwab Fundamental Emerging Markets Large Company ETF (NYSEARCA:FNDE) invests across international stocks from developing economies. The attraction here is an expectation for higher long-term growth, with emerging markets (EM) benefiting from trends like an expanding middle class and rising per capita consumption of valued added services.
That said, the understanding is that EM faces higher risks between currency volatility and potential political instability. EM stocks have underperformed in the past decade, pressured by factors like a strong U.S. Dollar as well as a slowdown from China, the largest and most important emerging market.
FNDE addresses these dynamics by utilizing a systematic fundamentals-based methodology which effectively weeds out some of the weakest companies. The fund has been able to outperform alternative EM funds over the last several years, highlighting the allure of the strategy. In our view, FNDE is a good option for exposure to emerging markets in the context of a diversified portfolio.
What is the FNDE ETF?
FNDE technically tracks the “Russell RAFI Emerging Markets Large Company Index”. Starting with the universe of eligible EM stocks, the first screening criteria is based on trading liquidity to ensure that each position is investable.
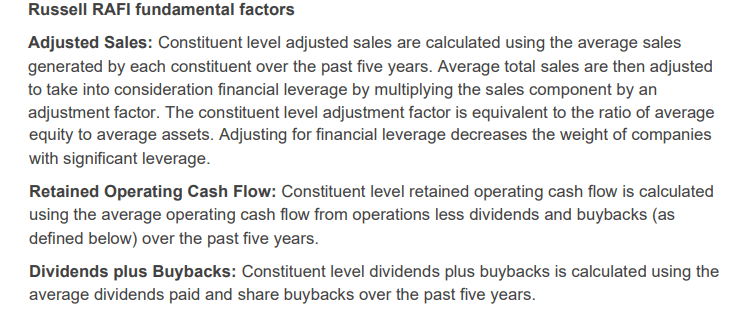
The methodology then ranks each company based on three fundamental factors. These include the level of sales over the past five years adjusted for financial leverage, retained operating cash flow, and the amount of dividends plus buybacks distributed.
Stocks are weighted proportionally by their aggregate score across these measures. The bottom percentile of companies ranked are excluded from the index and the fund. There is also a quarterly rebalancing.
Naturally, there is a connection between companies’ market capitalization and the aggregate level of sales, but the final result here is distinct compared to a traditional cap-weighted methodology.
Companies with higher levels of operating cash flow and dividend payers gain importance in the strategy, while highly leveraged and unprofitable names are underweighted.
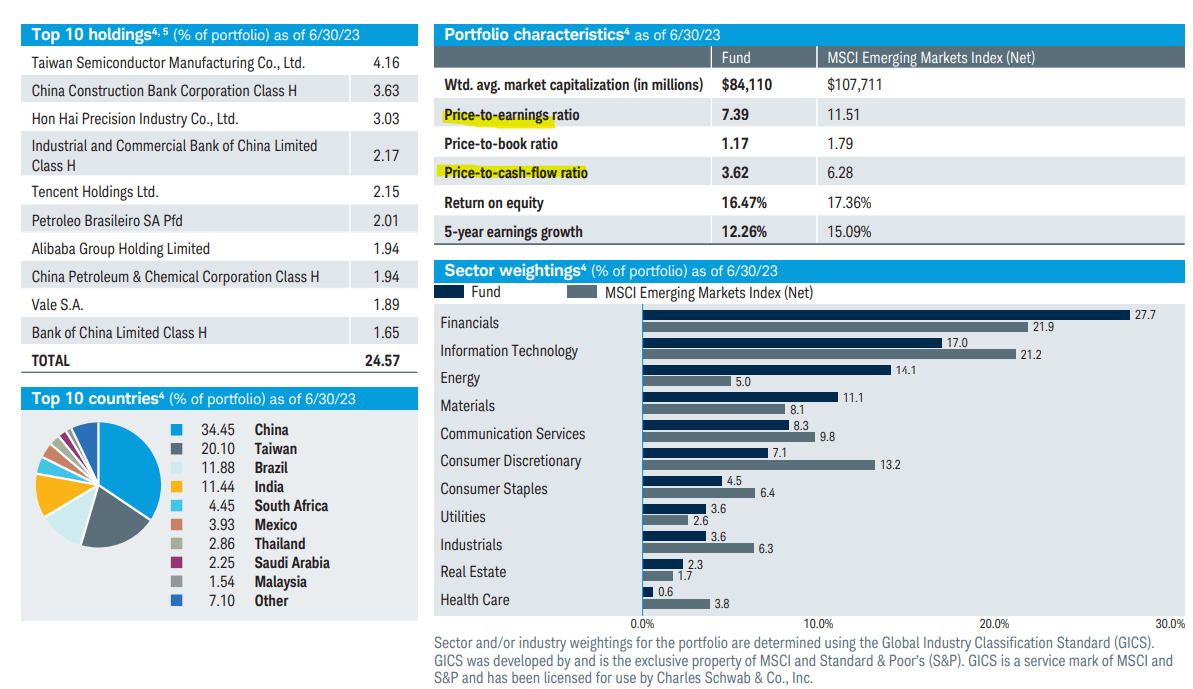
Going through the current holdings, we find several familiar names among the top holdings. Taiwan Semiconductor Manufacturing Co Ltd (TSM) and China Construction Bank Corp (OTCPK:CICHY) are the two largest positions in the fund with a 4% weighting each. Down the line, high-profile tech leaders Tencent Holding Ltd (OTCPK:TCEHY) and Alibaba Group Holding Ltd (BABA) are included, along with Brazil giants like Petrobras SA (PBR) and Vale S.A. (VALE) in the top ten holdings.
Chinese and Taiwanese companies are featured prominently, together representing 45% of the fund, reflecting the size of those respective equity markets. Brazil stocks at 12%, India at 11%, and South African at 5% of the fund round out the top 5 countries by geographic exposure.
Where the impact of the fundamentals factor strategy is most visible, is likely the sector breakdown. Relative to the EM benchmark, FNDE is overweight in the Financials sector while underweight in technology.
FNDE vs EEM
FNDE uses the MSCI Emerging Markets Index as its benchmark, which we proxy through the iShares MSCI Emerging Markets ETF (EEM). There are key differences worth highlighting.
First, the fund has a smaller number of holdings at 389 compared to 2220 in EEM. In this case, while FNDE and EEM share many of the same stocks among top holdings, FNDE essentially excludes the smallest emerging market stocks that rank poorly in the factor methodology.
FNDE is a bit more concentrated, but there is a case to be made that the allocation is spread out across a larger core group of stocks that have on average stronger fundamentals.
This is confirmed by the Schwab data showing the FNDE portfolio maintains an average price-to-cash flow of 3.6x compared to 6.3x for EEM. Similarly, FNDE’s price-to-earnings ratio of 7.4x is at a discount compared to the 11.5x level in EEM. In other words, FNDE has a relative “value” tilt compared to EEM.

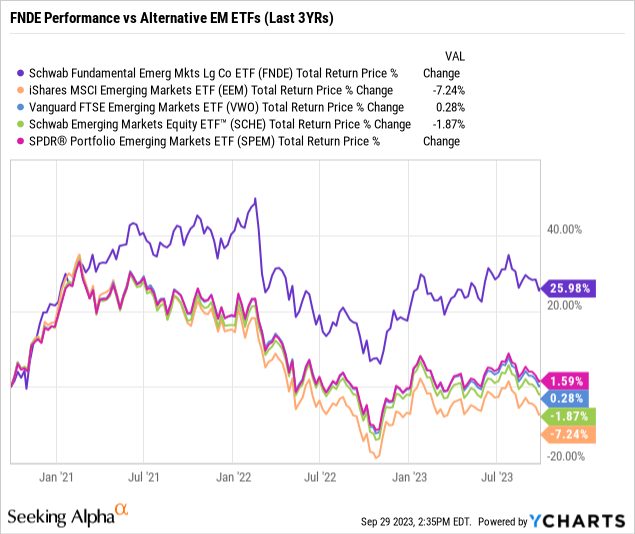
Favorably, this strategy has paid off, considering FNDE has delivered a stronger return over EEM not only in 2023 but also over the past decade.
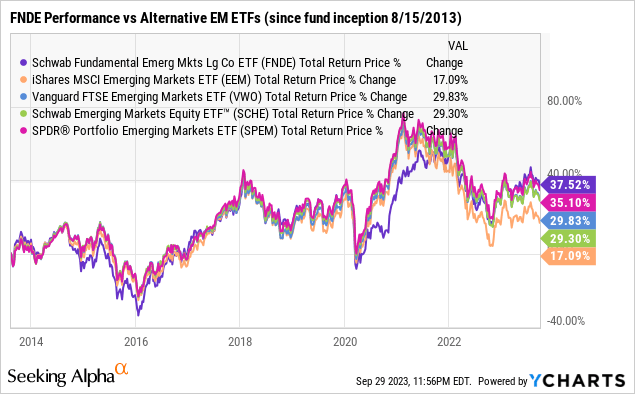
Since the fund’s inception date in 2013, FNDE has delivered a cumulative return of 37.5%, which is above the return of comparable EM ETFs like the SPDR Portfolio Emerging Markets ETF (SPEM), Vanguard FTSE Emerging Markets ETF (VWO), as well as opening an 820 basis point spread to the broader Schwab EM Equity ETF (SCHE).
Our explanation here is that the fundamental screen utilized by FNDE results in a higher-quality portfolio that can work well through various market cycles. It’s true other EM strategies exhibited a stronger performance at certain times, but the strength in FNDE as we see is its more balanced approach.
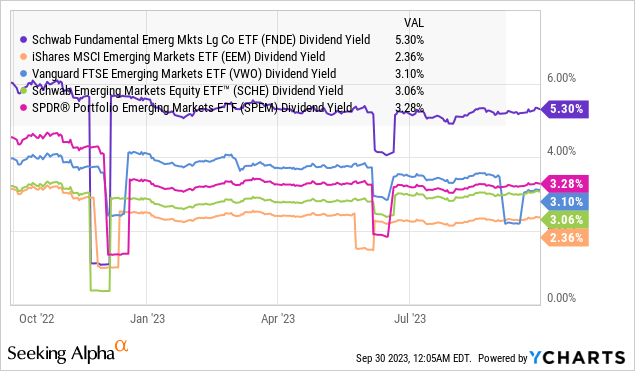
The other advantage of FNDE is its wider dividend yield, currently listed at 5.3%, and above the segment average close to 3%. Again, the value profile appears to shine in emerging markets.
What’s Next For FNDE?
The investing backdrop is currently clouded by several macro headwinds and financial market uncertainties. Interest rates at multi-decade highs, alongside lingering inflationary pressures, and restrictive policy have all resulted in significant volatility across all asset classes.
Still, what we like about emerging markets is a sense that there is room for conditions to improve going forward. A scenario where inflation continues to cool in developed markets between the U.S. and Europe could provide some confidence for Central Banks to back off from an aggressively hawkish stance. Interest rates stabilizing lower could be enough for a correction in the Dollar as a catalyst to kickstart a new round of global growth.
Here we believe emerging markets, particularly the companies within the FNDE portfolio, would be well-positioned to benefit. On this point, China will be the key to leading higher with its importance in trade across smaller emerging markets.
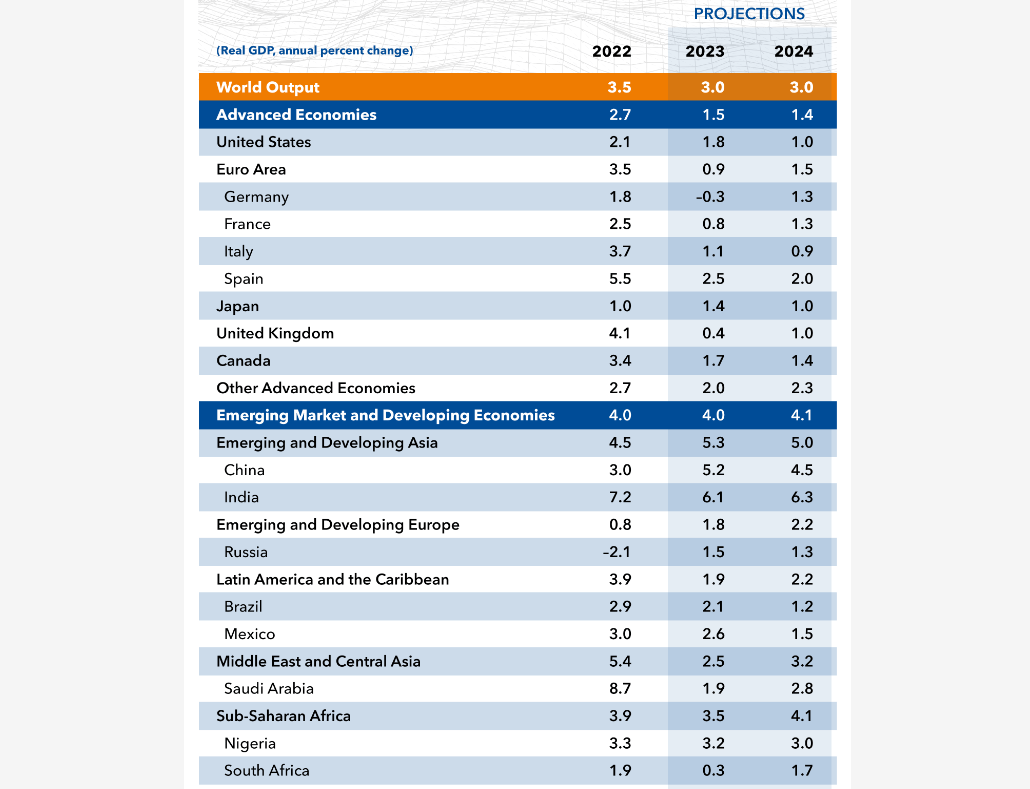
According to the International Monetary Fund (IMF), the group sees 2024 emerging markets GDP growth at 4.1% and well above the 1.4% trend in advanced economies. We make the case that there is an upside to these estimates with data over the coming quarters confirming continued economic resiliency, leading to revisions higher. A boost in sentiment would go a long way to supporting more positive equity returns.
Covering the risks, several high-level developments would be seen as bearish to the outlook and pressure EM stocks into another leg lower. The potential that inflationary re-accelerates higher would likely propel interest rates to keep climbing and add to financial market pressures. Similarly, a significantly stronger U.S. Dollar would pressure growth globally as a headwind for EM stocks.
Final Thoughts
Emerging markets often get overlooked in the conversation of building a diversified portfolio. This is a market segment we believe can perform well over the next several years into what could evolve as a new bull market.
Recognizing the ongoing risks, we believe FNDE is the best EM ETF, as its fundamentals-based strategy adds a layer of quality to the portfolio that has been proven to help it outperform. The current level appears like an attractive entry point for long-term holding and an outlook to generate positive annual returns.

Enjoyed this article? Sign up for our newsletter to receive regular insights and stay connected.