
For an asset class sometimes considered unexciting, the bond markets have been anything but dull in 2023. Bank failures, a hawkish Federal Reserve (Fed), disinflation, and higher yields have all contributed to a year of heightened volatility and significant opportunity across the fixed income landscape.
FOMC September Policy Meeting – Another Pause
Following the Federal Open Market Committee (FOMC) meeting held September 19-20, the Fed decided to pause its hiking campaign once again. Citing restrictive monetary policy and the delayed impact of previous rate increases, the committee concluded it would “proceed carefully” when determining the need for further tightening. FOMC “dot plot” projections now call for one additional hike in 2023, followed by a more gradual set of cuts beginning in 2024, as shown in the table below:
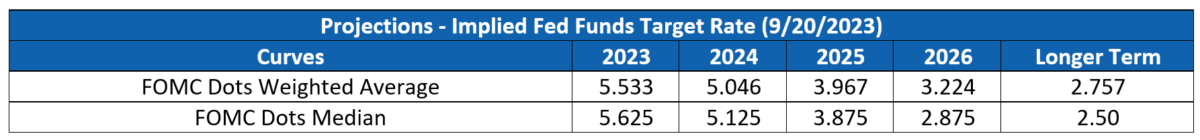
Source: Bloomberg. Past performance is no guarantee of future results.
This sentiment is mirrored by Bloomberg’s interest rate probability model. The futures market is now pricing in a 53% chance of one additional 25 basis point hike in 2023, and expectations for significant policy easing in 2024 have dropped.
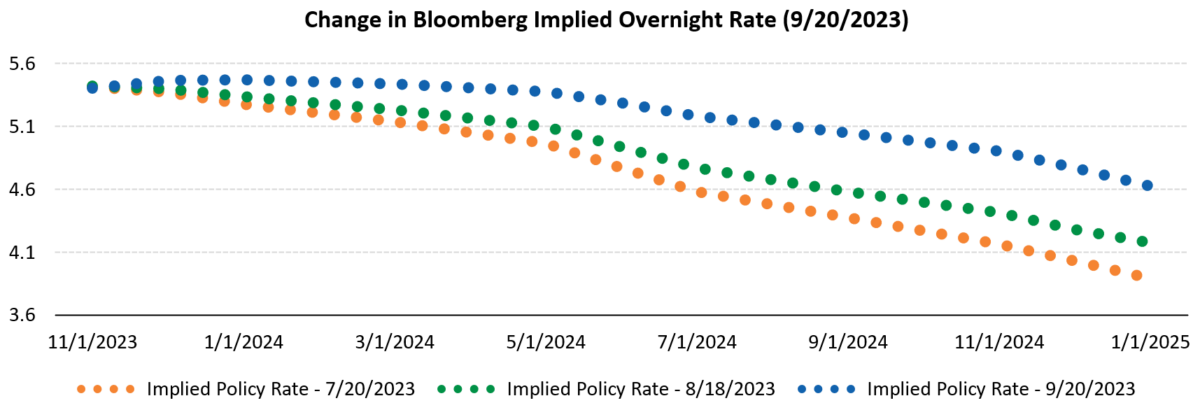
Source: Bloomberg
While shifting rate projections highlight the uncertainty of future monetary policy, we continue to believe we are nearing the end of this hiking cycle. This thesis was reinforced by Jerome Powell in his post meeting press conference, when he stated, “We’re fairly close, we think, to where we’ll need to get.” For now, a transition from “how high can rates go” to “how long they can stay elevated” appears to be well underway.
Fixed Income YTD Performance Summary
Apart from the broad Treasury index, returns across most fixed income asset classes are positive for the year. Significant outperformance was seen in high yield bonds, a sector that is traditionally highly correlated with equities, followed by corporate and agency bonds. The chart below, “YTD Total Return,” provides the year to date (YTD) return summary for some major ICE BofA bond indexes.
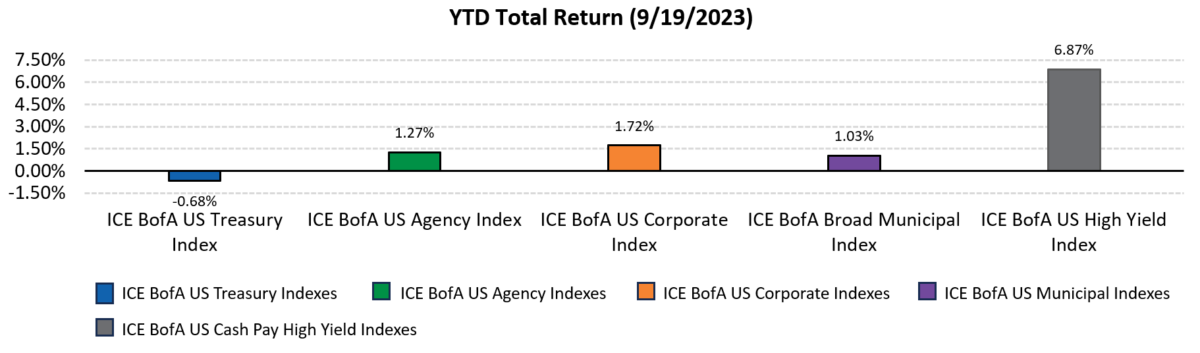
Source: ICE BofA Indexes, Bloomberg. Past performance is no guarantee of future results.
Short duration also broadly outperformed intermediate and long, largely driven by lower sensitivity to the Fed’s rate increases. This illustrates the importance of diversifying across maturities while also highlighting the ballast shorter bonds can provide fixed income portfolios in volatile markets. The chart below, “YTD Total Return,” provides a YTD return summary, broken out by maturity band, for some major ICE BofA bond indexes.
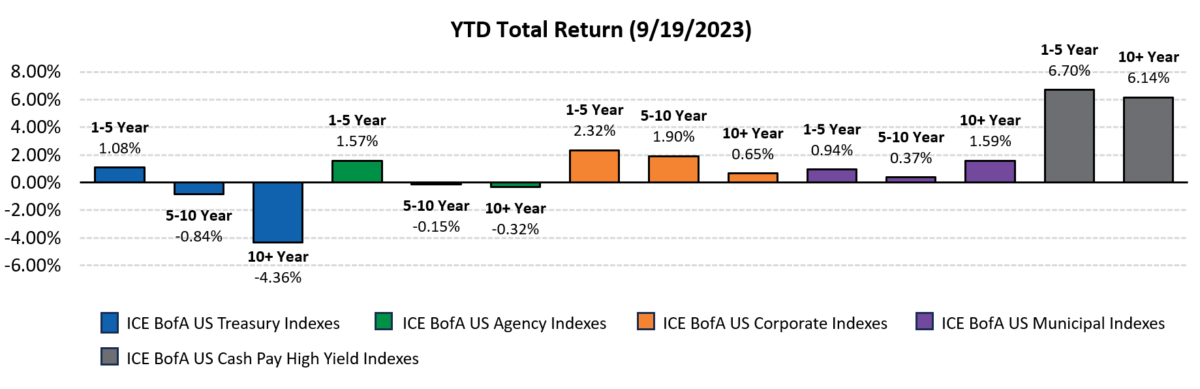
Source: ICE BofA Indexes, Bloomberg. Past performance is no guarantee of future results.
Fixed Income Yield Summary
Yields across fixed income asset classes and maturities remain attractive. Reiterating our call from previous Dynamic Bond Market Updates, we believe now is an exciting time to look at the bond market. The chart below, “Yield to Worst,” summarizes the current yield of various ICE BofA indexes, broken out by maturity band.
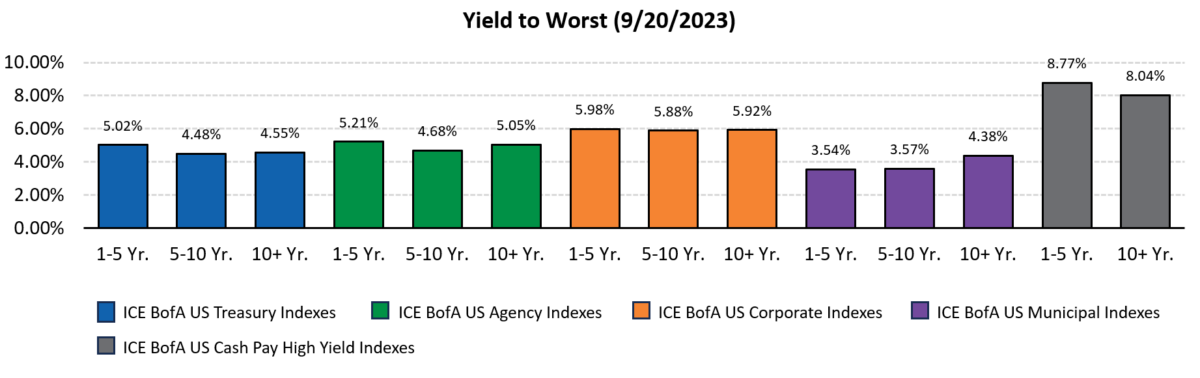
Source: ICE BofA Indexes, Bloomberg. Past performance is no guarantee of future results.
A prudent approach to fixed income investing calls for diversification across both credit and duration exposure. As always, Dynamic recommends staying balanced, diversified and invested. Despite short-term market pullbacks, it’s more important than ever to focus on the long-term, improving the chances for investors to reach their goals.
Fixed Income Symposium Set Ahead of Next FOMC