
TIPS (Treasury Inflation-Protected Securities) yields have risen recently, with the 10-year coupon reaching 2.07%, the highest since 2009.Enormous Federal debt and history suggest inflation will remain sticky and higher than the Fed’s target, but consumer expectations and bond market indicators point to tame inflation.The base case scenario suggests TIPS returns could range from 6-7% per year over the next decade, while CAPE suggests S&P 500 returns of 5.5%.
in my all-weather portfolio article series, I included a healthy allocation to TIPS. That is based on the idea that an all-weather portfolio should contain assets that do well in different financial environments, including inflation, disinflation, and deflation.
Last December, Why TIPS Performance Could Rival That of the S&P 500 Over the Next Decade, a Seeking Alpha Editor’s Pick, explained why TIPS could earn 5-6% per year. That compared to S&P 500 expected returns at the time of 4-7% per year. A lot has happened since. The S&P is up 15% YTD and TIPS yields have risen. Here we revisit the outlook with a focus on TIPS.
Recent TIPs Returns and Rates
TIPS returns are comprised of the coupon, or real rate set at auction, plus the realized rate of inflation over the holding period.
First the bad news: for those who bought TIPS early last year, the market value of their principal has declined. At the beginning of 2023, with inflation running at an annualized 6.5% and real yields of 1.2%, investors were earning a juicy 7.7%. Yet total return on the TIP ETF so far this year is only 0.19%. That’s due to rising interest rates and the duration effect (6.54 years) which effectively wiped out the yield.
The certainty (barring government default) of a return of the original principal value is one reason I noted in TIPS Funds vs. A Ladder why I prefer to buy individual TIPS and hold them to maturity. Of course, for those who don’t, rising rates can lead to capital losses when liquidating on the secondary market.
The good news for prospective TIPS investors is that 10-year coupon on the secondary market has risen to 2.07% as of this writing. At last week’s 9-year, 10-month TIPS reopening auction, the real yield to maturity of 2.094% was the highest for any auction of this term since 2009.
For those who prefer to own an ETF, the real yield on BlackRock’s TIP is 2.53%. Tacking on inflation produces an SEC yield of 5.28%.
History Suggests Inflation May Remain Sticky
Now let’s turn to the question of inflation. In my previous article, I described why inflation could remain stickier than expected in coming years. Research Affiliates pointed out that when inflation exceeded 8%, which it did after the pandemic onset, reverting to 3% usually took 6 to 20 years. The median time was over 10 years.
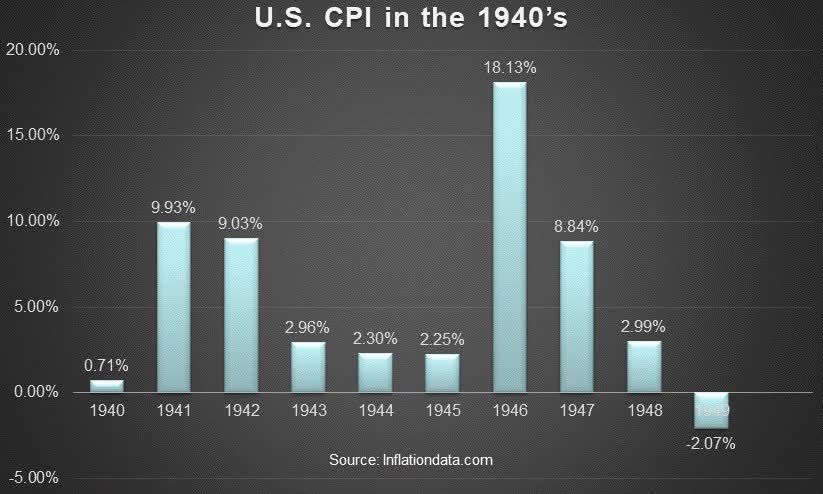
The expectation for higher inflation is further supported by the analogous experience of the 1940s. At the time the government was dealing with gigantic borrowing to fund World War II. Federal debt to GDP reached a record 110%. Today, pandemic borrowing has catapulted us above that, with the ratio at 120%.
In the 1940s the Fed enacted yield curve control and held rates artificially low to monetize the debt. As a result, bondholders experienced negative real returns. Inflation ran hot, averaging 5.5% per year. However, that number doesn’t tell the whole story. CPI was volatile, ranging from -2% to 18%. There were six years with CPI below 3%, including deflation in 1949. In four of the years, inflation exceeded 8%.
The most recent BLS report showed 12-month trailing headline CPI at 3.7% and core inflation (excluding energy and food) at 4.3%. That compares favorably to the annualized rate of 6.5% at the end of 2022. Given the Research Affiliates data, this is extraordinary progress.
Now the big question is what lies ahead? Will we continue to see benign disinflation and reach the Fed’s 2% target? Or will we relive the 1940s with volatile and higher than average inflation? Or perhaps we will see the 1970s inflation?
Consumers and the Bond Market Are Expecting Tame Inflation, But Ray Dalio Doesn’t Believe Them
The August 2023 Federal Reserve Bank of New York Survey of Consumer Expectations showed inflation expectations were largely stable. Median one and five-year inflation expectations were 3.6% and 3.0% respectively. The bond market’s implied, or breakeven, inflation rate over 10 years is currently an even more benign 2.45%. That is computed as the 10-year Treasury rate of 4.52% minus the 10-year TIPS coupon of 2.07%.
Ray Dalio made an interesting comment on the implied breakeven rate in his LinkedIn post last month, What’s Happening With The Economy? The Great Wealth Transfer:
In fact, if you were to believe the breakeven inflation numbers (which I don’t), the future inflation rates will go to the targeted inflation rates.”
Federal Debt Will Pressure the Fed To Be Accommodative
Will the Fed keep rates “higher for longer?” Let’s examine the implications of continued tighter policy. That path increases the likelihood of several adverse outcomes:
- Government debt crowding out private sector investment
- Burdensome tax increases to fund ongoing federal deficits
- Recession and economic hardship
- Declining corporate earnings and share prices
- Risk of accidents in vital financial sectors
- Undermining the dollar
Let’s dig into the first item. The chart below shows the exponential growth in government interest payments. The current annual run rate of nearly $1 trillion is more than double that of 2013. This demonstrates the compounding effects of accelerating debt growth combined with rapidly rising rates.
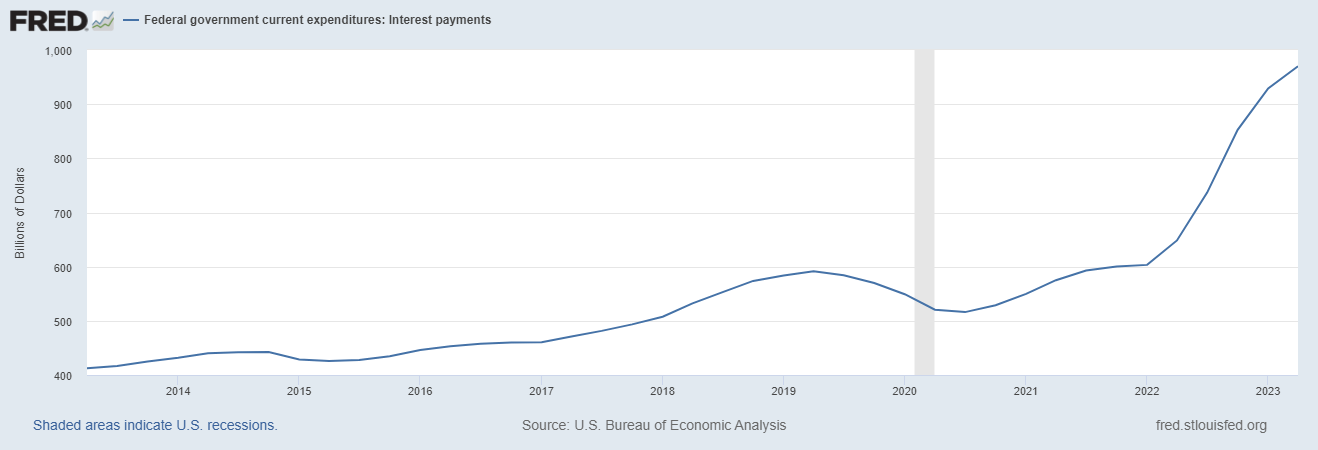
Yet, the full effects have yet to be seen. With $33 trillion in outstanding debt, current annualized interest payments of $970B translate to an average interest rate of 3%. According to NASDAQ, the average maturity of outstanding Treasury marketable securities is 62 months. As an example, if all debt matured in five years and was refinanced at the current five-year rate of 4.6%, it would add 1.6% to annual interest payments.
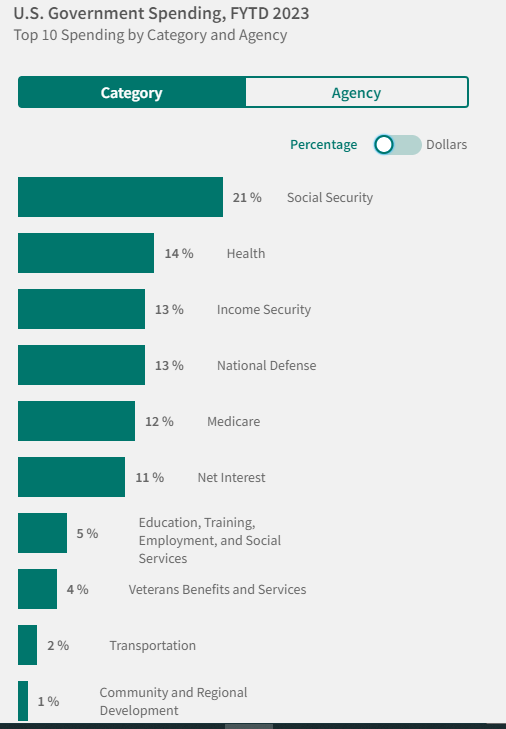
That would generate an additional $528B per year. Adding that to the existing budget would result in annual interest payments of $1.498 trillion! That is well above this year’s Social Security Budget of $1.12 trillion, equal to 21% of the total.
And that doesn’t factor in the growing debt base. The FY23 deficit is projected at $1.7 trillion, $200B more than forecast in May. If that annual level persisted, debt would grow by another $8.5 trillion in five years. A continuation of a 4.6% Treasury rate would tack on another $391B in annual interest payments. This would catapult interest payments even further above Social Security.
To be fair, all debt won’t be refinanced in five years. Nor do we know at what rate. But it’s clear there is strong upward pressure on the debt service burden. With foreigners lightening up on Treasurys and the Fed reducing its balance sheet, it will be increasingly harder for the government to borrow. That will also hamper the ability of politicians to incur ever-higher deficit spending.
Moreover, continuing federal budget battles further pressure borrowing costs. This week’s showdown is another in what has become business as usual in Washington.
All of this will pressure to the Fed to monetize the growing debt burden.
For those who doubt that debt and deficits don’t matter, and don’t eventually fuel inflation, I suggest reading the watershed book, This Time is Different: Eight Centuries of Financial Folly. The research on more than 66 countries over eight centuries demonstrates when debt reaches such levels where it cannot be paid off in today’s real dollars, governments invariably inflate their way out of it. That was the method employed by the United States in the 1940s when federal debt reached 110% of GDP. Today’s 120% level sets the stage for history to repeat.
Is Fed Policy Really Tight?
The most anticipated recession in history has yet to occur. But sentiment is shifting. Many economists now expect a soft landing. Perhaps the real reason for no recession is that policy isn’t tight. The reality is that the real Fed Funds rate is hardly restrictive. The chart below shows the 10-year real rate since 1980. In that context, today’s rate appears lower than average and well below inflation-fighting levels.
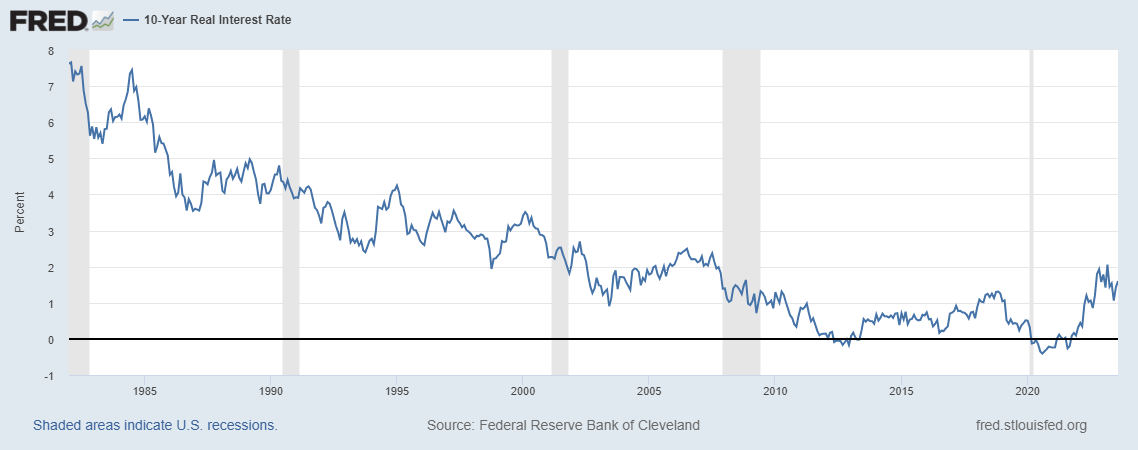
With Fed Funds at 5.3% (per latest FRED data) versus recent headline inflation of 3.7%, real short-term rates are 1.6%. That compares to the peak Fed Funds rate under Volcker of 22% and peak inflation of 13.8%. Then the short-term real rate reached 8%, more than four times today’s rate.
Long-term real rates are even lower. Today’s 10-year Treasury of 4.52% with 3.7% inflation produces a real rate of only 0.82%. That compares to the pre-financial repression era real rates of 2-5% from 1985-2002. For more historical perspective, see the article.
Indeed, the Fed itself projects the long-term neutral Fed Funds rate, or “r-star” of 2.5% with expected inflation of 2%, producing an expected real rate of only 0.5%. This further bolsters the attractiveness of a 2% long-term real TIPS yield.
Nonetheless, investors should be careful. Real rates could still move higher. Investors might be able to secure even more attractive TIPS coupons in the future. Those who buy now with the intention of selling long-term TIPS before maturity could face the prospect of capital losses.
Consider the Effect of Recession on TIPS Returns
To be sure, right now there are conflicting recession indicators and opinions. Gundlach expects a recession by the first half of 2024. Goldman Sachs puts a low 15% probability on it for the next 12 months.
However, the forecasting track record of most professional economists leaves much to be desired. As such I wouldn’t place much weight on any economic forecasts, nor venture my own guess. However, we may consider a few plausible economic scenarios and what they might mean for TIPS returns.
A Benign Scenario Could Produce Weak TIPS Returns of About 4%
The most benign scenario would be the oft-mentioned soft landing. Monetary policy’s impact on economic growth and employment could be muted. Improved and redesigned supply chains, a rise in labor force participation, controlled wage growth and a moderately growing economy could bring inflation down substantially without much more Fed tightening. Inflation could subside to a stable 2% for years to come.
In that scenario, TIPS returns would likely be very modest, at about 4% per year (2.07% coupon plus 2% inflation). According to AAII, “Building a Balanced Portfolio, An Unconventional Allocation,” during periods of falling inflation TIPS returns fell short of cash returns by 1.1% per year. With cash at about 5% now, a 4% total TIPS return would be a reasonable expectation.
A Deep Recession Scenario Could Lead to TIPS Returns of 7-9%
In this case, in the short term, it would be reasonable to expect disinflationary or even deflationary effects, dampening TIPS returns. However, unbearable economic pain would likely lead the government and Fed to follow their pandemic playbook. Massive spending outlays with direct payments to taxpayers and an extremely accommodative Fed-fueled double-digit inflation followed by persistent elevated inflation.
As a result, higher inflation would likely overtake any short-term TIPS price declines due to deflation. Those who buy individual TIPS and hold to maturity will earn the coupon plus the average inflation rate. The latter could average 5-7% per year for some time. By comparison, inflation averaged 6.8% during the 1970s. Therefore an average annual TIPS return of 7-9% for 5-10 years is possible. The high end of this range could even be exceeded if an even greater shock-and-awe stimulus program turbocharges inflation and tanks the dollar.
A Mild Stagflation Scenario Could Result in TIPS Returns of 6-7%
Ray Dalio summarized this:
Over the near term, if there isn’t a big supply/demand imbalance in which the amount of government debt sold overwhelms the amount of demand for these debt assets, it appears that a period of tolerably slow growth and tolerably high inflation (a mild stagflation) is most likely. Of course, there is a significant range of uncertainty around that because what we don’t know is greater than what we do know about a lot of influences (e.g., politics, geopolitics, the environment, and technology’s impact).”
This scenario might be characterized by inflation comparable to the 1940s, or 5.5%, with periods of rising inflation, disinflation and even deflation. A reasonable estimate would be average inflation of 4-5%. Those buying 2% yielding TIPS and holding for ten years could earn 6-7% per year. This is my base case scenario.
In summary, the scenarios above suggest TIPS returns could range from about 4-7% per year. But, as with all investing, there is a wide range of economic scenarios and plenty of uncertainty.
Now let’s briefly turn to the outlook for the S&P 500 Index.
CAPE Suggests Muted S&P 500 Ten-Year Returns
As I noted in previous articles, the Shiller P/E or CAPE ratio is useful as a gauge of expected long-term returns. However, CAPE has its limitations. The chart below shows CAPE has steadily increased over time. Therefore forecasts based on Shiller’s data series since 1871 have tended to underestimate future returns.
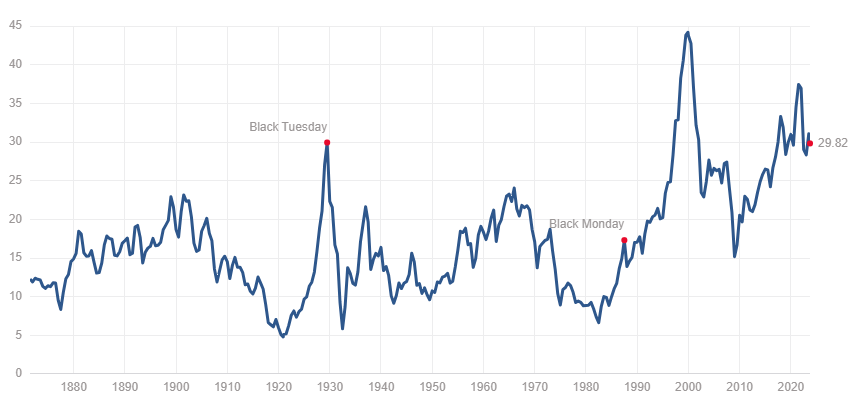
However, according to “The Remarkable Accuracy of CAPE As a Predictor of Returns,” if we use CAPE data from 1995-2020, the model’s accuracy is quite impressive.
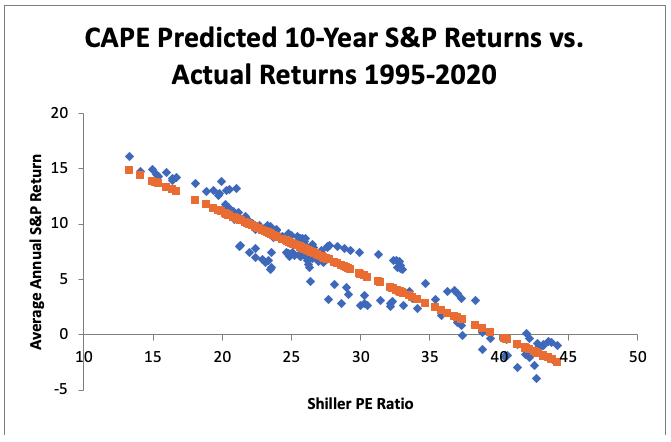
Since 1975 the Shiller CAPE has explained 85% of variation in future stock returns. Those data have accurately forecasted returns within +/- 1.37% for 67% of the time. Combining today’s CAPE value of 30 with those data indicates total returns of 5.5% per year over the next ten years. If inflation runs at the 1940s rate, real equity returns would be zero.
Conclusion: TIPS Are a Useful Component of an All-Weather Portfolio
Those who follow me know that I advocate an all-weather portfolio. I don’t bet on an expected economic or market outcome. Rather I invest in uncorrelated portfolio positions that together dampen volatility across market cycles and perform well regardless of the scenario.
My model all-weather portfolio carries a 25% allocation to inflation-protected securities, including I-Bonds. For those interested in implementation ideas, you may wish to read my SA Editor’s pick, TIPS Funds vs. a Ladder.
TIPS provides portfolio diversification benefits given their low correlation to equities. And they serve as a useful, albeit imperfect, way to protect against inflation. Since TIPS are as close as it gets to a risk-free asset, buyers of individual bonds may earn better risk-adjusted returns than the S&P.
However, it’s possible that a benign or even deflationary scenario could lead to weak TIPS returns. Uncertainty and volatility require patience and resolve.
I look forward to your comments.
Enjoyed this article? Sign up for our newsletter to receive regular insights and stay connected.