
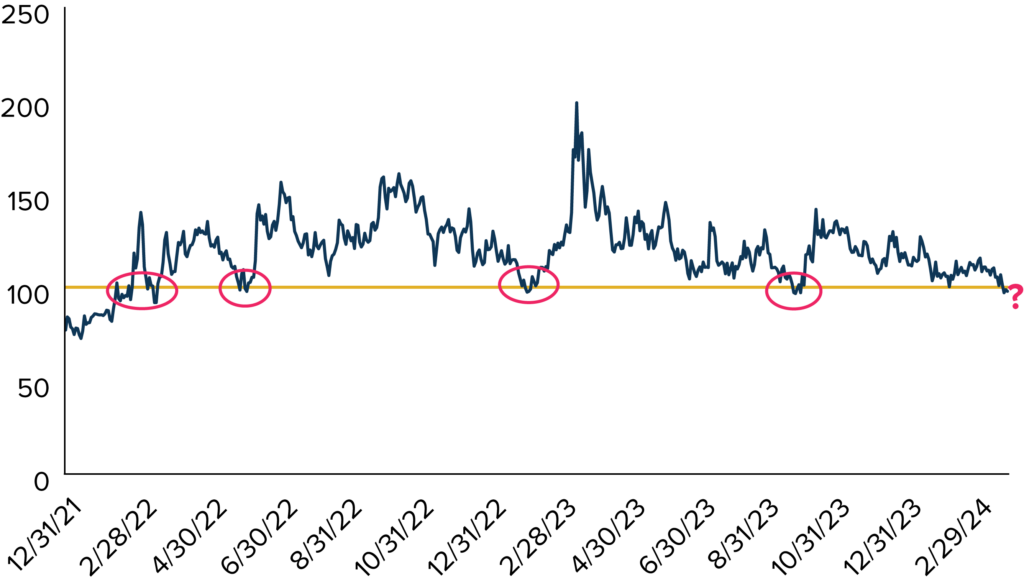
Volatility in the Treasury bond market is once again flirting with its recent lows. That could be good news—or it could be the forerunner of a bumpy road ahead.
As seen in the chart, the Merrill Lynch Option Volatility Estimate Index (ICE BofAML MOVE Index)—which measures the expected volatility of yields among Treasury bonds—fell below 100 last week (to around 98) and is hovering near its lowest level since September 2023. Greater stability in Treasury yields can boost confidence and clarity among equity investors about stock valuations, which can then help support higher stock prices.
Indeed, bond volatility’s recent path lower—realized volatility in interest rates on both the 10-year Treasury and the 2-year Treasury are close to their lowest levels since 2020—has been accompanied by a robust equity market.
Enjoyed this article? Sign up for our newsletter to receive regular insights and stay connected.