
An airline passenger prepares for an international journey
Images By Tang Ming Tung/DigitalVision via Getty Images
The world is nearing the four-year anniversary of the beginning of the covid-19 pandemic that crippled large portions of the world’s economies but targeted no sector more than the passenger airline industry. While some countries like the U.S. didn’t impose nationwide restrictions on movement as severe as other countries and saw an earlier return of travel, the global airline industry was right to say it faced an unprecedented event that would shape it for years to come. Most of the world is now somewhere in the second year of the return of air travel demand which means that all of the problems from shutting down air travel are close to being addressed and there is a return to normality in the airline industry, or at least it can be seen, even if there is a new type of normal.
Investors fled from airlines during the pandemic and they have been slow to return; airlines trade at substantial discounts to their pre-covid valuations. While no two airlines have developed identical recovery strategies, there are ample signs that the industry collectively is executing one of its strongest recoveries. The JETS ETF provides a means by which investors can re-enter airline industry investing, maximizing the collective benefits of the industry while minimizing exposure to company-specific weaknesses.
JETS ETF – an airline industry sampler
In order to analyze the JETS ETF, it is necessary to understand the underlying stocks in it. This graphic from the U.S. Global ETFs website helps understand easily how the fund is constructed. Each of the big 4 U.S. airlines constitutes approx. 9% of the total fund, followed by groupings of the next largest U.S. and Canadian airlines, U.S. and Canadian travel-related companies including internet travel sites, civil aircraft manufacturers, and airports, and then similar groupings of international airlines and non-airline companies. Because the fund is heavily weighted toward U.S. airlines, a composite understanding of industry dynamics is essential, helping to offset company-specific performance. The JETS portfolio is weighted to the global airline industry’s largest carriers including the big 3 U.S. global carriers which are each the largest in the global industry in one or more metrics. Southwest is the most successful low-cost carrier and has become the model for dozens of other airlines around the world. In addition, both Airbus and Boeing as well as other aerospace companies are part of the fund. The largest companies in the portfolio have decades of experience within the industry and their size reflects each company’s ability to adapt to changing and challenging situations; each of the big 3 U.S. global carriers trace their roots back nearly 100 years while Southwest is the template for low-cost carriers worldwide.
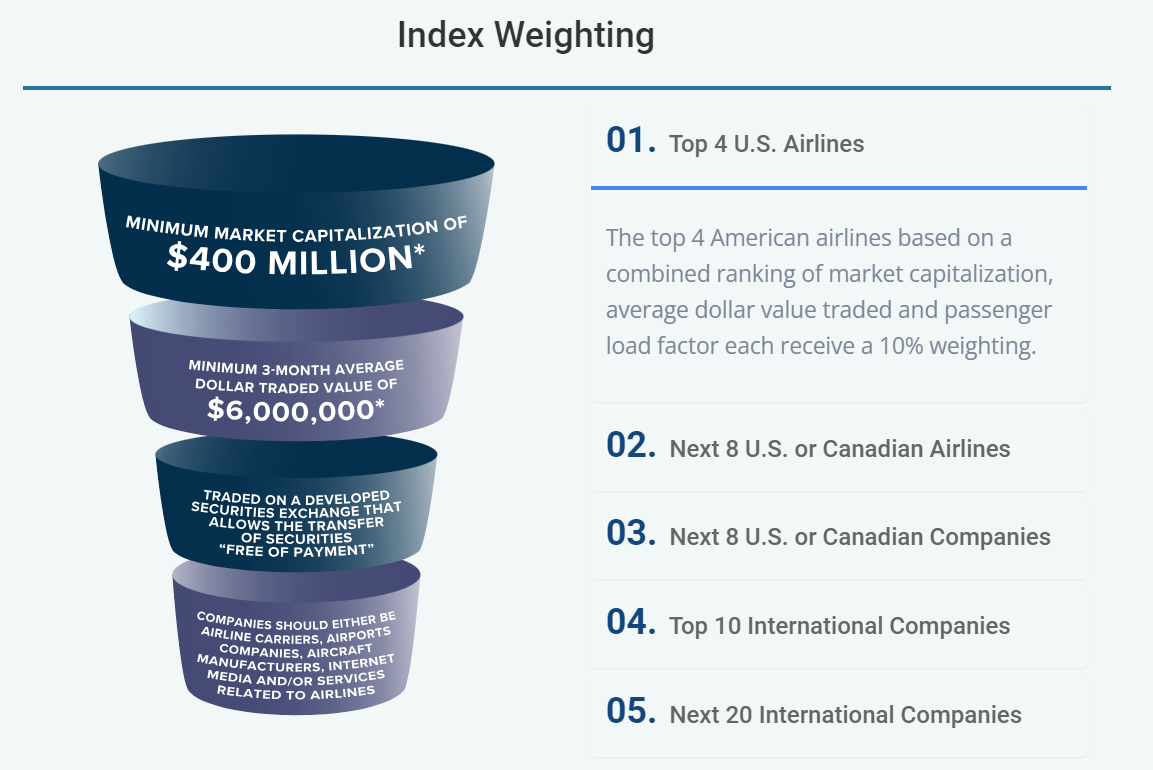
JETS index weighting (US Global ETFs)
We also need to address investor perception of the airline industry. Many airlines continue to be viewed simply as trading stocks and yet the top holders of the big 4 U.S. airlines’ stock are institutional investors who have held their stock on a long-term basis. Even for retail investors, the ability to record gains from airline stocks is a function of timing; like every other publicly traded company, airlines have generated stock gains that match and sometimes have exceeded broader market indices but they also have fallen greater than those indices. It is more accurate to say that airlines – and thus the JETS ETF – have stronger gains and deeper losses than many industries, a pattern typical of cyclical industries. The success of investing in airlines and the JETS ETF is timing – knowing when to hold ‘em and when to fold ‘em.
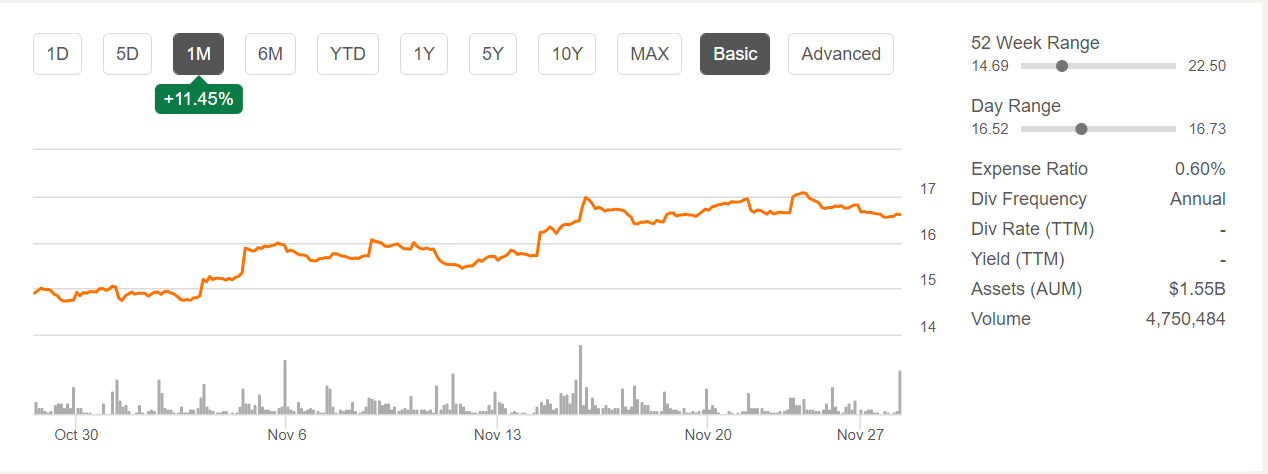
JETS chart 27Nov2023 (Seeking Alpha)
Next, it is worth looking at the performance of the JETS ETF. Over the past year, JETS, which is down by 9.7%, outperformed American (AAL), Southwest (LUV), and United (UAL) but underperformed Delta (DAL) which logged a 2.9% gain. Over the past month, JETS’ 9.7% gain beat LUV but slightly underperformed AAL, DAL, and UAL. While relatively few airlines and other JETS companies pay dividends, the majority of companies in the portfolio do not. DAL pays a 10-cent quarterly dividend while LUV’s dividend for the same period is 18 cents. Latin carrier Copa CPA pays an 82-cent quarterly dividend for a 3.49% forward yield.
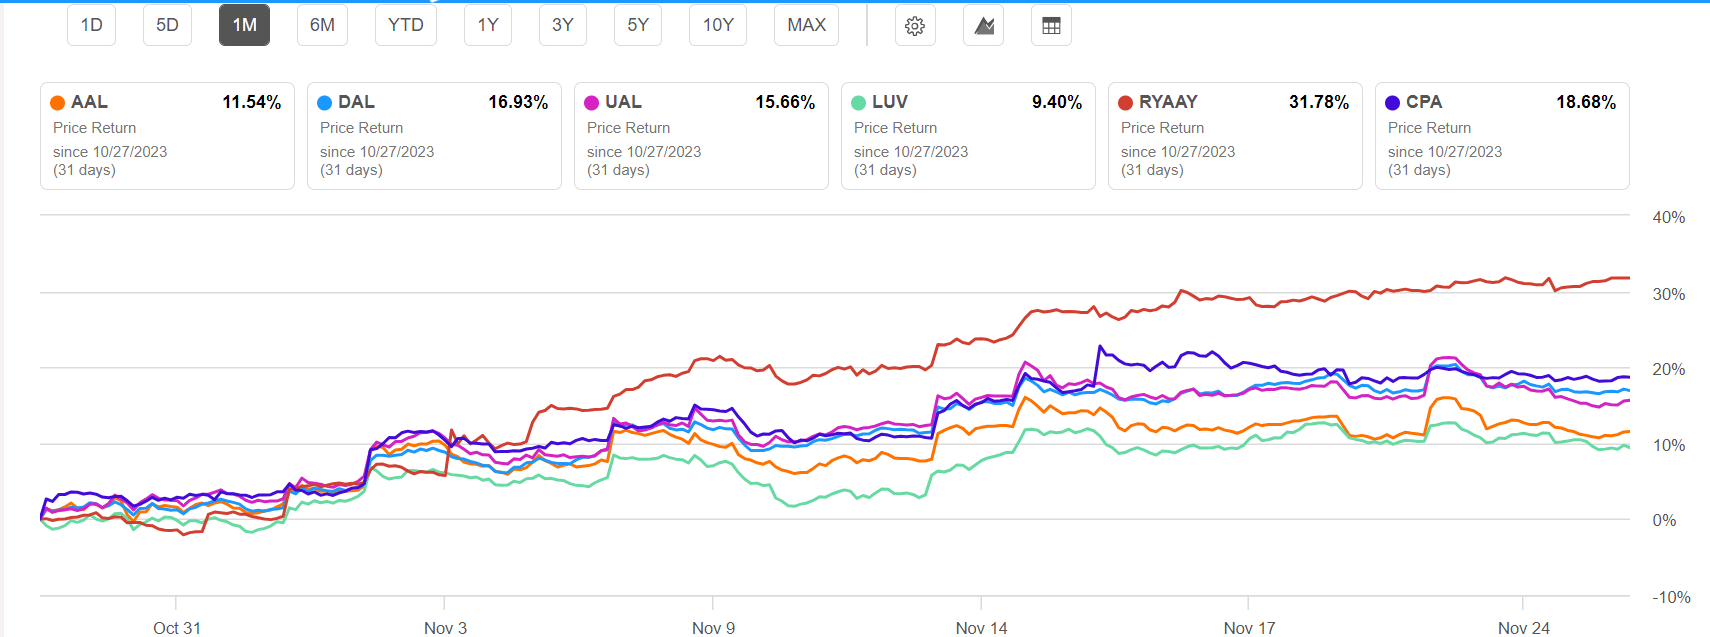
JETS select 1-month chart (Seeking Alpha)
Macroeconomic Influences
Investor sentiment toward airline investment is heavily shaped by macroeconomic factors. Historically, airlines have been some of the most sensitive to and earliest to see indicators of macroeconomic challenges since many airlines accept bookings 11 months in advance. Just as shipping companies provide a bird’s eye view into business expectations for the economy, airline bookings provide consumers insight into the strengths or weaknesses of the economy. Passenger airlines, far more so than shipping companies, are highly sensitive to political disruptions including terrorism. The covid pandemic was a first-of-its-kind event for the passenger airline industry while benefiting shipping and air freight companies. The industry continues to try to reduce its exposure to global events and, remarkably, has been much less impacted by the Russian invasion of Ukraine and subsequent war as well as the current war between Israel and Hamas than from previous geopolitical events. Nonetheless, the continual possibility of geopolitical instability poses a risk for the aviation industry, offset in the JETS ETF by the disproportionate focus on U.S. airlines which enjoy the largest domestic market in the world.
In the post-covid recovery period, there remains uncertainty about the impact of the strategies that many governments used to minimize damage to their economies including the subsequent disruptions to labor, inflation, and increased interest rates. There is growing hope that the soft landing that the Fed and many economists want might actually happen in the U.S. While the current Christmas buying season will be indicative of the continued strength of the U.S. consumer-driven economy, airlines around the world have generally reported that demand is valued at near pre-covid levels or is close to it. As I note in the industry-specific commentary on revenue below, airlines are increasingly able to distance themselves from macroeconomic factors which should lead investors to consider industry-specific metrics much more so than the macroeconomic factors which have historically been airline stock price movers.
Airlines are also highly susceptible to fuel prices and one of the strongest correlations exists between the movement of crude oil prices and airline stocks. There continue to be considerable differences in the outlook for petroleum prices and even OPEC and global producers are continually adapting to changes in oil prices. Just a few months ago, analysts were guiding to crude oil prices in the $100/bbl range even though it has spent more of the year within 5% of its year-ago value of $78.With the possibility of jet fuel prices based on crude oil prices below $80/bbl into 2024, airlines around the world will benefit from fuel costs below recent guidance for a number of airlines.
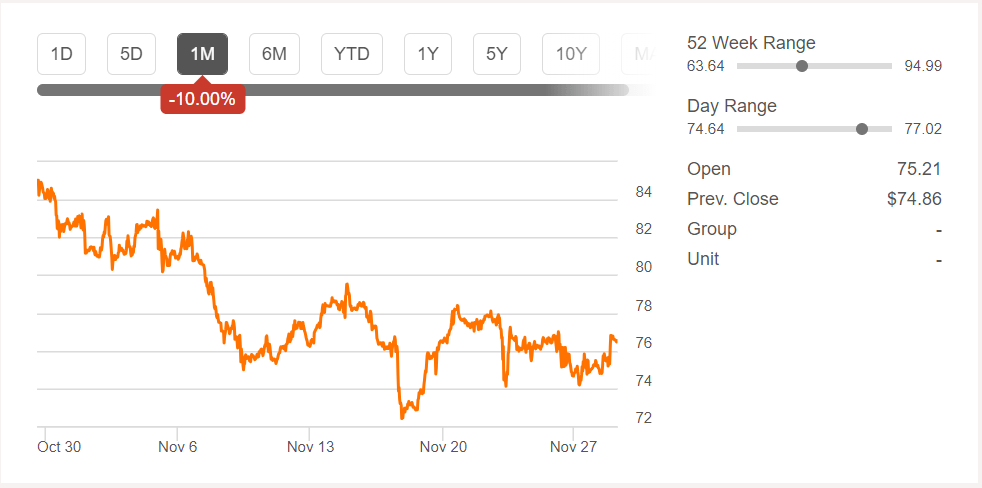
Crude Oil 28Nov2023 (Seeking Alpha)
Since airlines cannot directly use crude oil, the jet fuel crack spread, or cost to refine a barrel of crude oil into jet fuel, is an important consideration. Most airlines have no control over the jet fuel crack spread since it is related to the demand for products other than jet fuel and decisions that refiners make about how to allocate those resources in the refining process. The jet fuel crack spread historically has been about $15/bbl, soared to triple that amount but is settling back into the $25/bbl range, again with the likelihood of stability through the northern hemisphere winter. When airlines update their guidance in the next few weeks as they are expected to do, there is a good possibility that they will report fuel cost guidance on par with and possibly lower than their previous guidance, a departure from trends seen during much of the covid travel recovery period.
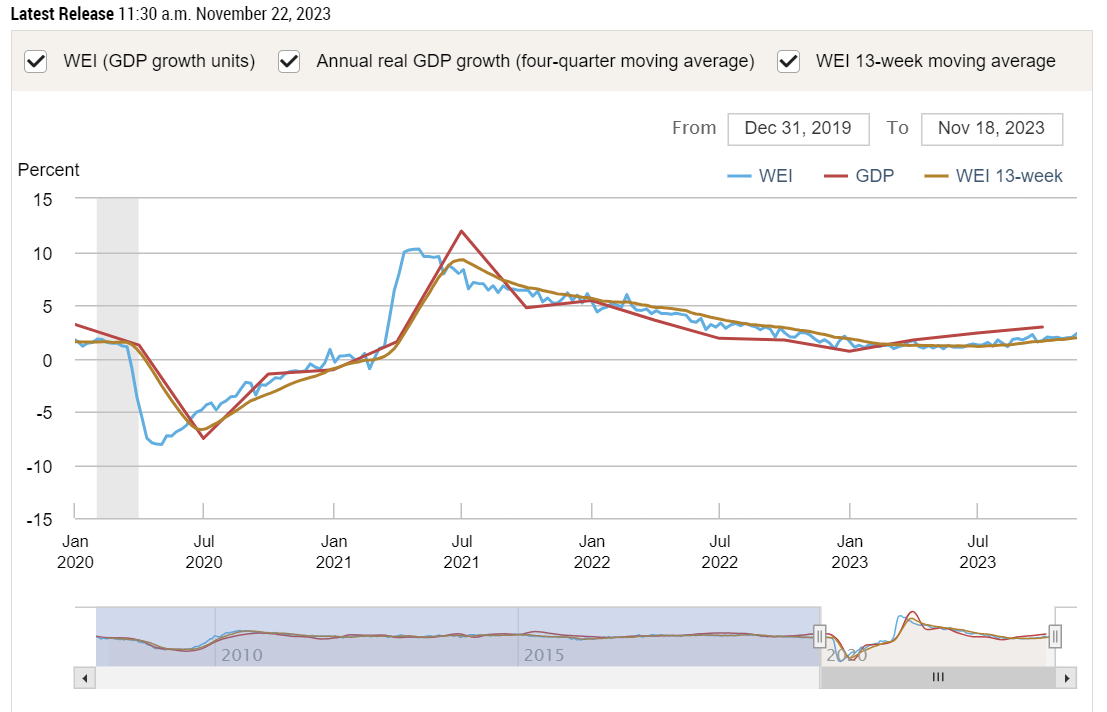
Weekly Economic Indicator (Federal Reserve Bank of NY)
In shifting our focus from macroeconomic factors, even those that directly influence airlines, the basics of business provide a helpful guide in understanding prospects for the airline industry with a look at revenue, cost, and balance sheet issues.
Global Airline Revenue Strength
The U.S. Transportation Security Administration said that it screened more passengers on Sunday, November 26, 2023 than any other day in history, indicating that leisure demand is strong and Americans at least are very much willing to travel; similar trends are being seen in other parts of the world. Although data from other forms of travel are not yet available, airlines were not the only transportation entities that saw very high consumer-related holiday demand, and that trend is expected to continue not just into the Christmas/winter holidays but also into 2024. However, outside of holiday periods, airlines are increasingly falling into two camps from a revenue perspective: those that service international markets and have strategies to increase revenue beyond commodity transportation levels and those that are focused on discount transportation and are largely domestic-focused. While those trends are most pronounced in the United States, similar trends are being seen worldwide. Although analyst commentary during the pandemic was that low-cost carriers would have an advantage, that never developed in part because low-cost carriers remain low cost because of their ability to grow and the covid pandemic upended the growth process through labor and supply chain challenges and because legacy/global carriers aggressively competed for the same domestic discount passengers that are the lifeline of low-cost carriers. Thus, the revenue outlook for the industry is tied to capacity growth at the carrier type level. On a global basis and even more so in the United States, it is now global/legacy carriers that are growing faster than low-cost carriers not just on a percentage basis but also on an absolute basis. Legacy/global carriers are tapping into a strong international market as well as increasingly sophisticated revenue management techniques and popular and profitable loyalty programs that have allowed them to win and retain customers in highly competitive domestic markets and sell higher-priced services than low-cost carriers. The Apollo Academy and Airlines For America provide helpful data on the global airline demand picture.
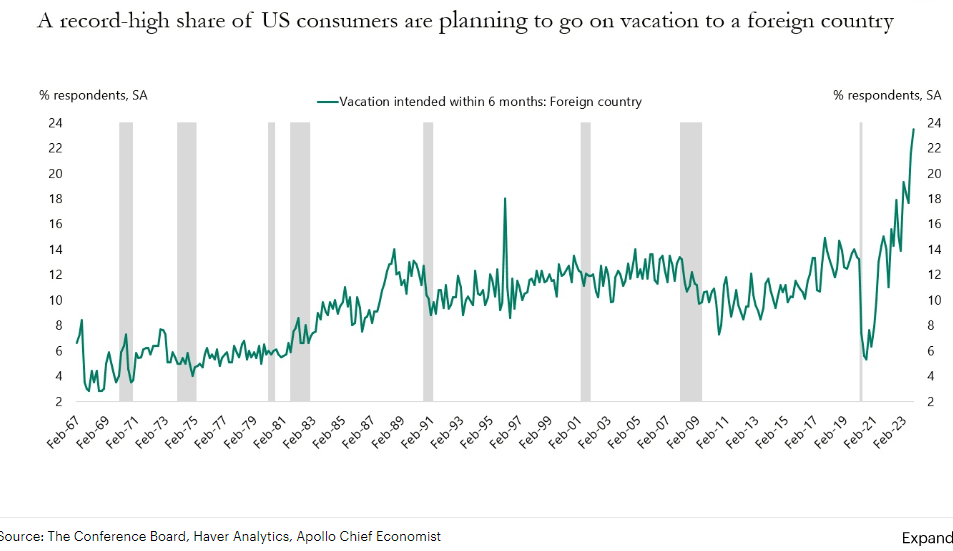
Consumer intent for Foreign Travel (ApolloAcademy.com)
The strength of the international market is being driven by increasing globalization and long-distance immigration as well as by a growing number of leisure passengers that are seeking to travel. Data shows that the intent to travel internationally continues to grow in the U.S., outpacing consumer product spending. Because of the sheer size of the U.S. travel market, U.S. global carriers like Delta and United which have had aircraft available to respond to international market growth, and because of joint ventures with foreign carriers, the impact of a shift to international travel is being felt around the world.
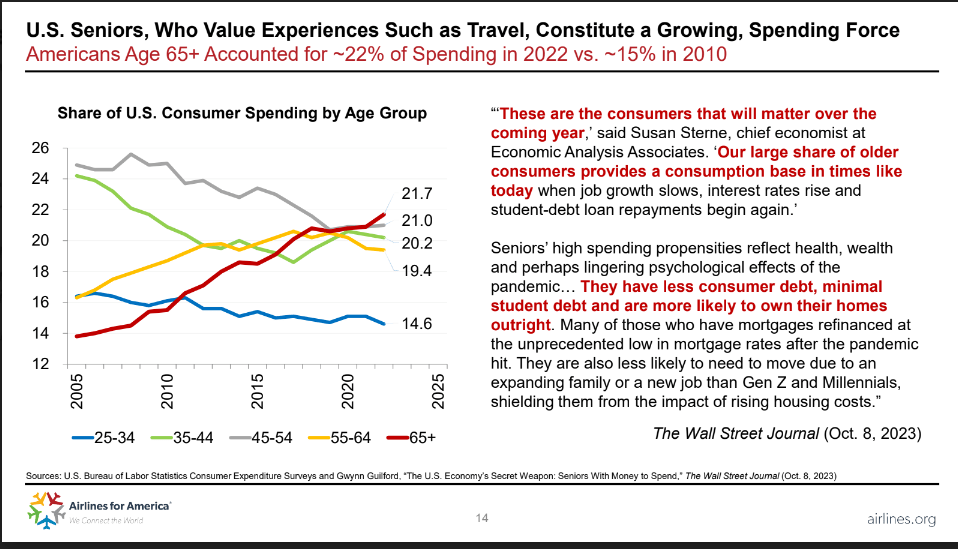
Senior travel is increasing (Airlines for America)
Demand growth is not equal across all countries, however. The largest travel markets to and from the United States are Canada and Mexico; while most low-cost carriers serve leisure destinations in Mexico, the large Mexico City market as well as Canada is largely the domain of legacy/global carriers. Further from home, European markets traditionally have a fairly balanced number of passengers originating in the U.S. as well as in Europe but the strong dollar is tilting the market in favor of American travelers while depressing the viability of the U.S. as a destination for Europeans. The stronger dollar is also extending the travel season with Americans more willing to travel deeper into the winter and earlier in the spring when travel from the U.S. is typically depressed. Many airlines are now offering their peak transatlantic schedules for five or six months of the year with their most off-peak schedules lasting for as few as two months.
Generationally, older Americans are traveling more and are resulting in higher travel rates for their demographic than for younger consumers because they have accumulated the possessions they have desired and have higher levels of disposable income. Similar demand patterns exist for work from home (or anywhere else except the office). While the number of remote workers soared during the pandemic, the percentage of work that is performed remotely – either on a permanent remote or hybrid basis – is expected to settle at levels three to four times higher than existed pre-pandemic. Since workers who are able to work remotely are typically higher income and already likely to travel more, the compound effect of increased travel will be with the most affluent passengers.
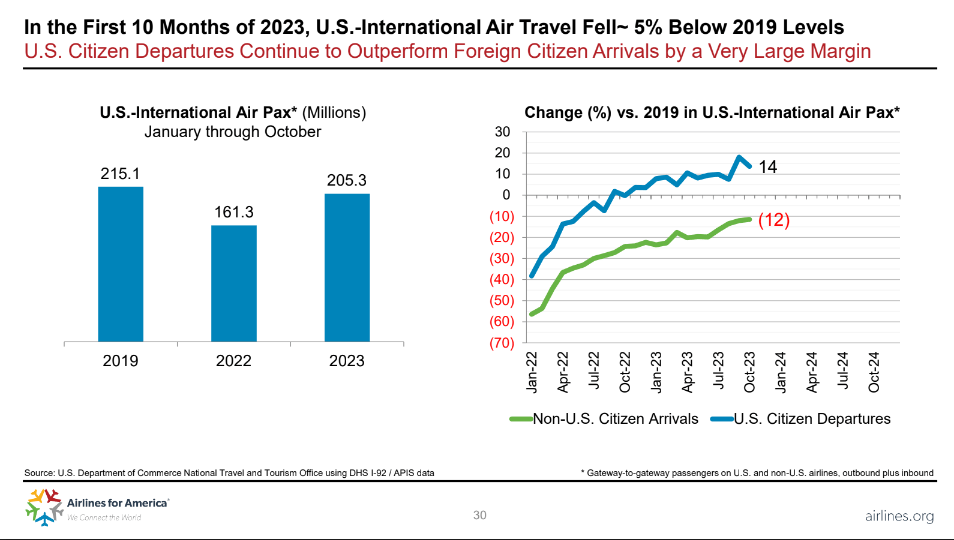
US Foreign Arrivals and Departures (Airlines for America)
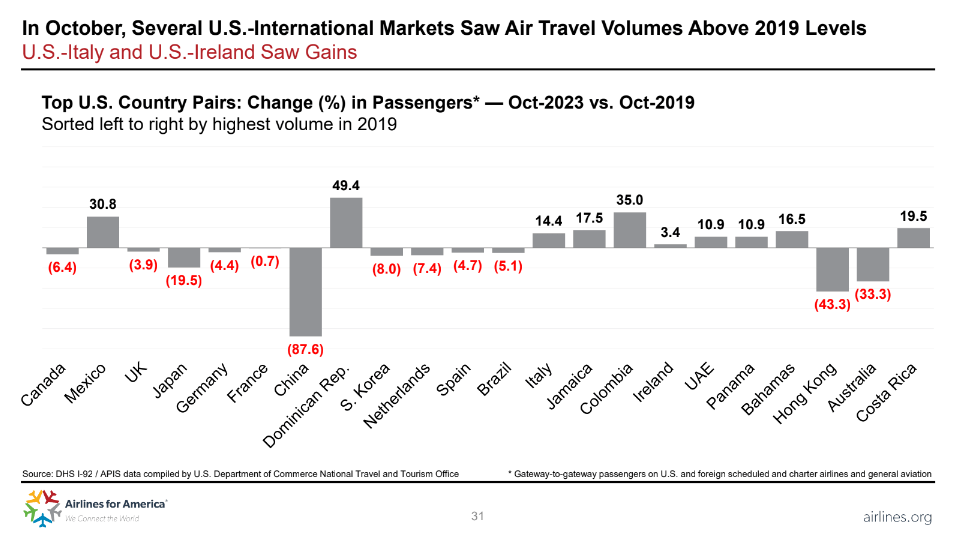
US Foreign travel by country (Airlines for America)
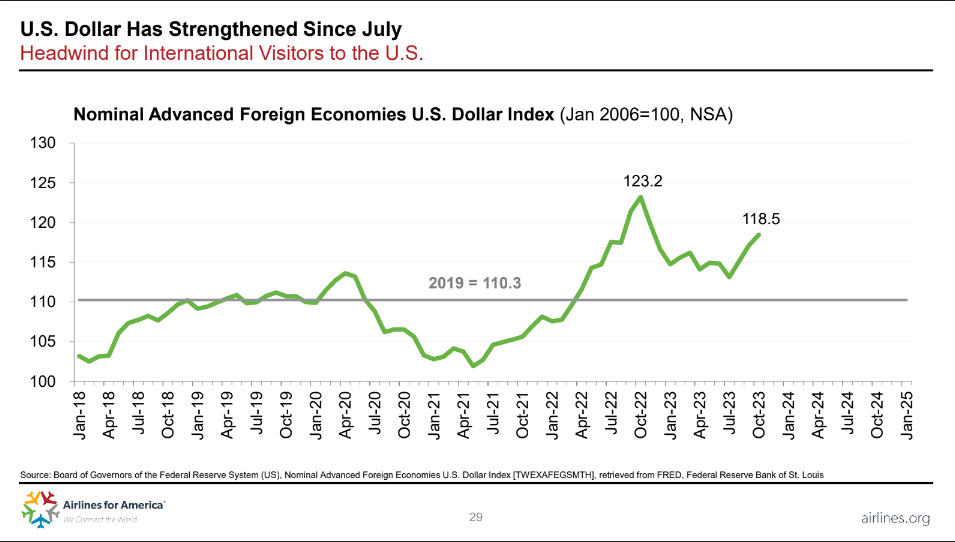
USD vs developed economy currencies (Airlines for America)
Conversely, major markets in East Asia and deep S. America (Brazil, Chile, and Argentina) are predominantly composed of passengers originating in those countries traveling to the U.S. but with premium cabin travel stronger from the U.S. The stronger dollar is depressing inbound tourism to the U.S. from these countries even more than to/from Europe. Capacity over the Pacific is quickly recovering and is expected to do so into 2024 since East Asian markets were much slower to sunset covid restrictions than transatlantic and Latin markets. China is limiting the return of capacity below pre-covid levels which is pushing airfares higher not just between the U.S. and China but also to other parts of Asia since Chinese airlines are offering very few seats for passengers connecting through China, instead focusing on the local China market. Variations in the transpacific market are particularly notable to/from Japan where the strong dollar/weak yen has pushed traffic down to the lowest levels in East Asia other than to China/Hong Kong. Although Japan is a major connecting point for transpacific traffic, the Japan to U.S. local market is particularly depressed and is not expected to recover until historic USD-JPY relationships return. South of the U.S. and Canada, increased tourism and growing friends and family tourism are driving strong growth not just to Mexico but also to other points in the northern tier of Latin America. Since those markets are within range of narrowbody aircraft, low-cost carriers are participating in the strength of those markets while deep S. America and transoceanic travel is carried predominantly by legacy carriers.
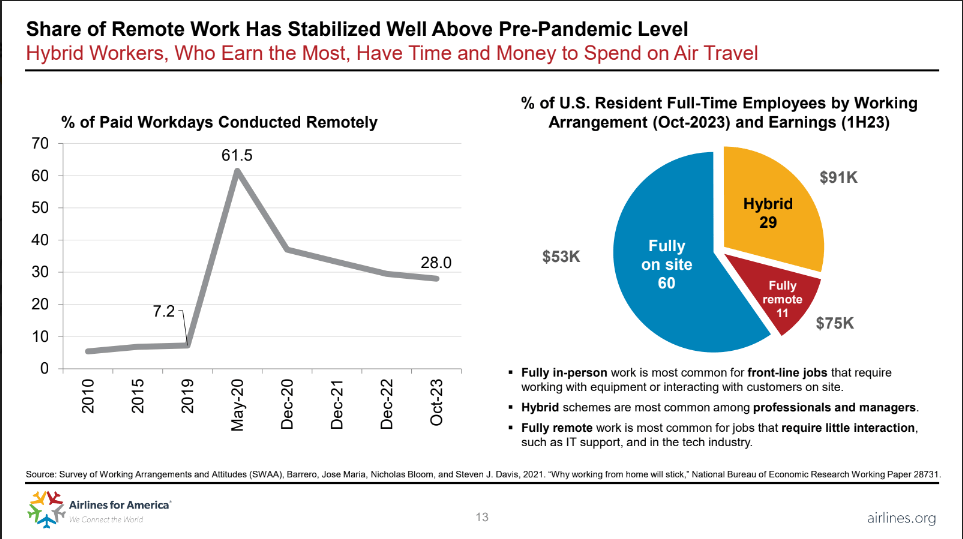
Shifts in Remote Work (Airlines for America)
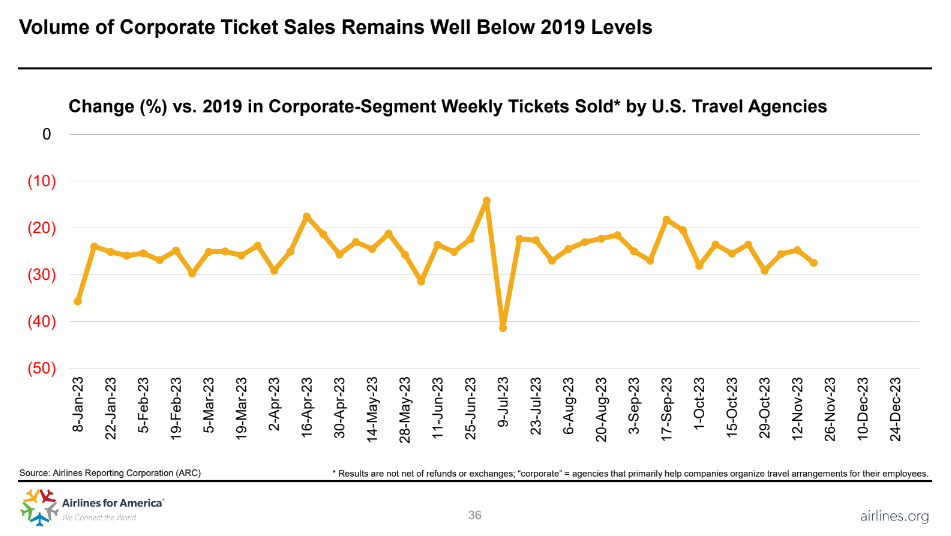
Corporate Travel Sales (Airlines for America)
Although long haul international business travel volume remains depressed by more than 25%, business travel revenue has fallen far less due to stronger pricing which itself is due to a reduction in the number of transoceanic competitors. The transatlantic low-cost carrier market was significantly impacted by the pandemic with several major carriers that were struggling with their business model before the pandemic forced to cease operations during the pandemic. The result has been stronger fares and tighter capacity and that is expected to continue. The transatlantic market was the most developed long haul low-cost market with the shorter haul North America to northern tier S. America market also well-developed; the latter market group survived the pandemic in part due to bankruptcy reorganization and is expected to continue to strengthen particularly via the growth of Latin low-cost carriers. There is currently limited transpacific low-cost capacity.
One of the factors that will continue to support capacity restraint is the limited availability of new aircraft and the continued use of older aircraft much longer into their economic lifetimes. Airbus and Boeing’s narrowbody production lines are generally booked for five or more years while widebody production capacity continues to grow, allowing limited expansion of global carrier fleets beyond replacement needs. India and the Middle East carriers have the most aggressive fleet purchases booked and the latter group of carriers, whose number is growing, will be aggressively competing to retain share that they gained as they effectively served as the international carriers for India, a position that several Indian carriers are seeking to regain. The South Pacific is also a bright spot as capacity there remains below pre-covid levels as the result of carrier restructurings and slow fleet replacement after the pandemic. In addition, geopolitical instability including around embargoed Russian airspace by many Western carriers is adding hours to many flights, increasing the number of aircraft necessary to operate routes and pushing costs and fares higher. The international market is expected to remain strong to the benefit of a smaller number of large legacy/global carriers even as high-growth areas of the world provide opportunities for the U.S. and foreign carriers that make up the majority of the JETS portfolio.
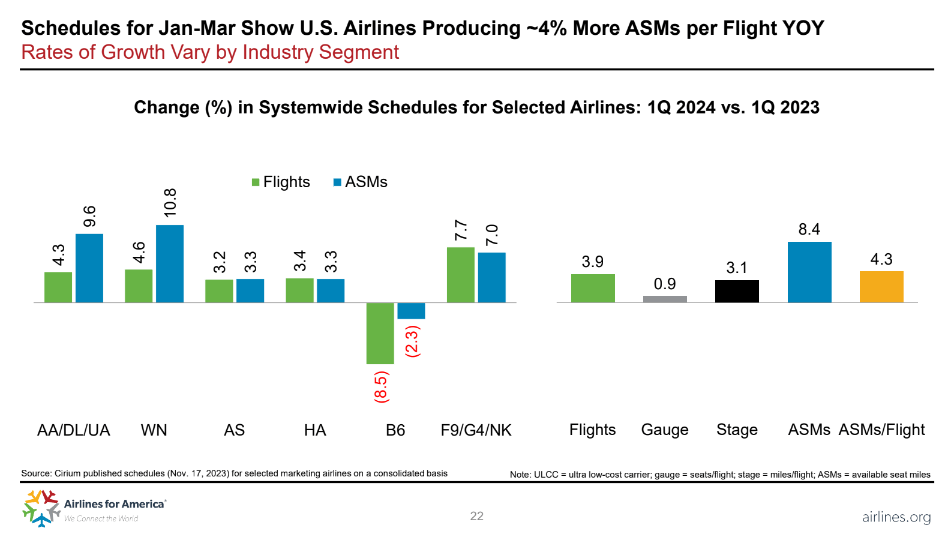
Airline capacity by industry segment (Airlines for America)
In addition to capacity restraint due to full order books, capacity remains limited due to production and reliability challenges both for aircraft and engines. Boeing continues to work off its delayed backlogs for both its narrowbody 737 and widebody 787 programs for which deliveries were suspended during the pandemic. Engine problems with widebody aircraft, predominantly affecting Rolls-Royce, have largely been resolved but massive inspections of Pratt and Whitney RTX engines that power most narrowbody aircraft except the Boeing 737, will ensure that significant portions of the narrowbody domestic fleet will be out of service for up to two years. New aircraft delivery delays will keep older aircraft in service, driving up maintenance costs even as the supply of highly trained aircraft mechanics struggles to keep up with demand in developed countries.
Shorter haul traffic will not grow at the same pace as long haul international traffic. Western economies are growing at slower rates as the low-cost model has operated for years in those economies, providing a limited opportunity for further traffic stimulation. Growing political pressure on the airline industry to reduce or eliminate short haul flights is expected to intensify driven by environmental agendas which include both attempts to reduce pollution from air travel compared to rail as well as a desire to reduce noise.
Finally, air traffic capacity is limited in many countries as a result of workforce disruptions during the pandemic, including accelerated early personnel retirements. While the U.S. is facing one of the most acute cases of ATC short-staffing, European airspace is congested with limited space for growth. Canada and European governments “hand off” most transatlantic flights to international airspace and the increase in long haul international traffic flying over or originating from those countries is pushing the limits of their ATC systems. While the U.S. will inevitably properly staff its ATC system, the lack of investment in new technology will limit the ability to grow air traffic, esp. around major metro areas, limiting capacity and leading to higher fares.
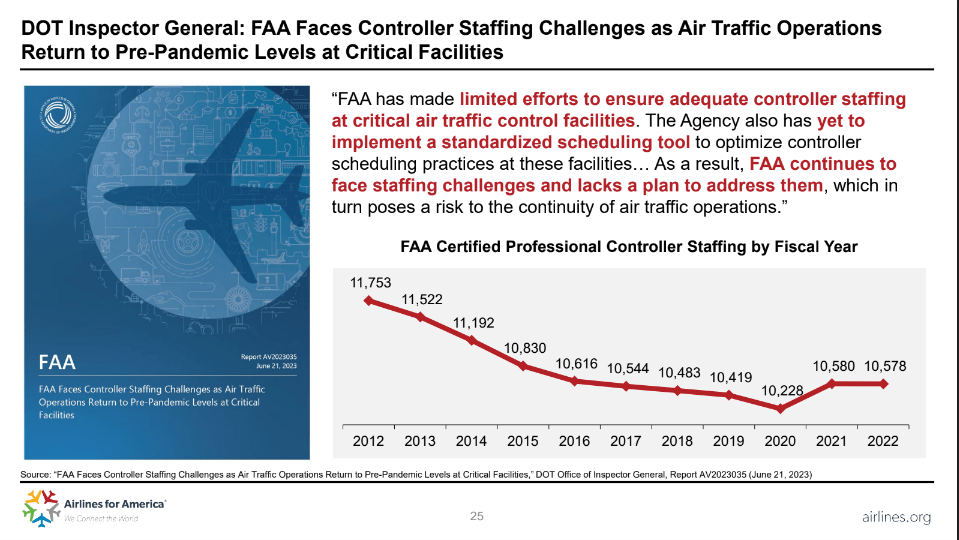
US ATC Staffing (Airlines for America)
Legacy/global carriers remain in an enviable position not just because of their global networks – where demand is growing the most – but also because they offer higher revenue production opportunities. Long haul travel involves premium cabins and the decrease in long haul business travel is being replaced by leisure travelers, some of whom are combining personal and business travel and who are willing to buy premium travel including premium economy seats. As the price of airfare increases, many airlines are able to entice travelers with supporting services including airport lounge access while creating stronger ties to loyalty programs in contrast to domestic, short haul flights that are viewed more as commodity services. Low-cost carriers in other parts of the world are faring better than their counterparts in the U.S. in part because the U.S. government has encouraged competition between airlines of multiple business types so that low-cost carriers compete more directly with larger legacy/global carriers in the U.S. than they do in other parts of the world.
Costs Are Stabilizing
From a cost standpoint, the airline industry has never been more challenging. As noted above, fuel costs have increased – but certainly not to historic levels. Considering that airlines continue to add new generation-powered, fuel-efficient aircraft, on a historic continuum, fuel costs are relatively stable even if it is a cost over which, apart from increasing efficiency, airlines have little control.
Labor costs have historically been either the first or second largest cost; in developed economies with high labor costs, labor has historically been the largest cost while fuel takes that role in developing economies. Labor norms worldwide esp. in developed economies were disrupted during the pandemic. Government stimulus to economies including direct payments to workers encouraged many people to not work while incentivizing others who were near retirement to leave the workforce. All of these factors impacted the airline industry esp. for pilots that have defined ages until which they can fly commercially. Because the pandemic was not military in nature, there was not an increase in military aviation activity which often serves to replenish pilot ranks after a geopolitical event. In addition, the shift to remote work led some airline workers to leave large urban areas for smaller, less costly areas. As economies recovered, other industries pay as much or more than airline jobs for many workers and provide higher quality of life compared to the 24/7 operations that many airlines operate.
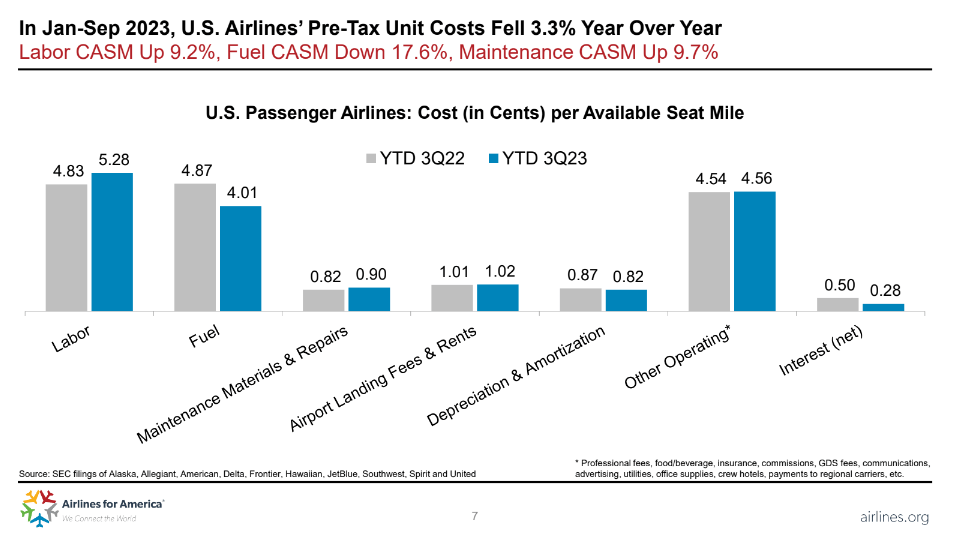
Airline Costs by Category (Airlines for America)
It isn’t a surprise that it was the financially healthiest airlines were the ones to move first to increase salaries in order to attract new workers. Regional airlines in the U.S. were the first to feel the pilot shortage and have had to raise salaries for all employees well above previous levels in order to continue to staff their aircraft. Although some of the U.S. low-cost carriers moved before any of the big 4 since LCCs have been a first step for civilian-trained pilots after flying at regional carriers, most regional aircraft are contracted by legacy airlines. Delta, as the most profitable airline pre-pandemic and with expectations of retaking that role post-covid, was the first of the big 4 to settle with its pilots and did so for eye-poppingly large increases in salary and benefits. While it did not offer the same level of increases to its non-pilot personnel, most of whom are non-union, it did increase salaries across the board. In an industry that is driven by pattern bargaining and where highly skilled positions such as pilots and mechanics remain tight, Delta’s compensation increases have led to a wave of labor cost increases that are still playing out. The demand and compensation for aviation jobs differ from country to country and, while some pilots have always been able to fly for airlines in other parts of the world, most aviation jobs are not “portable” across national boundaries. In some countries, pilot training including obtaining certification for a certain airplane is the responsibility of the pilot while national healthcare and pension systems make pilot salaries lower than in the U.S. Aircraft maintenance including extensive overhauls is moving to developing world economies where labor costs are lower while a handful of global carriers in developed countries operate maintenance divisions which do high-margin work for other airlines, supplementing the profits of their own airline operations. Labor cost increases are expected to begin to normalize during the next year although at higher levels. Capacity control will ensure that higher labor costs will increasingly be passed along to consumers.
One final cost-related item that requires notation is the increased reliability of airline operations, esp. in the United States. Data from the Thanksgiving travel period shows that U.S. airlines started one of the busiest travel seasons of the year with substantially improved reliability than has been the case for a number of years, building on very strong operational performance that began in late summer. Not being operationally reliable negatively impacts costs due to the costs of rerouting crew and airplanes as well as lost revenue and payments for passenger compensation and amenities. U.S. airlines have faced governmental pressure to fix their operations which suffered during the early months of covid travel recovery. U.S. airlines are now running some of the most reliable operations among major global travel markets. While disruptive winter storms are certain to impact air travel, the U.S. airline industry, and the FAA, even by encouraging reduced flight activity, have reached a level of operational stability that should reduce costs and maximize revenue generation in a trend that could have implications worldwide.
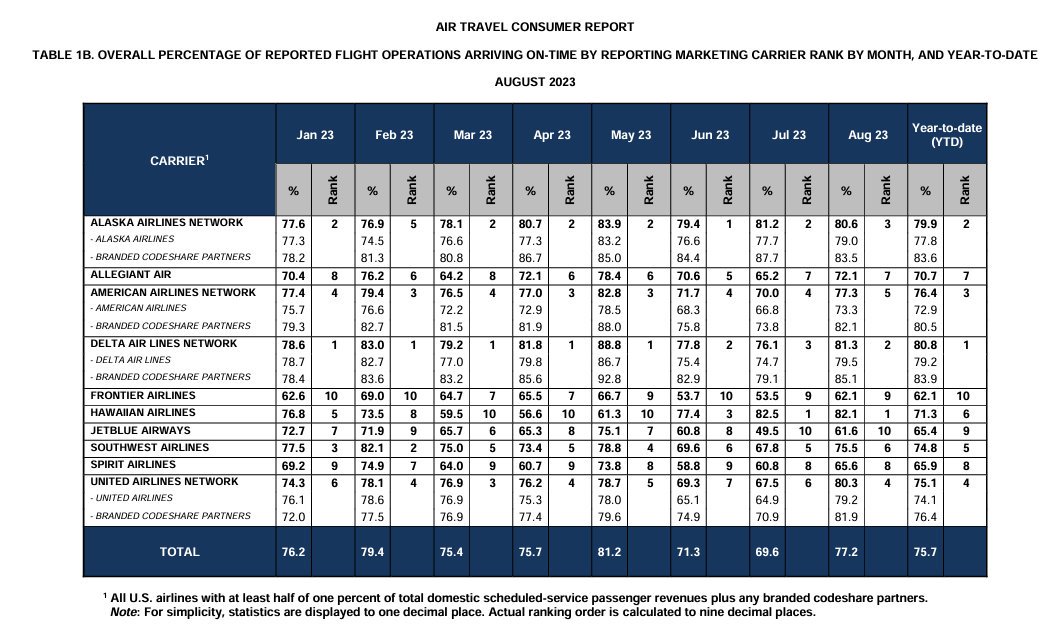
U.S. Airline YTD On-time Performance (U.S. Dept. of Transportation)
Financial Stability is Returning
Airline balance sheets remain damaged from the pandemic but many airlines are moving aggressively to repair that damage and restore their financial health. Strong demand, a healthy fare environment, and restrained capacity within a context of modest spending should help airlines continue to reduce leverage. Because the JETS ETF includes some aerospace manufacturing and service businesses, the JETS ETF is less leveraged than airlines alone and aerospace companies are seeing high levels of demand both for civilian and military products and services, both of which are expected to continue. While some airlines are ordering massive quantities of new aircraft that they intend to use to grow, most airlines are simply ordering and taking delivery of airplanes that were delayed during the pandemic while supporting modest growth. Airline balance sheets are expected to return to historic levels within a few years for most airlines.
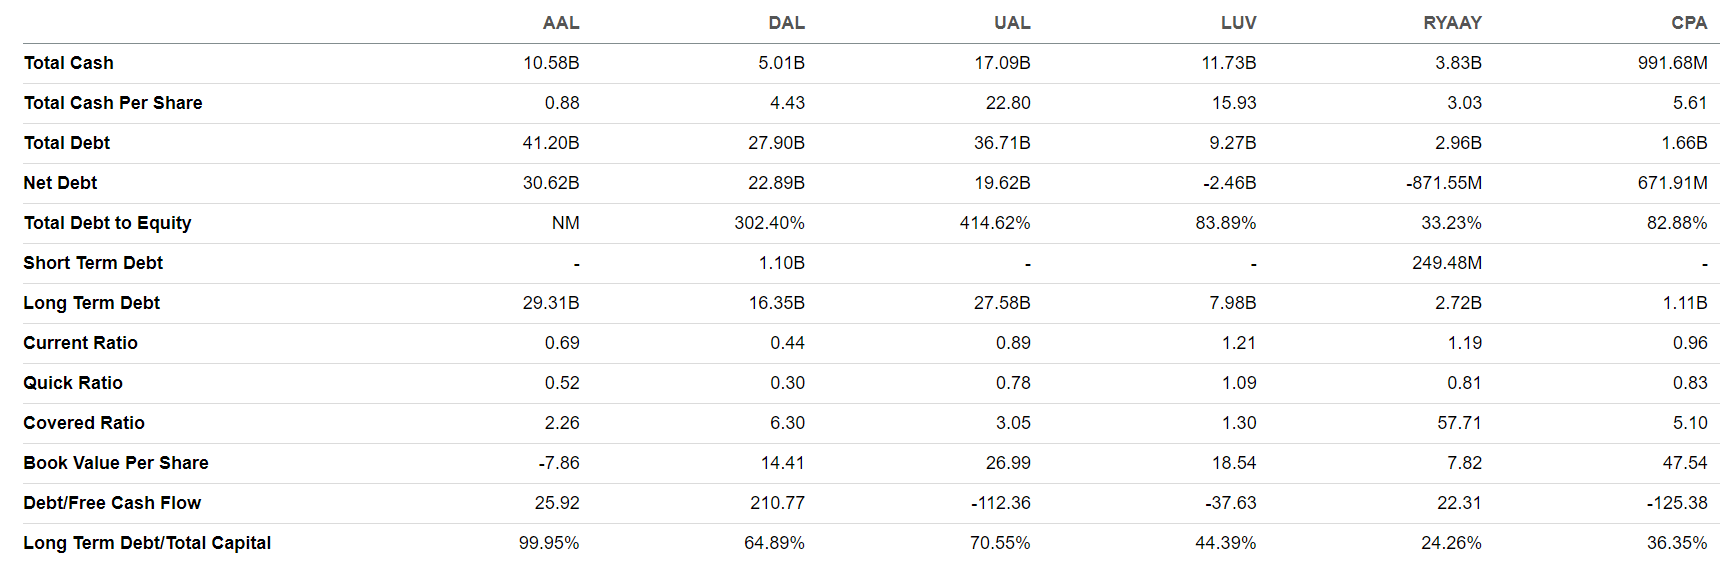
JETS select balance sheet data (Seeking Alpha)
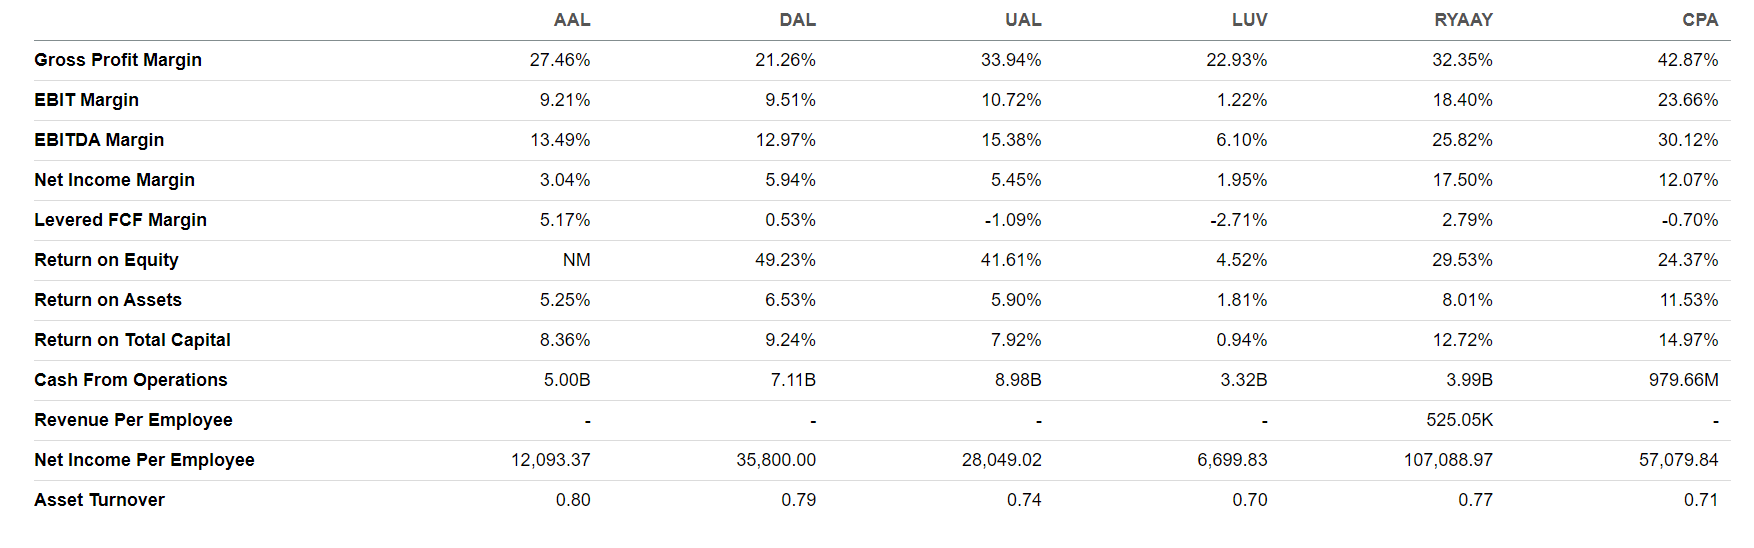
JETS select profitability (Seeking Alpha)
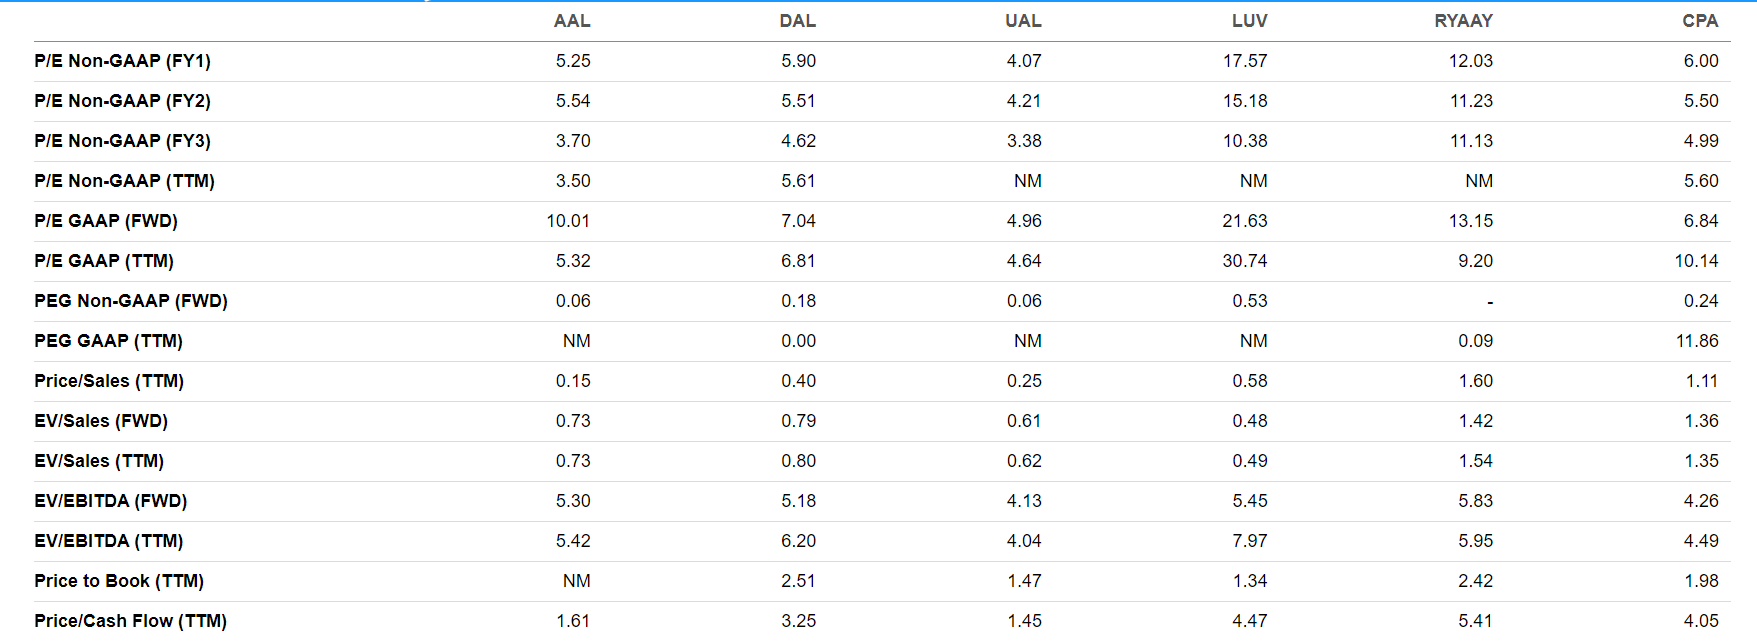
JETS select valuation (Seeking Alpha)
Risks Will Continue
The airline industry faces continual risks. While it seems that each new major crisis is “unprecedented,” airlines face a multitude of macroeconomic and geopolitical risks and they are getting better at dealing with these risks. Airlines, like all transportation companies, are sensitive to fuel costs but improved fuel efficiency and hedging strategies, which are more common with foreign than U.S. airlines, do help limit price fluctuation exposure. The risk of increased regulatory intrusion continues to be a threat for an industry that is often viewed as an economic necessity and where market concentration provides government oversight even though most large airlines are no longer publicly owned. Environmental policies continue to lead to the possibility of reduced access to large airports although some recent efforts, such as in the Netherlands, to reduce capacity in the name of environmental concerns were withdrawn because of legal and aviation bilateral concerns. Supply chain issues including the repair of defective products continue to reduce productivity and increase airline costs, even if those costs are increasingly being borne by much bigger and generally financially stronger aerospace companies.
Price Target
The global airline industry is reaching greater levels of maturity and is shaking off the round of shocks that have impacted the industry esp. over the past five years. A number of weaker airlines did not survive the pandemic, leaving a stronger pricing environment for those airlines that remain. Capacity remains tight due to supply chain, labor, and throughput limitations, augmenting a strong demand environment that is skewed to longer distances and a growing amount of premium travel. Airlines are monetizing their services more effectively. Fears of a return to high fuel prices appear to not be materializing as post-pandemic labor cost increases are normalizing even as productivity and efficiency for most carriers are not only improving but are higher than pre-pandemic. Balance sheet repair is well underway and many airlines are taking delivery of aircraft that were delayed during the pandemic even as they place orders for new aircraft that will fill manufacturer order books for most of the remainder of this decade and beyond.
The JETS ETF provides a great means for retail investors to get back into the industry after many stayed on the sidelines. Weighted to the largest U.S. airlines followed by other strong N. American and European airlines as well as major aerospace manufacturers, the majority of the companies in the JETS ETF are not only expected to see strong fundamentals in the next year and beyond but have repeatedly demonstrated their ability to grow stronger coming out of difficult environments. Price targets for some components of the JETS ETF exceed 40% of current levels although a few companies are rated lower.
An 18% growth in the value of JETS ETF is possible within the next 9 months, which warrants a buy rating.
Enjoyed this article? Sign up for our newsletter to receive regular insights and stay connected.