
Introduction
The opening question for this article could be, “Why avoid China, the world’s manufacturing base, second-largest economy and the country with the largest consumer market?”. Here, personal opinion might count as much as anything, but here are a few points of concern some investors have about China:
- The Chinese economic model. It seems to be a constant changing blend of communism and capitalism.
- Government control of the economy. Recent events related to their technology companies and lock-downs related to COVID are examples.
- The People’s Bank of China (PBoC) control (others say interference) over the value of the Yuan, which affects foreign trade.
- While the most populated country on earth, the long-term effects of their “one child” policy, on its labor market might just be starting to affect the economy. China is no longer the “land of the cheapest labor”.
Emerging Market countries are projected to have the fastest growing economies over the next decade. They also have the youngest and fastest growing populations on the planet. Of course, not everything is tilted in their favor as COVID hit them hardest, plus high levels of debt and a strong USD are negatives. Climate change policies will affect EM countries differently depending on their ties to fossil fuels (a negative) or minerals required for the “new greener economy” (a positive).
For investors wanting Emerging Market stocks, without China, the iShares MSCI Emerging Markets ex China ETF (NASDAQ:EMXC) is one of several choices now available and will be reviewed next. Also reviewed will be the iShares MSCI Emerging Markets ETF (NYSEARCA:EEM), to show not only performance differences, but how excluding China affects the country and sector allocations compared to unrestricted EM ETF from the same issuer.
iShares MSCI Emerging Markets Ex China ETF Review
Seeking Alpha describes this ETF as:
iShares MSCI Emerging Markets ex China ETF is managed by BlackRock Fund Advisors. It invests in public equity markets of global emerging region. It invests in growth and value stocks of companies operating across diversified sectors and market capitalization. The ETF to track the investment results of the MSCI Emerging Markets ex China Index. EMXC was formed on July 18, 2017.
Source: seekingalpha.com EMXC
The EMXC ETF has $2.5b in assets. Investors get a 1.9% yield, while iShares charges 25bps in fees. The Index is defined in this manner by the issuer:
The MSCI Emerging Markets ex China Index captures large and mid cap representation across 23 of the 24 Emerging Markets countries excluding China. With 654 constituents, the index covers approximately 85% of the free float-adjusted market capitalization in each country. Include countries are: Brazil, Chile, Colombia, Czech Republic, Egypt, Greece, Hungary, India, Indonesia, Korea, Kuwait, Malaysia, Mexico, Peru, Philippines, Poland, Qatar, Saudi Arabia, South Africa, Taiwan, Thailand, Turkey and United Arab Emirates.
Source: msci.com Index
The Index market-cap sizes range from $248m, up to $448b, with a median size of $3.27b. The Index performance chart provided has ten years of history prior to the start of the ETF.
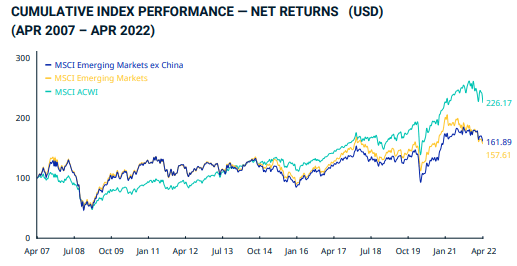
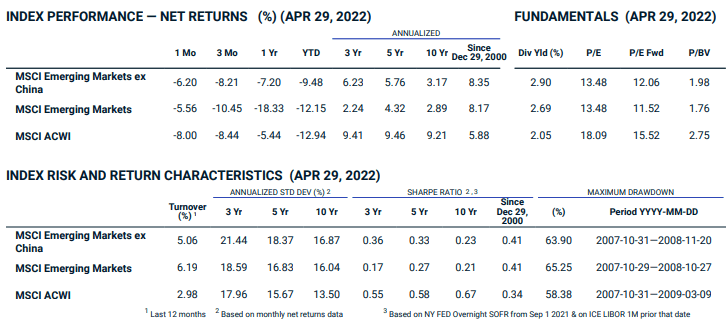
The following tables go back to the start of 2001, which shows the Ex-China Index slightly ahead of the full EM Index and much better than the MSCI ACWI Index, which covers both EM and Development markets. The second table shows that excluding Chinese stocks resulted in the highest StdDev of the three indices.
EMXC Holdings Review
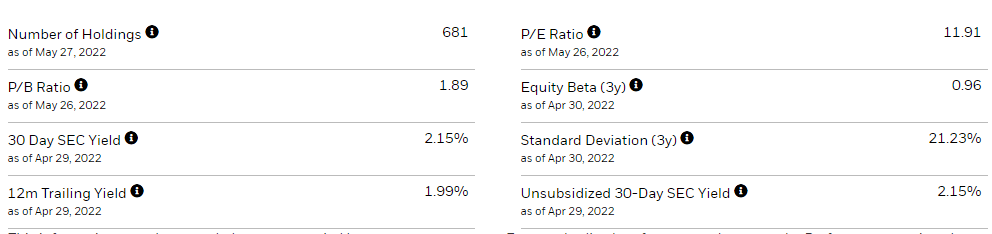
EMXC holds 681 assets, about 30 more than the Index holds. iShares provides these portfolio characteristics:
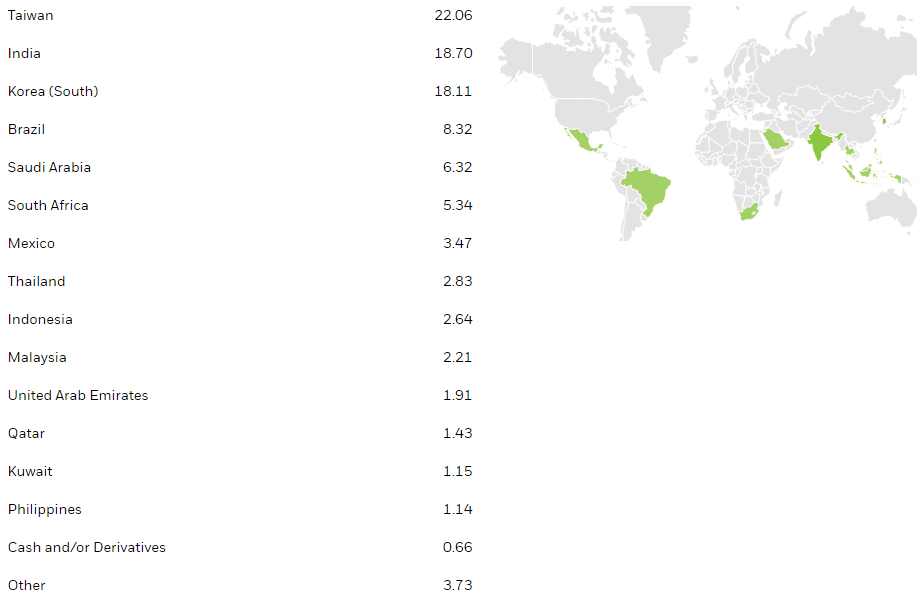
No surprise who the top three countries are, nor their location in Asia. Together, they account for almost 60% of the asset weight of EMXC. Overall, Asia amounts to almost 69% of the portfolio, with Latin America and the Middle East both just under 12% each.

For those surprised that Energy is only 6% with the Middle East being almost twice that weight, it is due to Financials, especially large banks, being a major part of the Middle East allocation. For those worried about oil’s future, that is a good sign. Across the whole portfolio, banks is the largest industry exposure, two technology industries come next, followed by energy at just over 5%.
The Top 10 stocks equate to 25% of the portfolio, with the Top 20 being 32%. EMXC does hedge the USD against the INR, THB, and SAR, but not others. That could be by choice or the fact that not all currencies have futures. The currencies where the exposure is greater than 4% are:
EMXC still lists 22 Russian stocks, plus the Ruble in their current holdings list, all valued at “zero”.
EMXC Distribution review
Dividends are paid in June and December, which matches the distribution schedule used by many EM stocks. Seeking Alpha gives EMXC a “C-” grade for its distribution record.
iShares MSCI Emerging Markets ETF Review
Seeking Alpha describes this ETF as:
The iShares MSCI Emerging Markets ETF is managed by BlackRock Fund Advisors. The fund invests in public equity markets of global emerging region. It invests in growth and value stocks of companies operating across diversified sectors and market capitalization. The fund seeks to track the performance of the MSCI Emerging Markets Index. The EEM ETF was formed on April 7, 2003.
Source: seekingalpha.com EEM
The EEM ETF has $27.5b in assets. Investors get a 2.37% yield, while iShares charges 68bps in fees, more than twice what they charge to manage EMXC. The Index is defined in this manner by the issuer:
The MSCI Emerging Markets Index captures large and mid cap representation across 24 Emerging Markets countries. With 1,398 constituents, the index covers approximately 85% of the free float-adjusted market capitalization in each country.
Source: msci.com EM Index
The country list matches the other MSCI Index, plus China. Index Market-cap sizes range from $10m, up to $448b, with a median size of $1.82b.
EEM Holdings Review
EEM holds 1238 assets, about 150 less than the Index holds. iShares provides these portfolio characteristics:
The almost 30% weight in China is a concern for some investors, and this is down from over 37% at this time last year. All the other countries should be in the same order as they appear in EMXC, just lower allocations. With the inclusion of China, the weight for Asia stocks climbs to 78%, with Latin America and Middle East allocations both now close to 8%.
Inclusion of Chinese stocks flips the top two sectors and pushes up Consumer Discretionary to the 3rd biggest allocation. Later, I will compare the sector weights.

The Top 10 stocks equate to 23% of the portfolio, with the Top 20 being 30%; both slightly less than EMXC’s concentrations. EEM does hedge the USD against the same currencies as EMXC. The currencies where the exposure is greater than 4% are:
Notice that EEM holds Chinese stocks that trade in both Hong Kong and on a mainland exchange, like Shanghai. EEM also lists the same Russian securities, again shown at zero value.
EEM Distribution review
EEM distributions follow the same pattern as EMXC, but with about 40bps more in yield. Seeking Alpha grades EEM as a “B+”.

Comparing ETFs
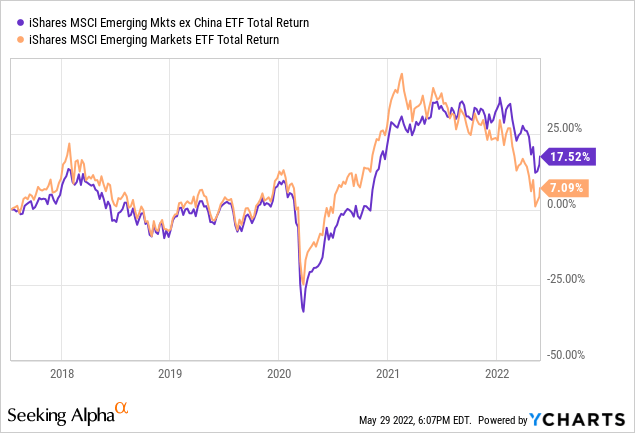
Recent returns finally have EMXC ahead of EEM on a Total Return basis. For the next chart, I added the WisdomTree China ex-State-Owned Enterprises (CXSE), and a second, less restricted 100% China ETF: iShares MSCI China ETF (MCHI). Both show how poorly China has done recently.
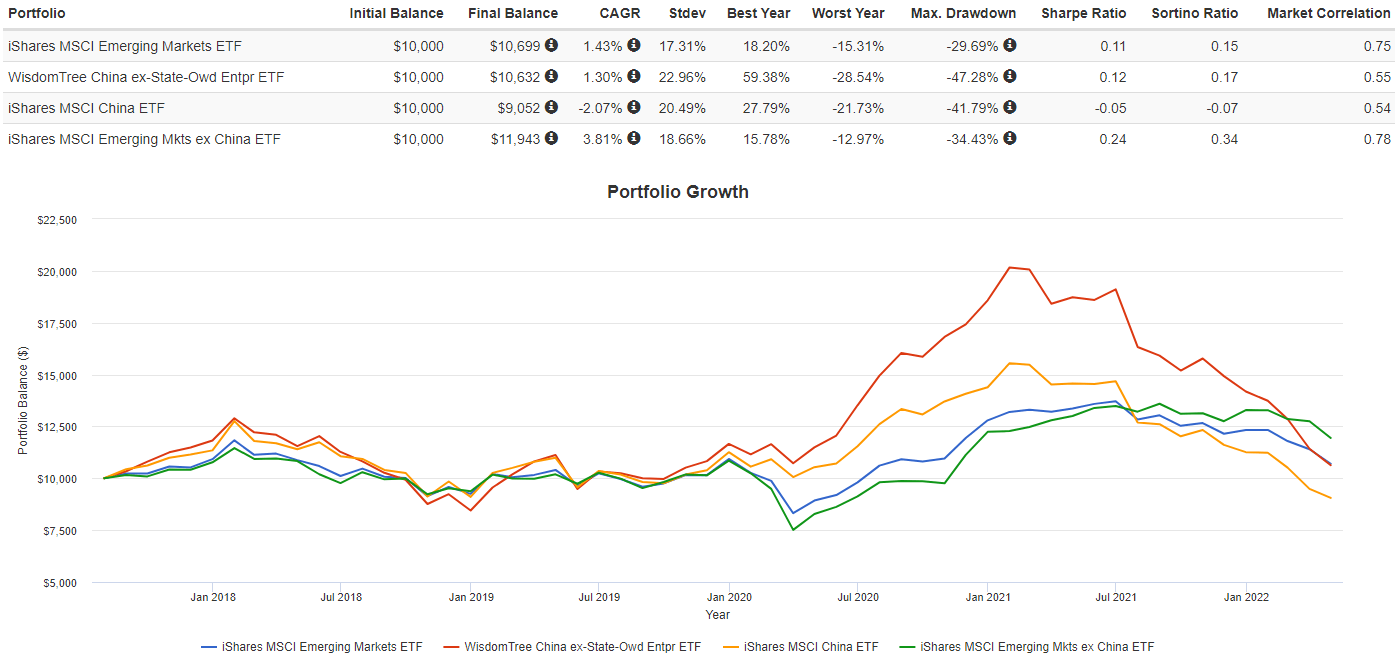
EMXC, since its start, has provided a lower StdDev than the other three ETFs, resulting in the best Sharpe and Sortino ratios. Remembering that the next chart is a “point-in-time” one, it shows how the iShares ETFs currently match up in their sector allocations.
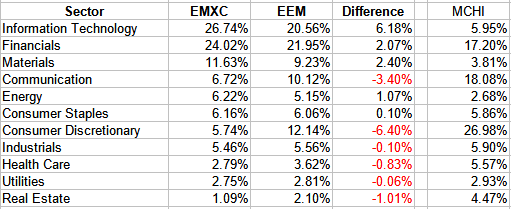
The MCHI sector allocations explain the differences between EMXC and EEM and what investors would be exposed to with a pure China ETF.
Portfolio Strategy
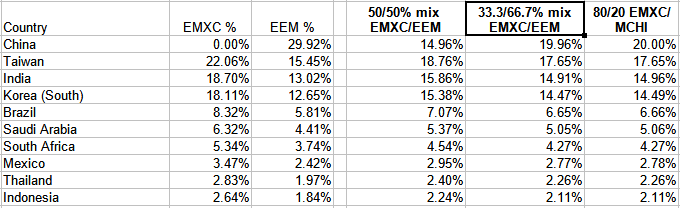
By the combining EMXC with either EEM or MCHI, an investor can set their China exposure to whatever percent they desire. By altering the weights between ETFs, they can change the China allocation base on a timing model, expert analysis, or their own “gut”. The following shows several examples: one sets the China weight to approximately 15%, the other two at 20%.
The next chart shows that since 1995, EM stocks have lagged behind what US stocks have done, but outperformed International Development market stocks.
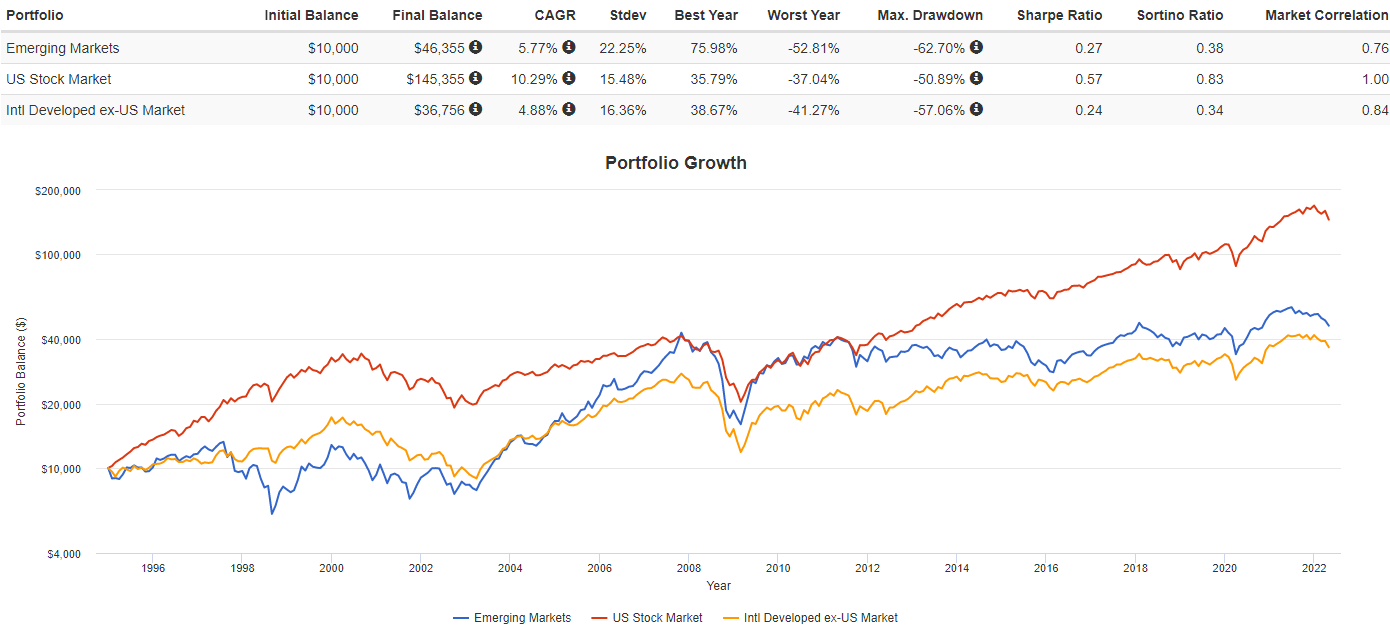
While having the highest StdDev, EM stocks, with their .75 correlation to the US market, should provide some smoothing of returns over time. Looking at the ETFs, EMXC shows a .78 correlation to US stocks, whereas EEM shows .75.
(This article was co-produced with Hoya Capital Real Estate)
Introduction
The opening question for this article could be, “Why avoid China, the world’s manufacturing base, second-largest economy and the country with the largest consumer market?”. Here, personal opinion might count as much as anything, but here are a few points of concern some investors have about China:
- The Chinese economic model. It seems to be a constant changing blend of communism and capitalism.
- Government control of the economy. Recent events related to their technology companies and lock-downs related to COVID are examples.
- The People’s Bank of China (PBoC) control (others say interference) over the value of the Yuan, which affects foreign trade.
- While the most populated country on earth, the long-term effects of their “one child” policy, on its labor market might just be starting to affect the economy. China is no longer the “land of the cheapest labor”.
Emerging Market countries are projected to have the fastest growing economies over the next decade. They also have the youngest and fastest growing populations on the planet. Of course, not everything is tilted in their favor as COVID hit them hardest, plus high levels of debt and a strong USD are negatives. Climate change policies will affect EM countries differently depending on their ties to fossil fuels (a negative) or minerals required for the “new greener economy” (a positive).
For investors wanting Emerging Market stocks, without China, the iShares MSCI Emerging Markets ex China ETF (NASDAQ:EMXC) is one of several choices now available and will be reviewed next. Also reviewed will be the iShares MSCI Emerging Markets ETF (NYSEARCA:EEM), to show not only performance differences, but how excluding China affects the country and sector allocations compared to unrestricted EM ETF from the same issuer.
iShares MSCI Emerging Markets Ex China ETF Review
Seeking Alpha describes this ETF as:
iShares MSCI Emerging Markets ex China ETF is managed by BlackRock Fund Advisors. It invests in public equity markets of global emerging region. It invests in growth and value stocks of companies operating across diversified sectors and market capitalization. The ETF to track the investment results of the MSCI Emerging Markets ex China Index. EMXC was formed on July 18, 2017.
Source: seekingalpha.com EMXC
The EMXC ETF has $2.5b in assets. Investors get a 1.9% yield, while iShares charges 25bps in fees. The Index is defined in this manner by the issuer:
The MSCI Emerging Markets ex China Index captures large and mid cap representation across 23 of the 24 Emerging Markets countries excluding China. With 654 constituents, the index covers approximately 85% of the free float-adjusted market capitalization in each country. Include countries are: Brazil, Chile, Colombia, Czech Republic, Egypt, Greece, Hungary, India, Indonesia, Korea, Kuwait, Malaysia, Mexico, Peru, Philippines, Poland, Qatar, Saudi Arabia, South Africa, Taiwan, Thailand, Turkey and United Arab Emirates.
Source: msci.com Index
The Index market-cap sizes range from $248m, up to $448b, with a median size of $3.27b. The Index performance chart provided has ten years of history prior to the start of the ETF.
msci.com Index PDF
The following tables go back to the start of 2001, which shows the Ex-China Index slightly ahead of the full EM Index and much better than the MSCI ACWI Index, which covers both EM and Development markets. The second table shows that excluding Chinese stocks resulted in the highest StdDev of the three indices.
msci.com Index PDF
EMXC Holdings Review
EMXC holds 681 assets, about 30 more than the Index holds. iShares provides these portfolio characteristics:
ishares.com EMXC
iShares.com EMXC countries
No surprise who the top three countries are, nor their location in Asia. Together, they account for almost 60% of the asset weight of EMXC. Overall, Asia amounts to almost 69% of the portfolio, with Latin America and the Middle East both just under 12% each.
iShares.com EMXC sectors
For those surprised that Energy is only 6% with the Middle East being almost twice that weight, it is due to Financials, especially large banks, being a major part of the Middle East allocation. For those worried about oil’s future, that is a good sign. Across the whole portfolio, banks is the largest industry exposure, two technology industries come next, followed by energy at just over 5%.
iShares.com; compiled by Author
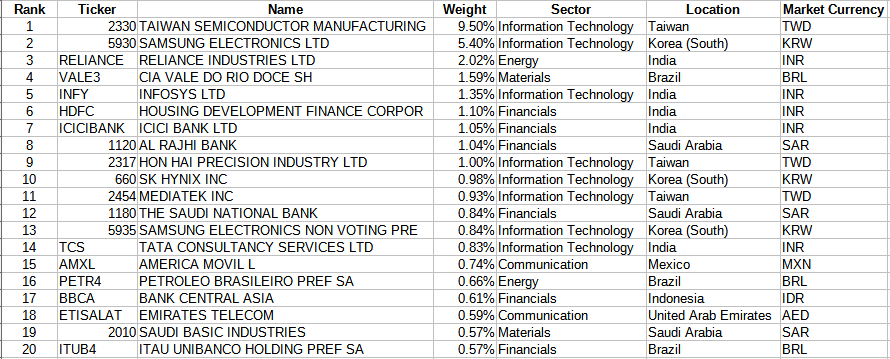
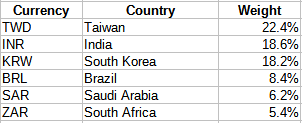
The Top 10 stocks equate to 25% of the portfolio, with the Top 20 being 32%. EMXC does hedge the USD against the INR, THB, and SAR, but not others. That could be by choice or the fact that not all currencies have futures. The currencies where the exposure is greater than 4% are:
iShares.com EMXC; compiled by Author
EMXC still lists 22 Russian stocks, plus the Ruble in their current holdings list, all valued at “zero”.
EMXC Distribution review
seekingalpha.com EMXC DVDs
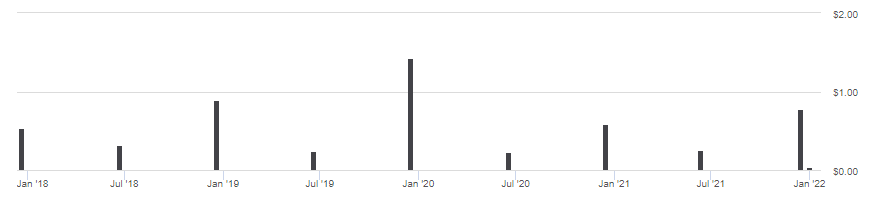
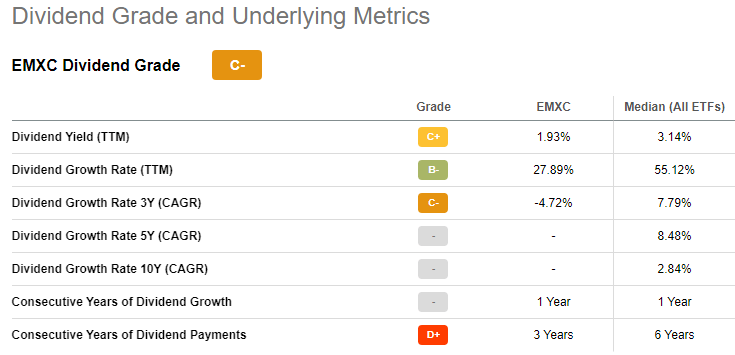
Dividends are paid in June and December, which matches the distribution schedule used by many EM stocks. Seeking Alpha gives EMXC a “C-” grade for its distribution record.
seekingalpha.com DVD scorecard
iShares MSCI Emerging Markets ETF Review
Seeking Alpha describes this ETF as:
The iShares MSCI Emerging Markets ETF is managed by BlackRock Fund Advisors. The fund invests in public equity markets of global emerging region. It invests in growth and value stocks of companies operating across diversified sectors and market capitalization. The fund seeks to track the performance of the MSCI Emerging Markets Index. The EEM ETF was formed on April 7, 2003.
Source: seekingalpha.com EEM
The EEM ETF has $27.5b in assets. Investors get a 2.37% yield, while iShares charges 68bps in fees, more than twice what they charge to manage EMXC. The Index is defined in this manner by the issuer:
The MSCI Emerging Markets Index captures large and mid cap representation across 24 Emerging Markets countries. With 1,398 constituents, the index covers approximately 85% of the free float-adjusted market capitalization in each country.
Source: msci.com EM Index
The country list matches the other MSCI Index, plus China. Index Market-cap sizes range from $10m, up to $448b, with a median size of $1.82b.
EEM Holdings Review
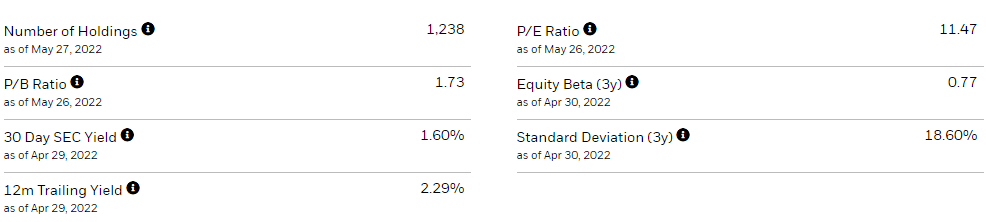
EEM holds 1238 assets, about 150 less than the Index holds. iShares provides these portfolio characteristics:
iShares.com EEM
iShares.com EEM countries
The almost 30% weight in China is a concern for some investors, and this is down from over 37% at this time last year. All the other countries should be in the same order as they appear in EMXC, just lower allocations. With the inclusion of China, the weight for Asia stocks climbs to 78%, with Latin America and Middle East allocations both now close to 8%.
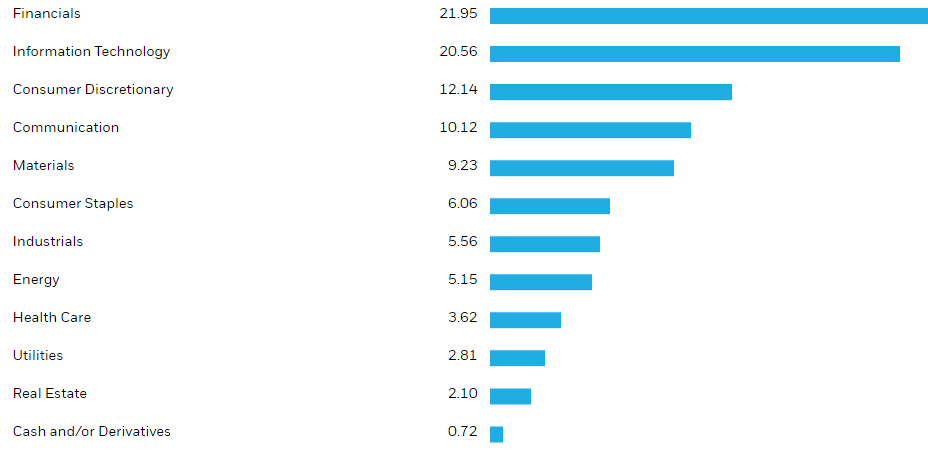
iShares.com EEM sectors
Inclusion of Chinese stocks flips the top two sectors and pushes up Consumer Discretionary to the 3rd biggest allocation. Later, I will compare the sector weights.
iShares.com; compiled by Author
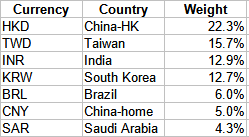
The Top 10 stocks equate to 23% of the portfolio, with the Top 20 being 30%; both slightly less than EMXC’s concentrations. EEM does hedge the USD against the same currencies as EMXC. The currencies where the exposure is greater than 4% are:
iShares.com; compiled by Author
Notice that EEM holds Chinese stocks that trade in both Hong Kong and on a mainland exchange, like Shanghai. EEM also lists the same Russian securities, again shown at zero value.
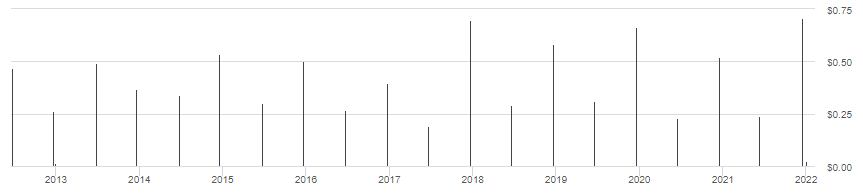
EEM Distribution review
seekingalpha.com EEM DVDs
EEM distributions follow the same pattern as EMXC, but with about 40bps more in yield. Seeking Alpha grades EEM as a “B+”.
seekingalpha.com DVD scorecard
Comparing ETFs
Data by
YCharts
Recent returns finally have EMXC ahead of EEM on a Total Return basis. For the next chart, I added the WisdomTree China ex-State-Owned Enterprises (CXSE), and a second, less restricted 100% China ETF: iShares MSCI China ETF (MCHI). Both show how poorly China has done recently.
PortfolioVisualizer.com
EMXC, since its start, has provided a lower StdDev than the other three ETFs, resulting in the best Sharpe and Sortino ratios. Remembering that the next chart is a “point-in-time” one, it shows how the iShares ETFs currently match up in their sector allocations.
iShares.com; compiled by Author
The MCHI sector allocations explain the differences between EMXC and EEM and what investors would be exposed to with a pure China ETF.
Portfolio Strategy
By the combining EMXC with either EEM or MCHI, an investor can set their China exposure to whatever percent they desire. By altering the weights between ETFs, they can change the China allocation base on a timing model, expert analysis, or their own “gut”. The following shows several examples: one sets the China weight to approximately 15%, the other two at 20%.
iShares.com; compiled by Author
The next chart shows that since 1995, EM stocks have lagged behind what US stocks have done, but outperformed International Development market stocks.
portfoliovisualizer.com
While having the highest StdDev, EM stocks, with their .75 correlation to the US market, should provide some smoothing of returns over time. Looking at the ETFs, EMXC shows a .78 correlation to US stocks, whereas EEM shows .75.
Enjoyed this article? Sign up for our newsletter to receive regular insights and stay connected.