
This article aims to offer investors a comprehensive view of the opportunities and risks linked to Asian emerging markets. This area of the globe offers higher growth potential, in the next decades, compared to the developed economies. However, higher returns come with more potential risks: before investing in these specific markets, it is vital to have a complete understanding of the factors that could limit or expand their economic growth. It is not an easy task, as we are re talking about a very large and highly heterogeneous geographical area. To gain exposure in Asian emerging markets, the following ETFs are worth mentioning: the SPDR® S&P® Emerging Asia Pacific ETF (GMF) and the iShares MSCI Emerging Markets Asia ETF (EEMA). Both have an expense ratio of 0.49, which can be considered reasonable.
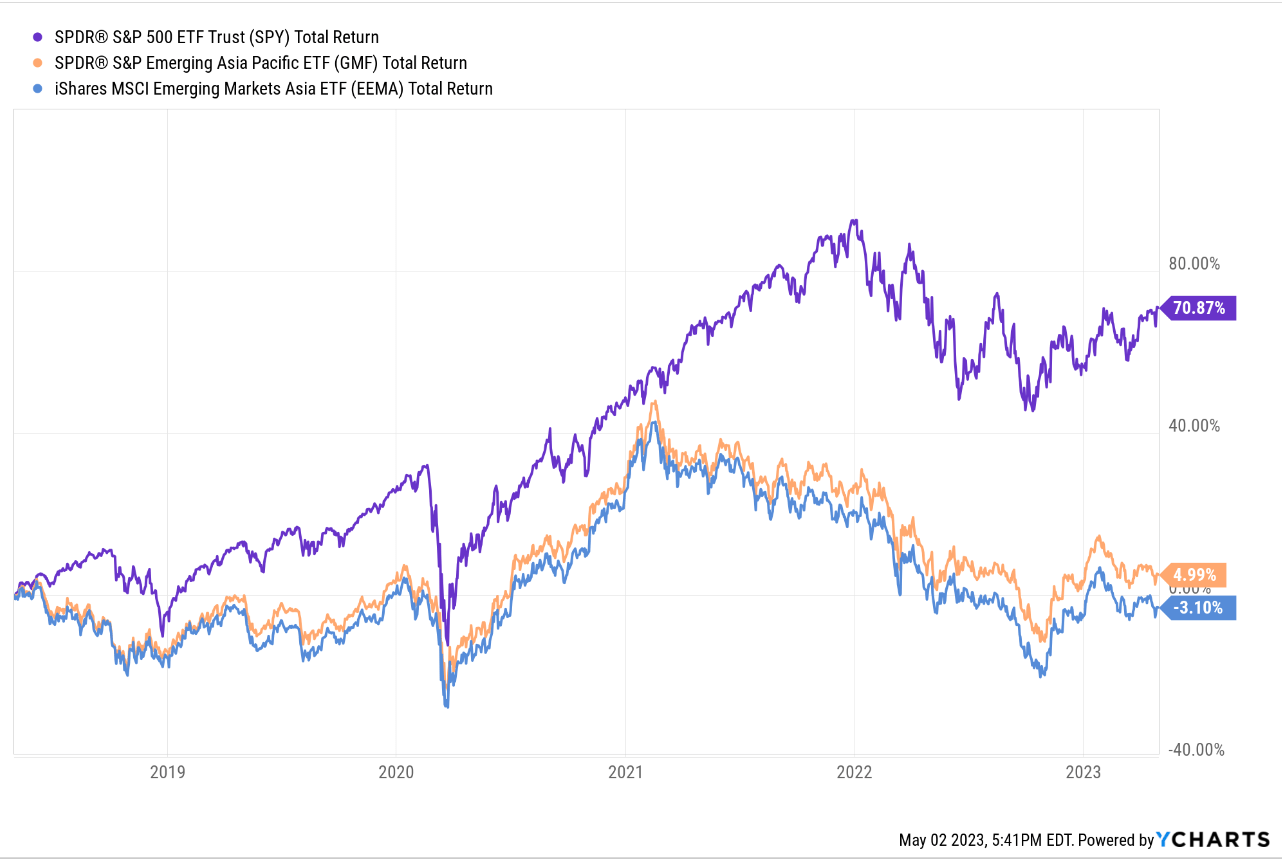
The following chart shows the 5-year performance of GMF and EEMA compared to the S&P 500 Trust ETF (SPY). While at the beginning of 2021 they were converging to a similar total return, in the last 2 years the difference in performance between the SPY and the other 2 ETFs has become increasingly marked. Starting from 2018, the SPY delivered an outstanding 70.87%, while GMF and EEMA delivered respectively 4.99% and -3.10%. GMF significantly outperformed EEMA in the period considered, suggesting that it could represent the most solid option for seeking exposure in Asian emerging markets.
YCharts
We believe this massive difference in total return signals a buying opportunity. It will be hard for the US economy to replicate the growth of the most recent decade. Also, Asian emerging companies trade at a significant discount with regards to price to earnings and price to book ratios.
|
SPY |
GMF |
EEMA |
|
|
Price to Earnings |
18.78 |
13.36 |
12.91 |
|
Price to book ratio |
3.80 |
1.73 |
1.71 |
Table 1 – Data obtained by the fact sheets of the ETFs
GMF offer a valid solution for those investors looking for exposure in Asian emerging markets, despite some limitations consisting in an overexposure to China and the presence of countries not purely classified as emerging (like Taiwan). As we’ll discuss in this article, the long-term growth potential that justifies an investment is present. But the same importance must be given to a deep understanding of the associated risks.
1. Emerging markets: definition and comparison
First, it should be noted that an unequivocal definition of “emerging market” does not exist. The International Monetary Fund defines 39 economies as “advanced”. The remaining ones are labeled as “emerging market and developing” economies. It’s common to encounter countries that are classified as emerging economies by a certain group of analysts, while others may consider them advanced. South Korea and Taiwan fall in this classification problem. The two countries are both present in EEMA, while GMF is only exposed to Taiwan. This could be a problem if you’re looking to invest exclusively in emerging markets: South Korea and Taiwan are closer to the US, from a development perspective, than to China or India (see Table 2 for reference).
There are different ways of classifying and comparing the economic activity of countries. One of the most used measures is the gross national income (GNI), obtained by adding to the GDP the net income received from overseas sources. Table 1 shows the gross national income values for emerging Asian countries. USA is present for comparison. The data was obtained from the database of the World Bank.
|
Country |
Value ($mln) |
Year |
|
United States |
23,393,117 |
2021 |
|
China |
17,576,648 |
2021 |
|
India |
3,123,967 |
2021 |
|
Korea, Rep. |
1,831,117 |
2021 |
|
Indonesia |
1,154,465 |
2021 |
|
Thailand |
488,180 |
2021 |
|
Bangladesh |
438,175 |
2021 |
|
Philippines |
408,174 |
2021 |
|
Malaysia |
361,553 |
2021 |
|
Vietnam |
346,676 |
2021 |
|
Pakistan |
341,730 |
2021 |
|
Myanmar |
63,338 |
2021 |
|
Cambogia |
25,533 |
2021 |
Table 2 – GNI
From Table 1, China’s aggregate activity is significantly higher than that of any other emerging Asian country, being almost 6 times higher than India’s gross national income. After Indonesia, which has a GNI equal to about a third of India’s GNI, we see a group of countries with very similar values (excluding Myanmar and Cambodia).
To compare the differences in the quality of life between different countries, the GDP per capita must be adjusted by purchasing power parity (PPP). The following comparison refers to a group of countries that present a strong internal variability in the level of economic development. For this reason, it would not be appropriate to use the GDP per capita not adjusted by PPP. In fact, if the latter were used, the results obtained would appear strongly distorted: the use of a different currency in each country would make exchange rate fluctuations problematic and different countries have different prices for essential goods and services. These differences are not captured by GDP per capita, but by the adjusted purchasing power parity measure. The values presented in table 2 derive from the database of the International Monetary Fund.
|
Country |
Estimate ($) |
Year |
|
United States |
80,034 |
2023 |
|
Taiwan |
73,344 |
2023 |
|
Korea, Rep. |
56,706 |
2023 |
|
Malaysia |
36,846 |
2023 |
|
China |
23,382 |
2023 |
|
Thailand |
22,675 |
2023 |
|
Indonesia |
15,855 |
2023 |
|
Vietnam |
14,458 |
2023 |
|
Philippines |
11,420 |
2023 |
|
India |
9,073 |
2023 |
|
Bangladesh |
8,663 |
2023 |
|
Pakistan |
6,836 |
2023 |
|
Cambodia |
6,092 |
2023 |
|
Myanmar |
5,131 |
2023 |
Table 3 – GDP (PPP) per capita
Considering Table 2, it’s evident that Taiwan and South Korea position themselves on a completely different rank compared to the other listed countries. Excluding these two, the first places are occupied by Malaysia, China, and Thailand. Malaysia stands out in particular: thanks to its economic results, it gained the first place among the countries of emerging Asia. The data also highlight a strong heterogeneity between the economies considered: the GDP per capita (PPP) of Malaysia is $36,846 against $11,420 of the Philippines, despite the two countries being geographically very close. This diversity is a unique characteristic of the Asian territory.
2. Demographic trends and income inequality
The emerging Asian countries are going through, in parallel with economic growth, significant changes in terms of wealth distribution and stratification of the social fabric. We are witnessing the growth of a precise segment of the population: the middle class. This is a demographic trend which benefits both citizens, who can improve their standard of living, and businesses, which can count on new categories of consumers. According to the economic literature “companies benefit from the growth of the middle class, as it results in increases in productivity and faster economic development” (Kapsos & Bourmpoula, 2013, p. 26).
Change in “consumer class” by 2030 (JP Morgan Guide to the Markets, 2023)
Figure 1
Figure 1 shows the change the “consumer class” segment by 2030 for various countries. The difference between the Asian region and other developed nations is impressive. The takeaway is clear: the increase in the consumer class will represent a major growth driver for Asian emerging markets. According to these projections, the main countries of the Asian continent will succeed, in the coming decades, in creating new groups of consumers capable of contributing to the economic development of the region.
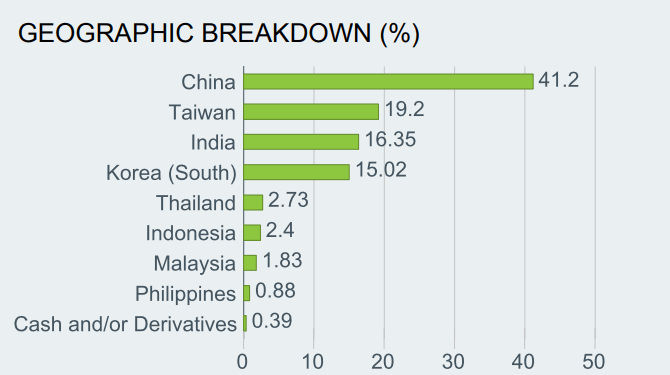
As shown in the figures 2 and 3 below, that highlight the geographic breakdown of GMF and EEMA, both ETFs are widely exposed to those countries of the world that will reasonably grow the most in the next decades. In both GMF and EEMA, China has a weight of more than 40%. India has a higher weight in GMF, with 24.56%, while in EEMA it represents 16.35% of the total. Taiwan has similar percentages, respectively 19.71% and 19.2%. It should be noted that South Korea is present only in EEMA, with a 15.02% weight. Thailand, Malaysia, Indonesia, and the Philippines are present in both ETFs, with a cumulative weight of 10.75% in GMF and 7.84% in EEMA. So, GMF has a higher exposure in South-East Asia. As we’ve seen in Table 3, Malaysia, and Thailand (together with China) position themselves in the highest rank of GDP per capita in emerging Asia: being exposed to these countries is essential to capture their future growth. Also, GMF has a combined 0.35% country weight in Singapore, the US, and Pakistan: however, the amount invested in these countries can be considered insignificant.

BBCP Research
Figure 2 – GMF geographic breakdown (%)
BBCP Research
Figure 3 – EEMA geographic breakdown (%)
According to the current projections, India’s population is expected to surpass China’s by the end of the year. This signals a relevant shift in the global order: India’s expanding working-age population will likely be a major growth driver. GMF has a higher weight in India compared to EEMA (24.56% vs 16.35%). EEMA sacrifices exposure in India for a strong 15.02% position in South Korea: We believe this sounds unfavorable for investors, as India is one of the fastest growing countries in the world.
China is going through significant demographic problems, but that doesn’t mean its future growth prospects are non-existent. Increased productivity and technological improvements can lift China’s growth up, even with a shrinking labor force. The Chinese government has tried to reinvigorate population growth by easing the so-called one-child policy, according to which, since 1979, each woman could conceive a maximum of one child. Starting in 2013, families were allowed to have 2 children. In 2021, the maximum limit of children per family rose to 3. However, these measures may not be enough to avoid the demographic decline China is facing. In fact, various elements emerge which today represent a disincentive for births and make it more difficult to restore demographic growth. These include the very high costs of raising children in the city. Furthermore, the wage inequality between men and women would lead the latter not to want children in order not to see their job position compromised. It should also be underlined that the one-child policy has been carried forward for several decades: this has led to the development of a socio-cultural apparatus rooted around this norm, which by inertia continues, at least in part, to be present in the mental schemes of citizens. The Chinese government will try, through economic aid to its inhabitants, to change a demographic trajectory which, however, now seems marked.
The economists of the World Inequality Report(Chancel, Piketty, Saez, & Zucman, 2022)reached the following conclusions: since the 1990s, the emerging world has seen an increase in wealth inequality. This increase was particularly strong in China, and to a lesser extent in India, as these countries underwent privatization reforms that impacted the distribution of wealth. Income inequality in the Asia/Pacific region (Gini coefficient equal to 0,35) is higher than in the OECD (0,31). Also, the income gap between the richest and the poorest in Asia/Pacific countries is twice as large as in OECD countries. In Southeast Asian countries, income inequality remains extremely high. In Thailand, the richest 1% controls 58% of the national wealth. A similar percentage can also be found in Indonesia, where the richest 1% controls 50% of the national resources. In Malaysia, 58% of the indigenous population lives in poverty.
Income inequality leads to the reduction of a state’s growth prospects. Furthermore, it reduces social cohesion and stability, favoring crime and causing a decrease in trust for institutions. For these reasons, it is a social criticality that institutions must carefully address. High levels of inequality prevent less well-off groups from receiving an adequate education, accessing healthcare, and living in dignity. Part of the world’s population is therefore denied opportunities that should be within everyone’s reach.
3. Middle income trap: a significant risk
In the previous paragraph, encouraging projections have been highlighted regarding the growth of the middle class of Asian emerging countries. In the economic literature the expression “Asian Century” is now widespread, to indicate the position of economic dominance that Asia will occupy during the 21st Century: however, to obtain a balanced and realistic perspective on this issue, we will also have to consider the difficulties linked to the realization of the so-called “Asian Century”. Although this scenario is supported by the research of numerous economists and institutes, we must not believe it to be certain and risk-free; on the contrary, it will be a complex journey. In fact, there are several structural problems that will have to be solved in the long term.
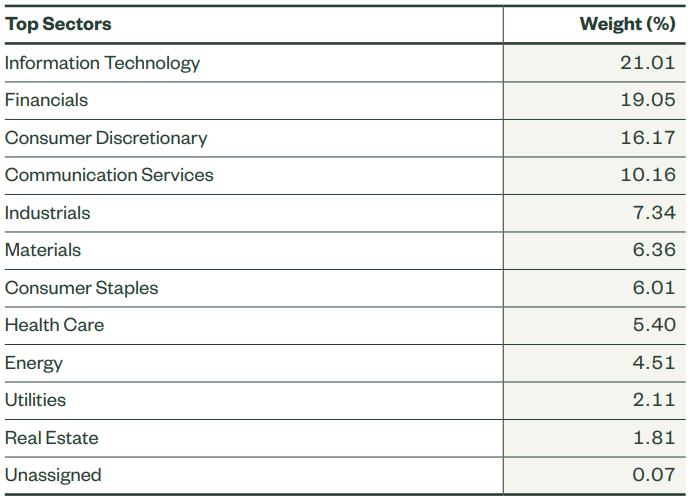
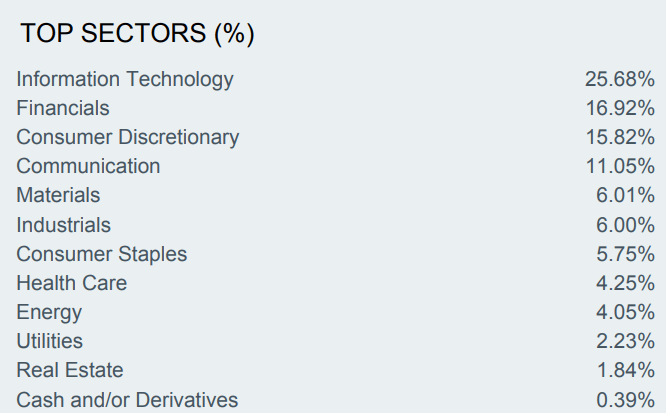
China, for example, has seen very high growth rates over the past 30 years, becoming the second largest global economy by gross domestic product, just after the United States. Over the past decade, however, its growth has started to show the first signs of weakness. If, on the one hand, some attribute this slowdown to purely cyclical factors, thus expecting that sooner or later it will be able to return to the previous levels of growth, according to others, the causes are structural. The latter include, for example, social instability deriving from growing income inequality and the policies of the Communist Party, the increase in production costs due to rising wages and the country’s excessive economic dependence on exports. China is experiencing problems in the real estate sector, since the recent crisis that hit developers. Contributing to about 25% of China’s GDP, the property market represents a major engine for the economic growth of the country. About 80% of household assets in China are related to real estate. Furthermore, more than 80% of households own a home, compared with a rate of 65% for the United States. Most of the citizens’ wealth is linked to the real estate market. As the country is facing a major oversupply of unsold apartments, the inability to maintain, in the long run, a robust property market could represent a significant drag on growth. Figures 4 and 5 show the sector distribution of GMF and EEMA.
BBCP Research
Figure 4 – Sector distribution of GMF
BBCP Research
Figure 5 – Sector distribution of EEMA
The real estate sector represents a small portion of both GMF and EEMA (1.81% and 1.84% respectively). However, given the strong relationship between the Chinese economy and the property sector, GMF and EEMA have an indirect exposure to the latter. China weights in them for more than 40%, so a contraction of the Chinese real estate sector could hurt returns, even without a significant direct exposure to it.
Another risk is represented by the so called “middle income trap”. The expression middle income trap was born to explain a phenomenon observed in some countries of Latin America and the Middle East; that is, the inability to make the transition from a middle-income country to an advanced economy. Cheap labor, the development of basic technologies, and the allocation of labor and capital in high-yield sectors, such as manufacturing, allow low-income economies to grow rapidly into middle-income economies. This first phase of growth is often followed by a phase of stagnation, which not all countries are able to overcome. New sources of economic growth will have to be tapped. Otherwise, these countries will not be able to compete either with low-income states, which can count on cheaper labor, for example, or with high-income states, which are superior in high-tech sectors.
To better understand how the Asian countries could fall into the middle-income trap, let’s briefly review the growth trajectories of some regions of the globe. Five Latin American countries, namely Argentina, Chile, Brazil, Colombia, and Mexico, grew rapidly from 1950 to the mid-1970s, before settling at stagnant growth levels. Among those mentioned above, the only states that in the 2000s achieved the status of high-income countries are Chile and Argentina, although the latter was recently downgraded to middle-income status due to the period of deep crisis it is going through since 2018. In contrast, Japan, and the so-called Four Asian Tigers, namely Singapore, Taiwan, Hong Kong, and South Korea, have seen extremely significant growth since 1960. In 1960, the average per capita income of the Four Asian Tigers was about 15% of the US one. In 2017, it became 85% of that of the United States.
At this point, we need to ask ourselves whether states such as China, Indonesia, Malaysia, the Philippines, Thailand, and Vietnam will be able to repeat the growth trajectory of the Four Asian tigers or will they conform to that of the countries of Latin America. Numerous articles and publications give Asian countries an extremely important role in the future development of the global economy. Potentially, this scenario could come true, even if there is the risk that these states prove incapable of making the correct corrections to their economic and social structure to be able to sustain a new phase of growth, different from the previous one.
4. Income inequality and urbanization
In the economic literature, there appears to be a consensus that “inequality reduces progress in health and education, leads to economic and political instability, […] and reduces the speed and duration of growth” (Ostry et al., 2014). A distinctive feature of the Asian continent is that, in this region, a large part of the inequality arises when comparing the levels of income distribution of different countries, even neighboring ones. Conversely, in areas such as Europe, North America or Latin America, inequality is not particularly marked among the populations of neighboring states. For example, the ratio of the GDP per capita of Singapore to Indonesia reached a value of 8:1 this year. Furthermore, according to future growth projections, the ratio between Indian and Pakistani average incomes could widen from the recent 1.3 to a value of 5.2 in 2050. There is a risk that in the future, if some countries continue to grow faster than neighboring ones, extremely marked regional disparities will be created. Not all countries would be able to capture the benefits of global growth.
Focusing on the inclusion of less well-off categories in the process of social development, while promoting conditions of equality, is ethically reasonable. Growth strategies cannot succeed unless they are accompanied by an ongoing commitment to equality of opportunity. Indeed, high levels of inequality put economic growth, as well as social progress, at risk. They lead to the building of institutions that favor those who already possess economic and political power. Conversely, equality leads to the defense of the interests of a greater number of individuals. Income inequality leads to a worsening of economic growth in the medium and long term. If citizens at the bottom end of the wealth distribution cannot afford education and medical care, they will hardly be able to contribute to the development of technological and highly productive industries. These are the industries that would allow emerging economies to mature into advanced economies. High levels of education and workers’ health are needed to allow the development of the so-called knowledge-based economies.
According to a United Nations report, there will be 1.2 billion new urban residents in the Asia-Pacific region by 2050. This demographic trend will lead to significant social, economic, and environmental changes. The growth of middle-income Asian countries is mainly due to the industrialization of urban areas. It will be essential to build cities capable of supporting technological development, growing levels of productivity and a decent quality of life. Despite the rapid economic growth of many Asian cities, infrastructural problems associated with, for example, unreliable energy supplies, low water availability and uncollected waste are frequent. Especially in the poorest areas, these problems tend to worsen the hygienic conditions of the population, with serious consequences on their health. Until now, most large Asian cities do not have the same levels of crime and violence as South American cities. In Latin America, the rate of urbanization is higher than in the Asian region: however, Argentina, Brazil, Mexico, and Venezuela have not been able to handle the growth of illegal activities and the formation of completely abandoned peripheral areas from an economic and social point of view. The inability to improve the living conditions of the poorest sections could lead to the realization of the South American scenario for various Asian regions.
The increase in the rate of urbanization that is affecting the Asian territory will lead to greater energy needs and greater carbon dioxide emissions: the manufacturing and transport industries are the sectors that involve the most energy expenditure in the region. This is an aspect that cannot be ignored since environmental pollution represents one of the most significant problems of the 21st Century. CO₂ emissions in the atmosphere represent the main cause of climate change and global warming: in the future, cities will have to become increasingly efficient in the use of energy. In 2020, the share of CO₂ emissions in the Asia-Pacific region of total global emissions was 52.4%; this is a very high number when compared with 16.6% in North America, 11.2% in Europe, 6.3% in the Middle East and 3.7% in Africa. The annual growth rate of CO₂ emissions is also the highest at 2.7% in the Asia-Pacific region, versus -0.4% in North America, -1.1% in the Europe, 2.7% in the Middle East and 2% in Africa.
Compact, high-density cities, such as Singapore, Seoul, and Tokyo, have lower CO₂ emissions per capita than lower-density cities. A high urban density makes it possible to encourage public means of transport and to make the use of a car unnecessary, allowing for a considerable reduction in emissions. The governments of Asian countries experiencing rapid growth in the urbanization rate should promote the construction of infrastructures that can prevent the uncontrolled sprawl of urban agglomerations. Attention to the aspects of energy efficiency and technological innovation is needed: ignoring these issues would mean encouraging the proliferation of urban areas that are inefficient from an energy point of view and unable to sustain the levels of productivity necessary to allow long-term economic growth.
With regards to the sustainability characteristics of EEMA and GMF, these funds do not follow an ESG investment strategy. EEMA has an ESG score of 5.56/10, and GMF 5.42/10. Sustainability is clearly not the main priority for these two ETFs.
5. Productivity and innovation
Paul Krugman published an article, in 1994, in which he addressed the issue of Asian growth. In particular, he has been concerned with questioning the sustainability of Asian growth, stating that it cannot continue indefinitely at the same speed as in previous decades. To understand the reasons, it must be considered that economic expansion is driven, according to Krugman, by two factors: “the first is represented by an increase in inputs, such as the number of workers, their level of education and the stock of physicalcapital. The second is represented by an increase in output per unit of input.” (Krugman, 1994)
By applying the above model, a country’s growth should be decomposed: how much of it is due to an increase in inputs and how much to an improvement in efficiency? Long-term sustainable economic growth necessarily includes improvements in efficiency, which is in turn attributable to technological innovation. Since the returns on inputs are diminishing, if only these improve, sooner or later a hard limit will be reached. The growth of Asian countries in the second half of the 20th Century was largely due to a strong increase in inputs such as capital and labor. The efficiency improvements were negligible. However, to achieve long-term growth a country needs to focus on innovation, which allows you to improve productivity levels.
By looking at the figures 4 and 5 displayed before, showing the sector distribution of the 2 ETFs, it’s possible to see that the sector that weights the most is information technology, 21.01% for GMF and 25.68% for EEMA. The funds are well-positioned to benefit from improvements in technology, which will have a positive impact on every other sector, because of increased productivity levels.
The countries of South-East Asia have based their growth on becoming places of strategic importance for the supply chains of Japanese companies. Malaysia and Thailand have attracted substantial investments from Japan, which has benefited from cheap labor. China has also offered excellent opportunities to reduce production costs for foreign companies. However, if the countries mentioned, such as Malaysia, Thailand, and China, are not able to enhance their technological innovation, over time they will lose more and more market shares against countries such as India, Indonesia, Vietnam, Cambodia, and Myanmar. Even the latter countries, in fact, make low-cost labor a significant source of competitive advantage. If the growth in workers’ wages is not supported by a simultaneous growth in productivity, foreign companies will have an incentive to divest and abandon those suppliers who can no longer offer the best conditions on the market.
The case of China is emblematic for understanding the importance of increasing productivity. China’s working class declined by more than 41 million in the past three years. Since a country’s working class represents its largest group of consumers, a reduction in workers could be followed by a contraction in domestic demand. To sustain growth in the face of a shrinking working class, China will need to focus on developing productivity. This is a crucial factor: if productivity increases, firms can pay more a smaller number of workers, who, having a higher salary, can support domestic demand. From 1995 to 2013, the average annual growth rate of productivity in China was 15.5%. Just as China’s working class reached its peak in 2015, productivity growth slowed to 5.7% between 2014 and 2017.
6. Ease of doing business and governance indicators
The World Bank report called Doing Business collects significant information on the ease of doing business in a certain country. A state that wants to grow and improve the living conditions of its citizens must pay close attention to the way in which the regulatory system influences the development of small and medium-sized local businesses. The ease of doing business translates into greater investment opportunities in the country. It also accelerates technological development, allowing for improvements in total factor productivity: an essential requirement for growth. China and India fall within the group of the 10 countries which, in the two-year period 2017-2018, improved the score on the ease of doing business the most, thanks to the reforms implemented in recent years. The score is calculated considering how different regulatory and operational procedures affect the management of an enterprise. In total, the variables referred to are eleven and can be grouped into the following categories: opening a business; getting a location; accessing finance; managing day-to-day operations, including exports and imports; operating in a secure business environment.
Through a series of reforms aimed at encouraging business development, China has significantly reduced the time it takes to connect to the electricity grid. In addition, it has implemented various solutions to make import and export processes more efficient, reducing the time and costs required. From a distribution point of view, India has also made progress: the documentation required in the import and export processes has been reduced and the electronic information systems have been improved. The Chinese and Indian government apparatuses are therefore implementing reforms aimed at favoring local businesses.
However, the difference between the governmental quality of emerging Asian countries and that of advanced countries is still significantly marked. This is what emerges from the so-called Worldwide Governance Indicators calculated by the World Bank. These indicators measure six dimensions: voice and accountability (i.e. the citizens’ freedom of expression and the government’s tendency to account for the results obtained); political stability and absence of violence/terrorism; government effectiveness (includes the quality of policy formulation, as well as the credibility of government’s commitment to their implementation); regulatory quality (aimed at the development of the private sector); similarity to the rule of law model; control of corruption.
The Worldwide Governance Indicators show how OECD countries markedly outperform Asian emerging countries in each of the six reference items. The gap to be filled with the developed states in terms of institutional quality is still evident. To date, in Asia, there are frequent government systems that do not involve citizens enough in the choice of the political measures to be implemented. The hypothesis according to which democracy would represent a stimulus to economic growth is based on the following consideration: in a democratic regime every segment of the population is given a voice, both the poorest and the middle class. A governmental apparatus capable of considering their requests and needs would lead to an increase in their economic well-being and productivity. For these reasons, domestic demand and production would be stimulated, favoring long-term sustainable growth.
Conclusions
Starting from the considerations made in the previous paragraphs, it is possible to derive some concluding reflections. Among the most significant opportunities that concern the emerging Asian countries we find the strong rise of the middle class. It is a demographic trend that will enrich the continent with new consumers, willing to improve their lifestyle. However, there are several critical issues which, left unresolved, can limit the growth of these countries in the long term. Among the most pressing problems we mention the considerable income inequality of the Asian territory and the need to increase investments in infrastructure and technological innovation, aimed at improving productivity levels. Furthermore, by making a comparison with more developed countries, there is a considerable gap with respect to the quality of governance: this is a significant issue, because the choices made by the institutions will play an active role in defining the future growth scenarios of the emerging Asian countries. Despite these challenges, we believe that investing long term in GMF means exposing your portfolio to a section of the globe that is reasonably going to experience remarkable growth in the next decades.
We would like to thank A. Sarti for his research for this piece.
The World’s Most Talent Competitive Countries, 2022
Enjoyed this article? Sign up for our newsletter to receive regular insights and stay connected.