
tigerstrawberry
Few names have as much resonance in the ever-changing global economy as Amazon (NASDAQ:AMZN). A titan in the fields of cloud computing, technology and e-commerce that certainly needs no introduction. The brand has long become an household name, often being the go-to option when people are looking for products online.

Leading brands worldwide in 2023 (statista)
Other than the e-commerce segment, the other operations of Amazon are pretty unknown in the general public – except, perhaps, for our savvy investor community that really digs deep into the company’s operations. The vast business ventures of Amazon also become apparent if we take a look at the patents filed over the last years.

Number of patents in the United States granted to Amazon (statista)
In this analysis we are exploring each distinct business segment of the complex Amazon in order to obtain a thorough grasp of the company’s present growth trajectory and, consequently get an idea of its current and justified valuation due a Discounted Cash Flow Analysis. I separated the company into the following segments:
- Online Stores – 1st Party
- Online Stores – 3rd Party
- Physical Stores
- Advertising
- Subscriptions
- Cloud – AWS
For simplicity purposes the “Other” segment of Amazon’s earnings releases isn’t covered in this analysis. The segment only takes up around >1% of the revenue.
Starting Point
Amazon is currently only disclosing the operating income per segment for “North America”, “International” and “AWS”.

Amazon Revenue Per Segment 20-23 (Amazon earnings)
Looking at the top-line however, we get the information from AMZN how the company’s revenue is distributed between the different segments:

Amazon Revenue Per Segment (aboutamazon.com)
The revenue metrics for each venture of Amazon is great, but to eventually evaluate the company, we’ll have to know the margins for each one. To get a starting point on margins I took a series of assumptions.
First of all the Cloud EBIT margin is certain and is currently at around 30%, as Amazon itself is declaring it in every quarterly or annual earnings report, see above for example. From there on I was looking at the other pretty independent segment Advertising. The two main peers in the advertising space are Alphabet (GOOG) and Meta (META). The margins of these two are somewhere between 25% and 30% right now. If we only factor in Google’s Services business, we even get an EBIT margin of 32% to 39%. I by the way recently valuated Google in a similar way, find the article here.
For the starting point however we assumed the low end of that range – so 25% – in this segment for Amazon.
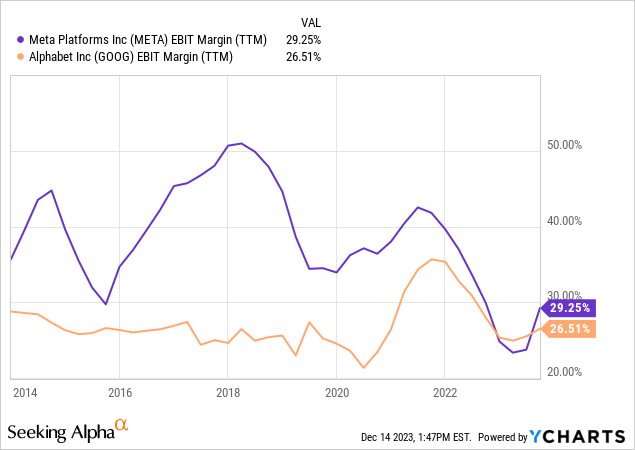
Data by YCharts
I then broke down the rest of the EBIT on the remaining business segments for each financial year to come close to the declared EBIT. Exact metrics here are very hard to predict because some of the segments overlap. The free shipping of Amazon Prime for example influence the revenue for the Subscriptions side but weighs in on the profitability of the 1st and 3rd Party Online Stores. These metrics however just serve as the starting point for each segment, as in a Discounted Cash Flow Analysis not only the future but also the present plays an significant role.
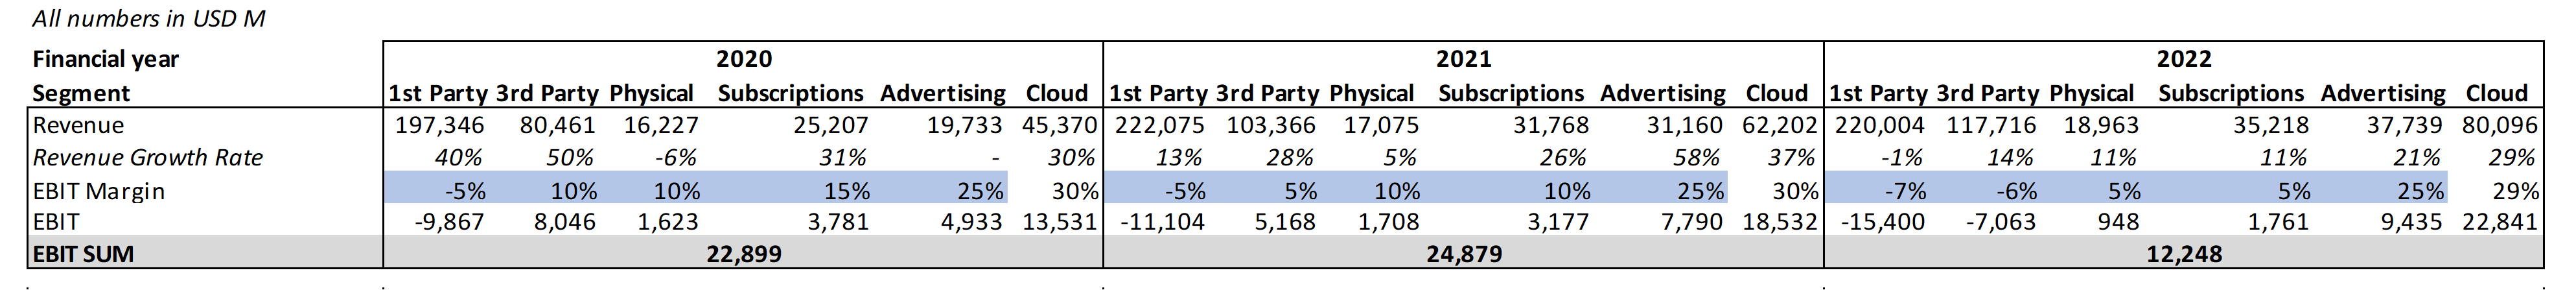
Amazon Profitability Per Segment (aboutamazon.com; own assumptions)
Online Stores – 1st Party
The primary e-commerce retail activities where Amazon itself serves as the product seller to final customers are referred to as the “1st Party Online Stores” business area of Amazon. In this market, Amazon buys products from producers, retailers, or other vendors and uses its online store to sell them straight to consumers.
The global e-commerce sales are expected grow at a CAGR of 14.4% until 2027.
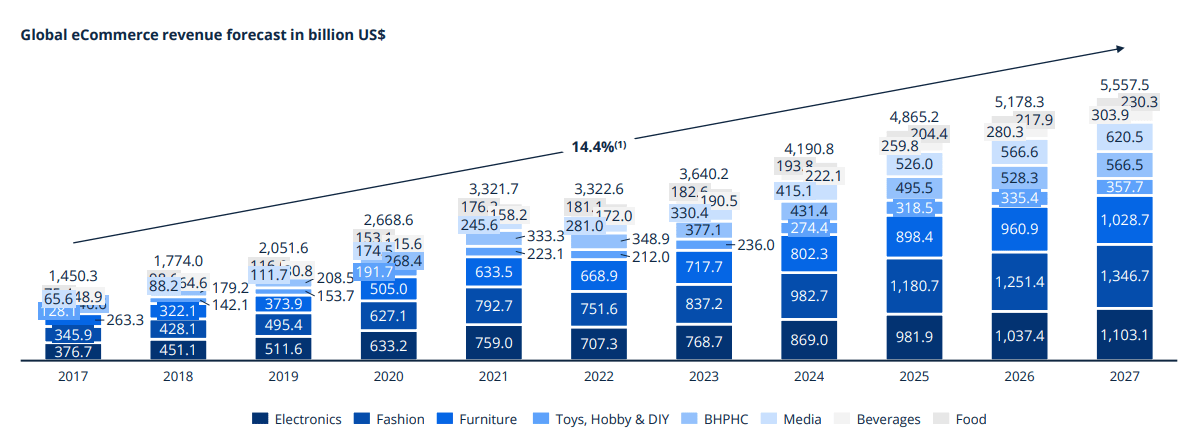
Global eCommerce Revenue (statista)
While the growth in 2022 was flat, I believe that most of the weakening factors of this year will be resolved over the next few years. Here is a nice comparison between the growth factors of e-commerce and the weakening factors:
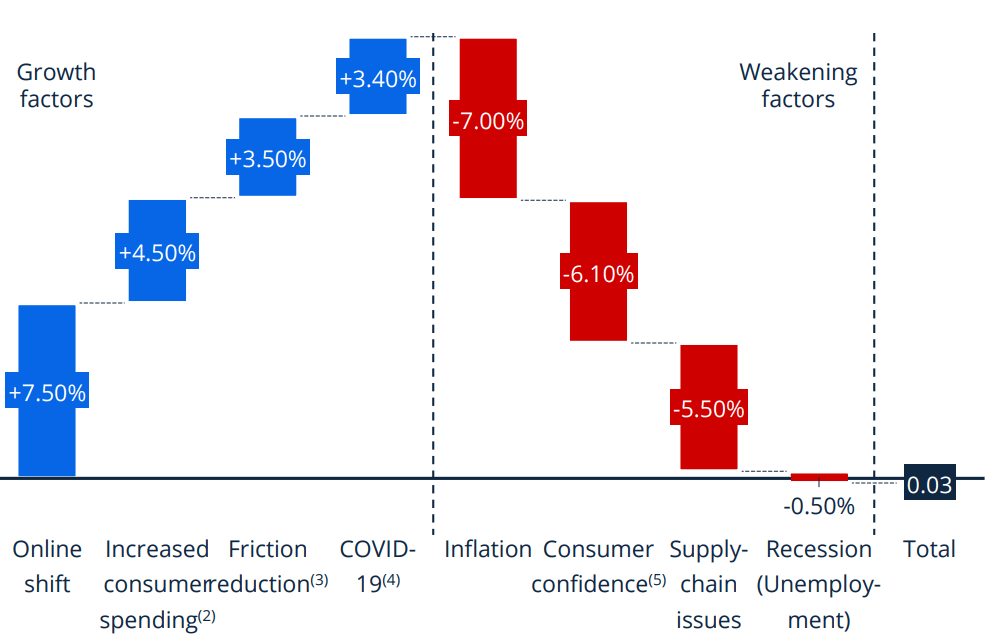
Growth and Weakening Factors E-Commerce (statista)
Inflation should get better since the current inflation metrics in the US and in Europe are decreasing steadily. Same can be said for Consumer Confidence and Supply-Chain Issues as the global economy is set to perform better than many expect.
Even with these encouraging signs, there are still potential risks associated with the e-commerce industry. There might be a decline in consumer spending if the aforementioned move towards online platforms slows down or if there is another setback in the overall economy. This might thus lead to slower development or possibly a halt in the e-commerce industry.
Another aspect for the 1st Party Online Stores is the fact that Amazon is currently decreasing its overall share of 1st party transactions and consequently increasing the 3rd party sales. Keeping that in mind, I believe, it makes sense to decrease the anticipated market growth rate for 1st party to 10%.
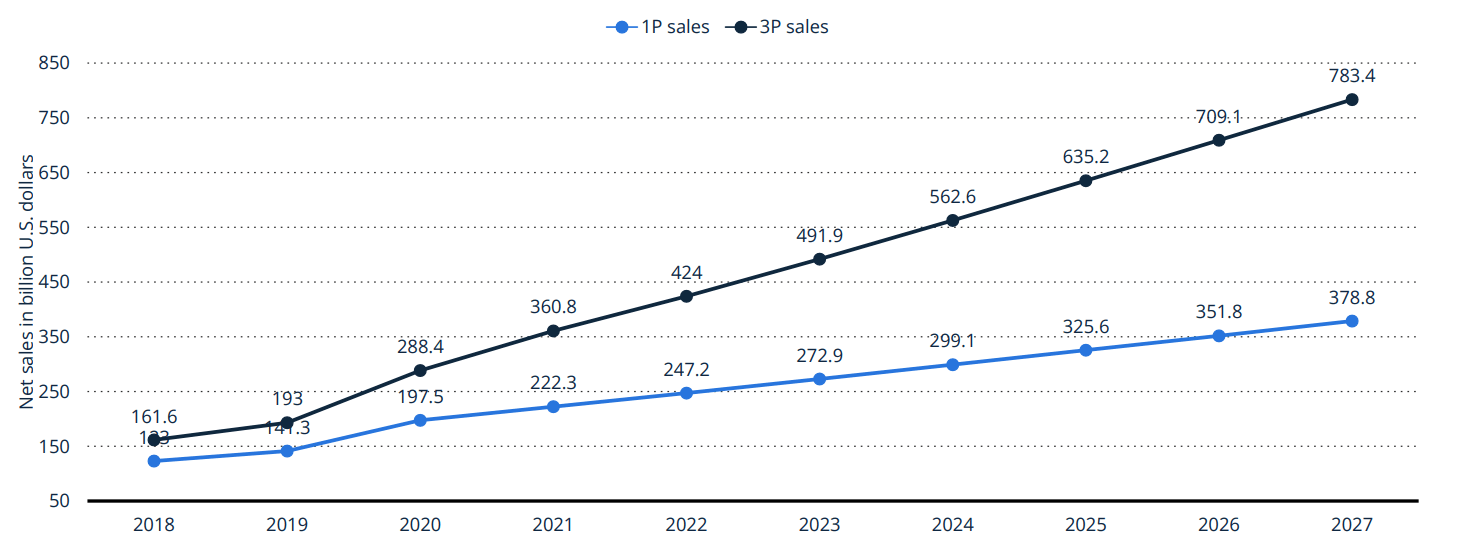
Amazon E-commerce Sales By Business Model (statista)
To now adjust for the Worst- and Best-Case scenario, I anticipate the following revenue growth rates for our two scenarios:
Bear Case: 8% p.a.
Bull Case: 12% p.a.
Switching over to the expected margins for this segment, we first take a look at the average industry margins of e-commerce. In 2022 this metric was right around 7%.
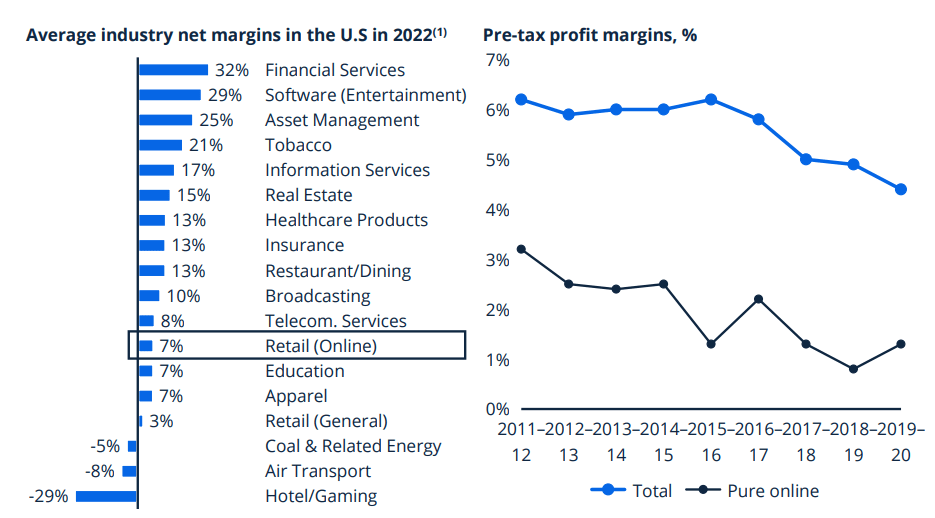
Average Industry Margins (statista)
If we however take a look at two of Amazon’s main competitors in this space, Walmart (WMT) and Target (TGT) we can see that the EBIT margin of these two hovers somewhere between 4% and 7%.
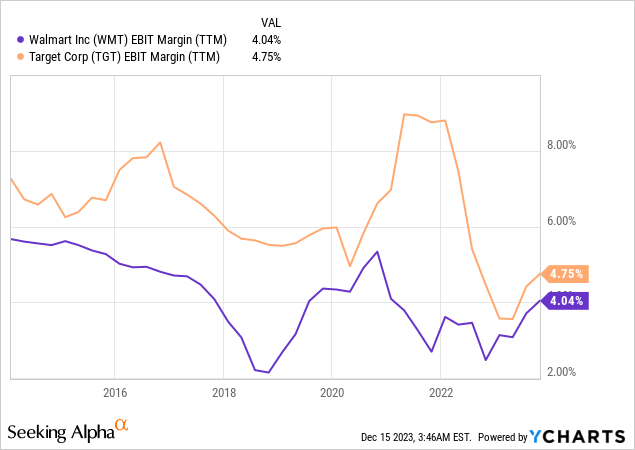
Data by YCharts
I think that Amazon, as the market leader, should be able to achieve better margins in the long term due to the sheer scale and pricing power the company owns.
We however also have to account the fact, that the company is currently at a EBIT margin of -7% in this segment – at least to our predictions in the beginning. With this in mind I anticipated the following EBIT margins for the 1st party segment:
| EBIT Margin 1st | 2022 | 2023 | 2024 | 2025 | 2026 | 2027 | 2028 | 2029 | 2030 |
| Bear | -7% | -2.5% | 0% | 2.5% | 5% | 5% | 5% | 5% | 5% |
| Bull | -7% | 0% | 2.5% | 5% | 7.5% | 7.5% | 7.5% | 7.5% | 7.5% |
Online Stores – 3rd Party
Amazon’s “3rd Party Online Sales” business segment describes the marketplace on the site where independent vendors can list and sell their goods to consumers directly. In this market, Amazon gives enterprises and independent sellers a way to connect with a large number of customers without having to put up their own e-commerce infrastructure.
As mentioned in the 1st party segment above, Amazon is currently laying emphasize on expanding the operations in the 3rd party segment. This makes a lot of sense for Amazon, as the customers that use this service are very content with the current situation and most of them plan to expand their operations on the Amazon marketplace.
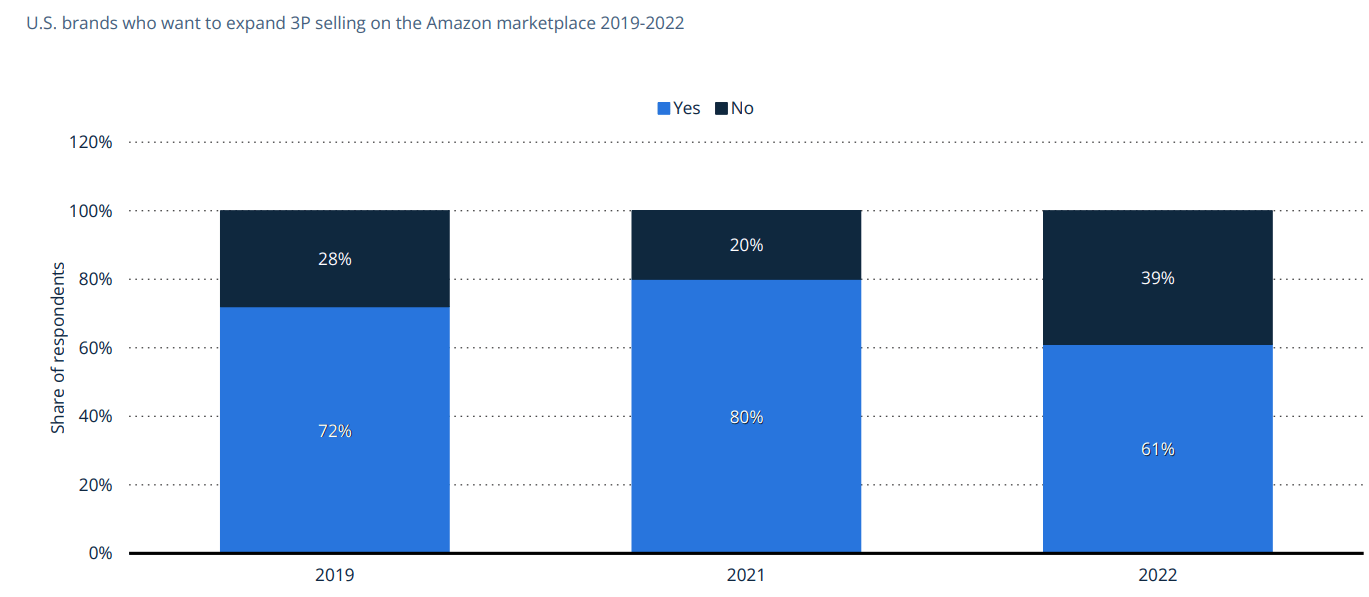
U.S. Brands Who Want To Expand 3P Selling (statista)
With the anticipated 14.4% growth rate for the whole e-commerce market, I think these assumptions seem fitting considering the above mentioned facts:
Bear: 14% p.a.
Bull: 20% p.a.
Not only growth wise, but also considering the potential margins the 3rd party segment seems like an way better option for Amazon. If we take a look at two American competitors in this space Etsy (ETSY) and eBay (EBAY) the achievable margins lie in the range of 20% to almost 40%.
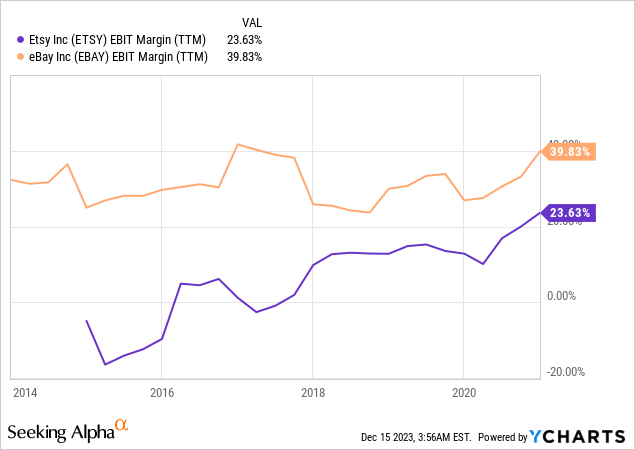
Data by YCharts
With this in mind, I anticipated the following EBIT margins:
| EBIT Margin 3rd | 2022 | 2023 | 2024 | 2025 | 2026 | 2027 | 2028 | 2029 | 2030 |
| Bear | -6% | 0% | 5% | 10% | 15% | 20% | 20% | 20% | 20% |
| Bull | -6% | 5% | 10% | 15% | 20% | 25% | 30% | 30% | 30% |
Physical Stores
Amazon operates a number of brick-and-mortar retail businesses under its physical shops business category. This section is an outgrowth of Amazon’s plan to penetrate the conventional retail market and increase its footprint outside of the internet. This segment includes Amazon Go Stores, Whole Foods and Amazon Fresh Stores.
Top-line growth in this segment has been between 6% and 13% in the last quarters.

Physical Stores YOY Growth (Amazon Earnings Q3/23)
This seems like a very slow segment at the moment, so I think these growth metrics are fitting:
Bear: 6% p.a.
Bull: 10% p.a.
Taking a look at the margins of one competitor Kroger (KR), it becomes clear that this segment doesn’t seem like a massive opportunity for Amazon, as is hovers around 2%.
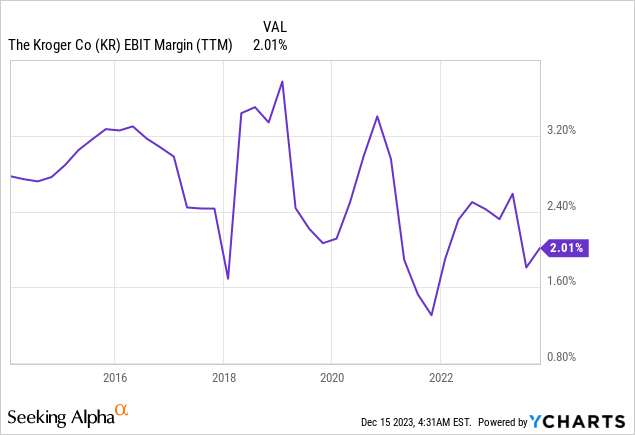
Data by YCharts
With Amazon’s “Amazon Go” technology, where stores don’t have cashiers and are therefore semi-automated, higher margins could be achievable. This segment however shouldn’t be a focus segment for Amazon as growth is very capital extensive and the upside seems limited.
We get the following margins for this segment:
| EBIT Margin Physical | 2022 | 2023 | 2024 | 2025 | 2026 | 2027 | 2028 | 2029 | 2030 |
| Bear | 5% | 5% | 5% | 5% | 5% | 5% | 5% | 5% | 5% |
| Bull | 5% | 10% | 10% | 10% | 10% | 10% | 10% | 10% | 10% |
Subscriptions
The income from services like Amazon Prime is the main source of revenue for Amazon’s “Subscriptions” business division. The membership service Amazon Prime, which provides members with a number of advantages, has grown to be a vital source of engagement and consumer loyalty for the business. This segment includes services like Prime, Amazon Music and Kindle.
If we take a look at the revenue growth in this segment, we can see that from 2018 to 2021 Amazon achieved growth rates above 25% consistently. However the segment experienced a slowdown to “only” 11% in 2022.
| [million USD] | 2018 | 2019 | 2020 | 2021 | 2022 |
| Revenue | 14,168 | 19,210 | 25,207 | 31,768 | 35,218 |
| YOY Growth | 46% | 36% | 31% | 26% | 11% |
This slowdown continues in the latest quarterly earnings where Amazon declared a current YoY growth rate of 13%.

Revenue Subscriptions (Amazon Quarterly Earnings)
With this in mind these future growth rate seem realistic:
Bear: 10% p.a.
Bull: 15% p.a.
The margins of Netflix (NFLX), a comparable business in this segment currently sit at around 18%.
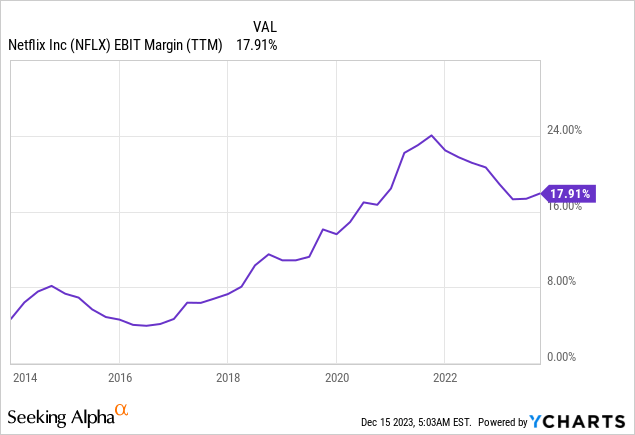
Data by YCharts
Through the high downside in this segment due to the free shipping, that customers get on top when subscribing to Prime, I believe that the following EBIT margins are achievable for Amazon:
| EBIT Margin Subs | 2022 | 2023 | 2024 | 2025 | 2026 | 2027 | 2028 | 2029 | 2030 |
| Bear | 5% | 10% | 10% | 10% | 10% | 10% | 10% | 10% | 10% |
| Bull | 5% | 10% | 15% | 15% | 15% | 15% | 15% | 15% | 15% |
Advertising
The income the company receives from its advertising services is referred to as the advertising business segment of Amazon. With the help of its extensive e-commerce ecosystem and consumer data, Amazon has developed a sizable advertising platform that provides customized advertising options. This segment basically contains the revenue from the ads us customers see on Amazon or from the merchants that pay for more visibility on the amazon website.
The general digital ad spend is predicted by experts to grow like this:
- 2024: 10.9%
- 2025: 10.0%
- 2026: 9.20%
- 2027: 8.60%
Amazon is however heavily expanding its market share in this segment, which is why I anticipate, that the company will grow above the general market:
Bear: 12% p.a.
Bull: 15% p.a.
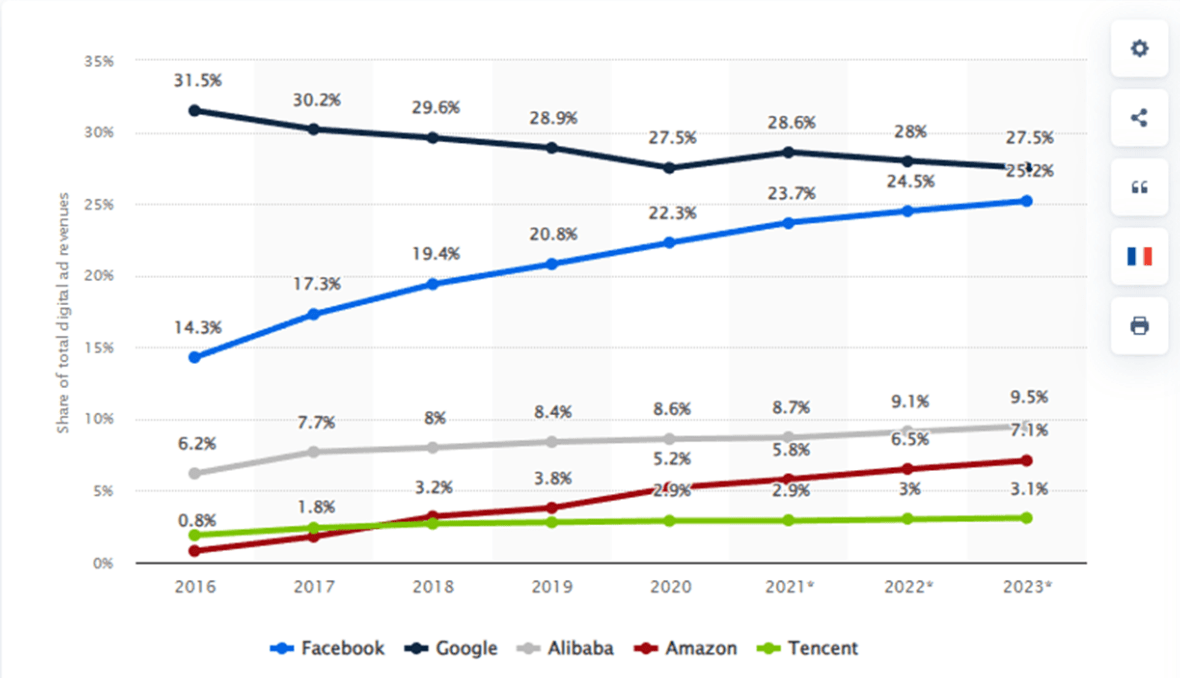
Net digital advertising revenue share of major ad-selling online companies worldwide from 2016 to 2023 (statista)
Like mentioned in the chapter “Starting Point”, Meta is currently sitting at margins around 30%, while the services business of Google achieved margins from 32% to 39% in the last years. Amazon should be able to meet or even exceed these metrics, since the ads by Amazon are very targeted to customer who already have the willingness to buy something, because they are on the Amazon website. This should consequently lead to higher Click-Trough-Rates and consequently to higher revenue and profitability for Amazon.
With this in mind we can anticipate the following margin development:
| EBIT Margin Ads | 2022 | 2023 | 2024 | 2025 | 2026 | 2027 | 2028 | 2029 | 2030 |
| Bear | 25% | 30% | 30% | 30% | 30% | 30% | 30% | 30% | 30% |
| Bull | 25% | 30% | 35% | 40% | 40% | 40% | 40% | 40% | 40% |
Cloud – AWS
Amazon Web Services is the name of the company’s cloud division (AWS). AWS is a feature-rich and extensively utilized cloud computing platform that provides a range of services, such as analytics, machine learning, storage, database management, processing capacity, and more. These services may be used by companies and people to create and launch apps, store and retrieve data, and pay-as-you-go access a variety of computer resources.
Cloud is definitely the “holy grail of growth” for Amazon as the company has managed to grow this segment at a revenue growth rate of ~30% over the last few years while maintaining an EBIT margin of ~30%. This is mainly because Amazon is the clear market leader in this segment, as for example the company currently owns 32% of the cloud infrastructure market, according to statista.
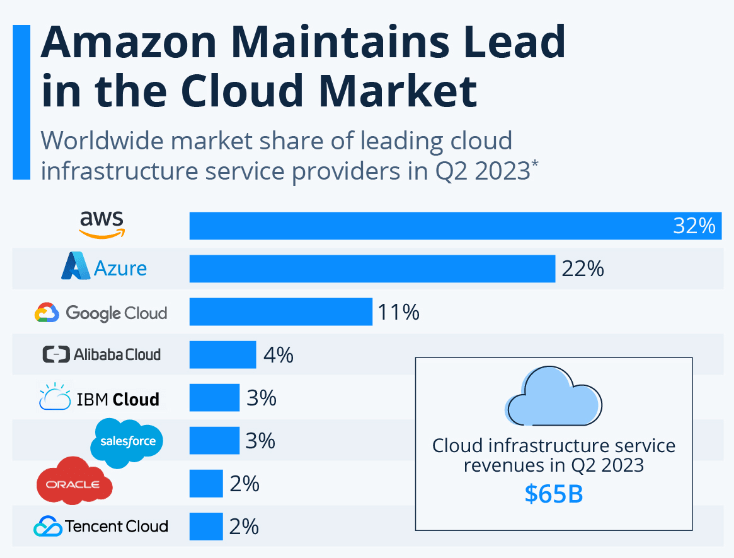
Market share in the worldwide cloud infrastructure market (statista)
The global market for cloud computing is anticipated to expand at a compound annual growth rate of 20% between 2023 and 2030. Over the last few years Amazon pretty much managed to hold its market share against the competitors, which it is reasonable in my opinion to assume growth rates right around the market rate.

Cloud infrastructure services vendor market share worldwide (statista)
Bear: 15% p.a.
Bull: 20% p.a.
I only assumed 20% p.a. for our Bull Case, as a growth above the market seems impossible when already having 30+% market share.
For margins I predicted the following:
| EBIT Margin AWS | 2022 | 2023 | 2024 | 2025 | 2026 | 2027 | 2028 | 2029 | 2030 |
| Bear | 29% | 30% | 30% | 30% | 30% | 30% | 30% | 30% | 30% |
| Bull | 29% | 35% | 35% | 35% | 35% | 35% | 35% | 35% | 35% |
Discounted Cash Flow Analysis
Now that we have predicted the revenues and margins for each relevant business segment of Amazon for the time frame 2022 to 2030, we now need a few additional assumptions to finally valuate the company.
- Tax Rate: Here I averaged out the last three years and arrived at an average tax rate of 12%.
- Free Cash Flow Conversion: I calculated the EBIAT using the above mentioned 12% tax rate and then determined a suitable EBIAT to Free Cash Flow Ratio. 2021 and 2022 seem to be clear outlier here, which is why I averaged out the metrics from 2017 to 2020. Here I arrived at 100%. To get a further margin of safety I used 85% as the EBIAT to FCF ratio to calculate the Free Cash Flow for the Bear and Bull Case.
| 2017 | 2018 | 2019 | 2020 | 2021 | 2022 | |
| EBIAT | 3,277 | 11,104 | 12,069 | 20,197 | 21,744 | 10,729 |
| EBIAT to FCF | 154% | 75% | 114% | 54% | -142% | -208% |
| FCF | 8,307 | 19,400 | 25,800 | 31,020 | -9,069 | -11,569 |
- WACC: Here I used 10%, which is right around Amazon’s current WACC.
- Perpetuity Growth Rate: Here I used 3.5%, which is pretty conservative for this company if you ask me.
Bear-Case
We start off with a quick overview of the revenue and margin assumptions of each segment:
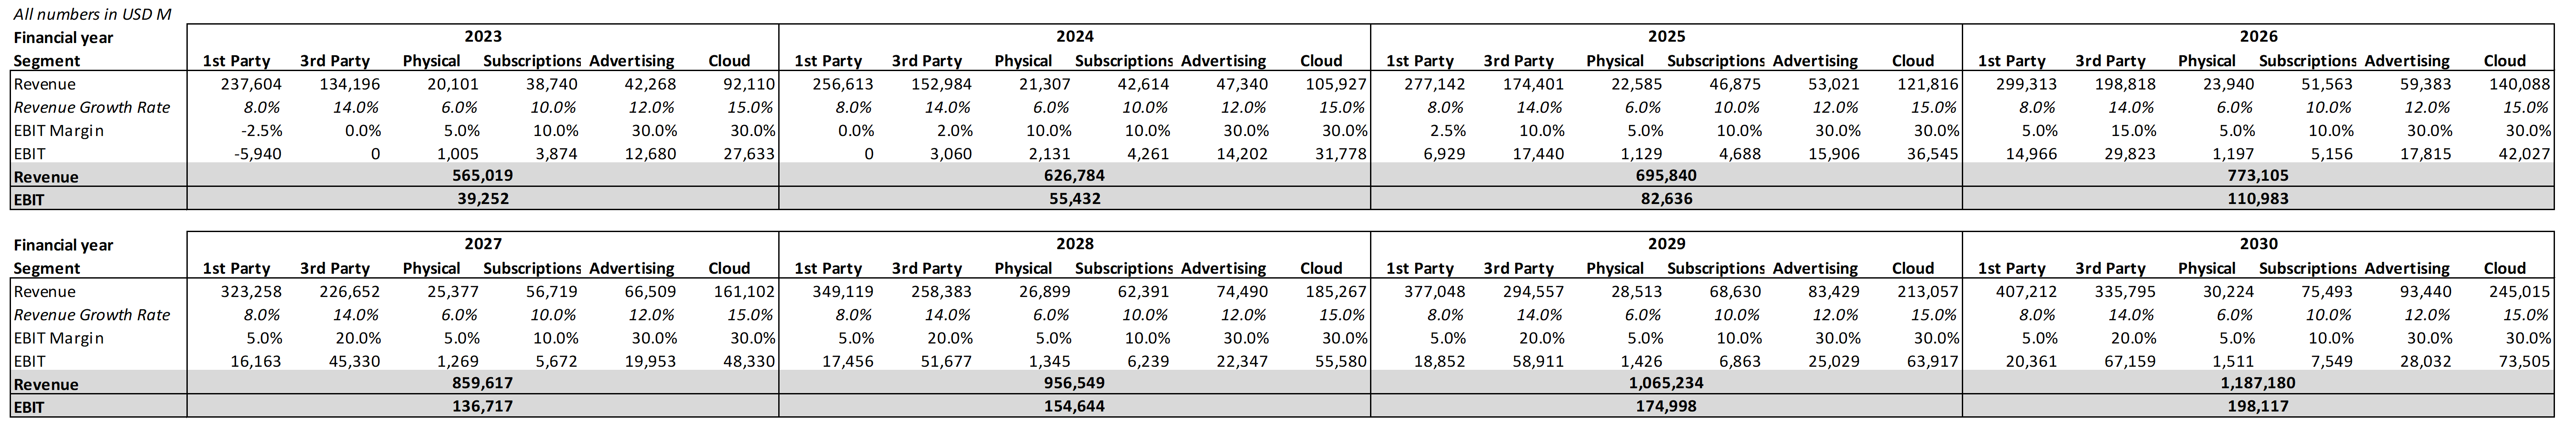
Assumptions Bear Case Amazon (own assumptions)
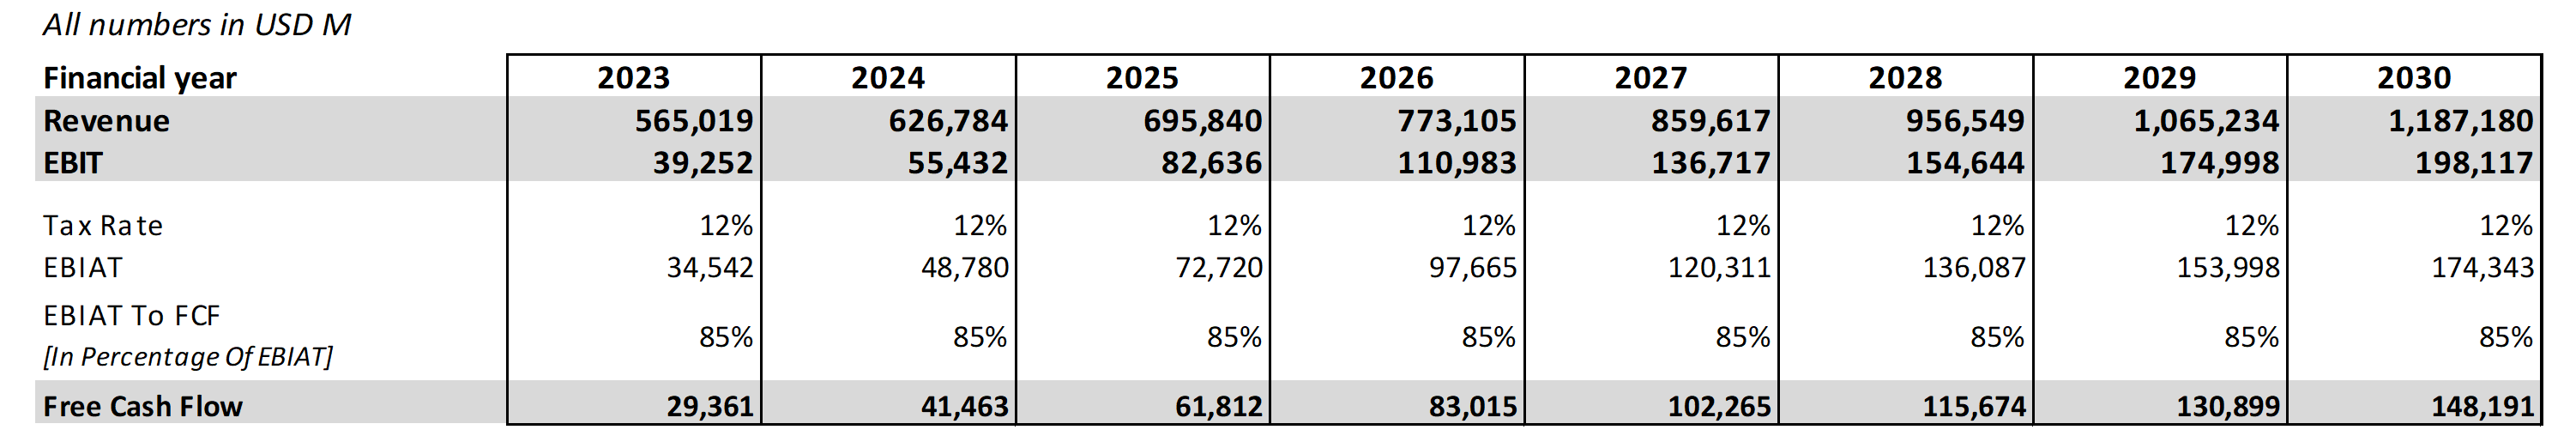
Amazon DCF Bear Case I (own assumptions; amazon.com; seekingalpha.com)

Amazon DCF Bear Case II (own assumptions; amazon.com; seekingalpha.com)
Within our Bear Case scenario, we get a fair value share price of $138, indicating that the company could be overvalued by just 6%. However keep in mind that this includes an deceleration in growth, partially growing less than the market rate and lower margins than competitors.
Bull-Case
Here are once again the main assumptions for revenue and EBIT margin summarized:
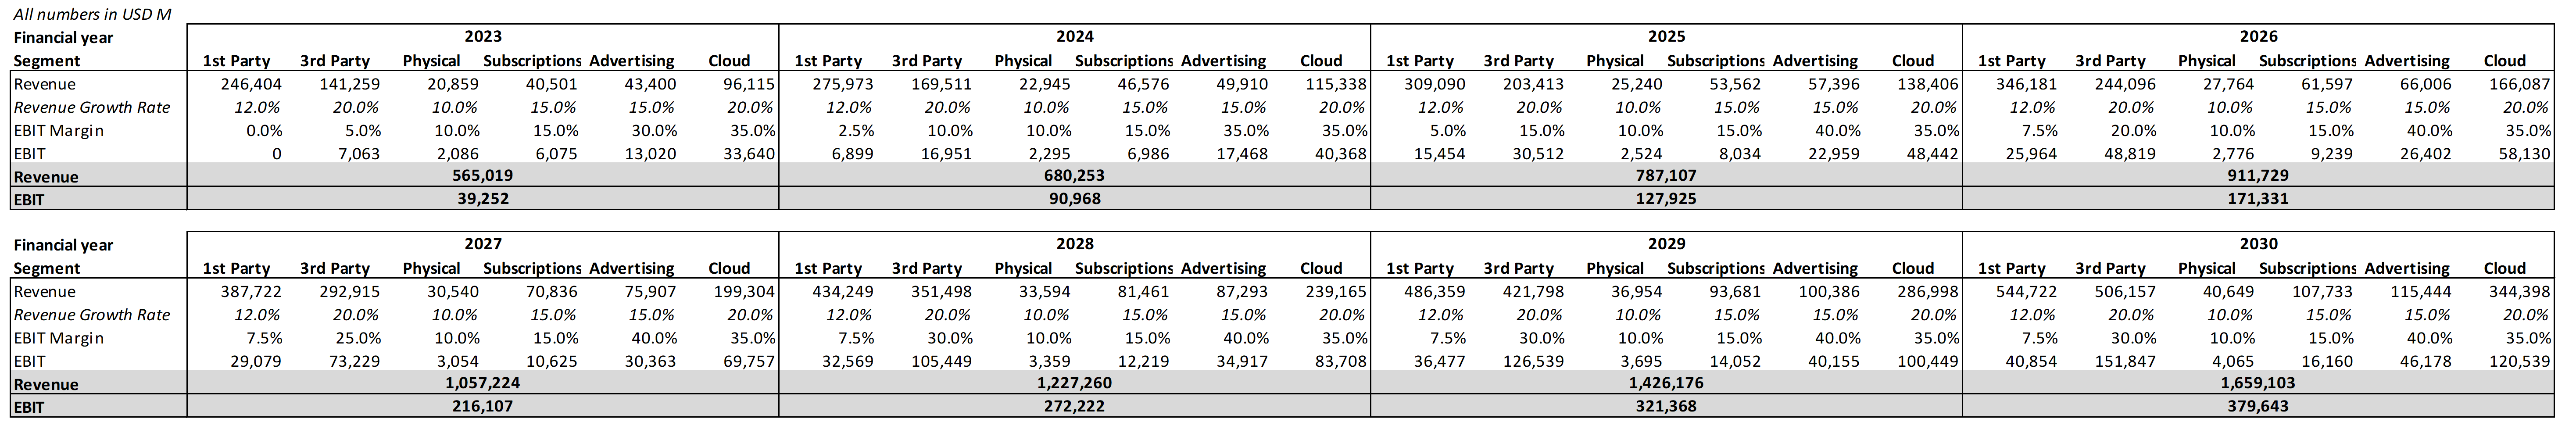
Assumptions Bull Case Amazon (own assumptions)
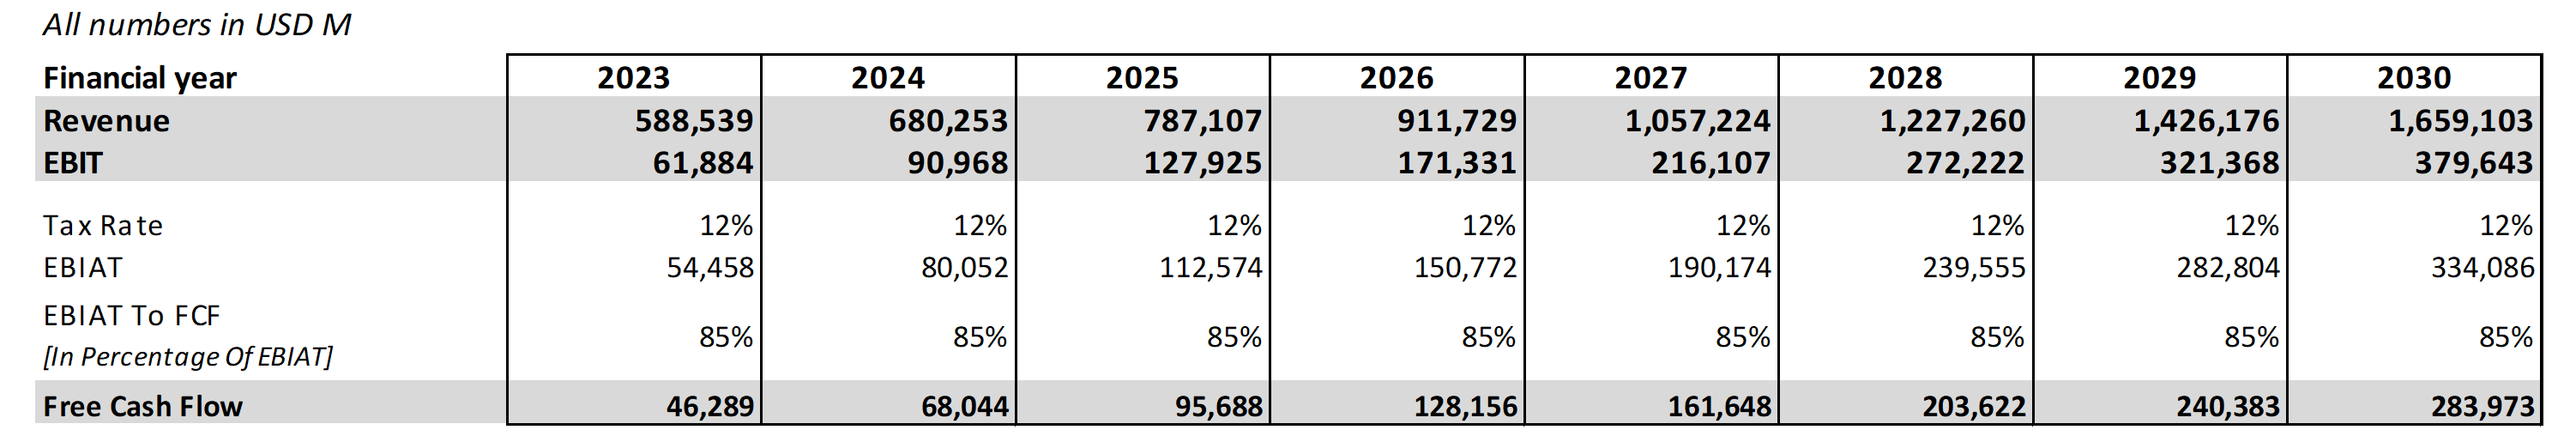
Amazon DCF Bull Case I (own assumptions; amazon.com; seekingalpha.com)
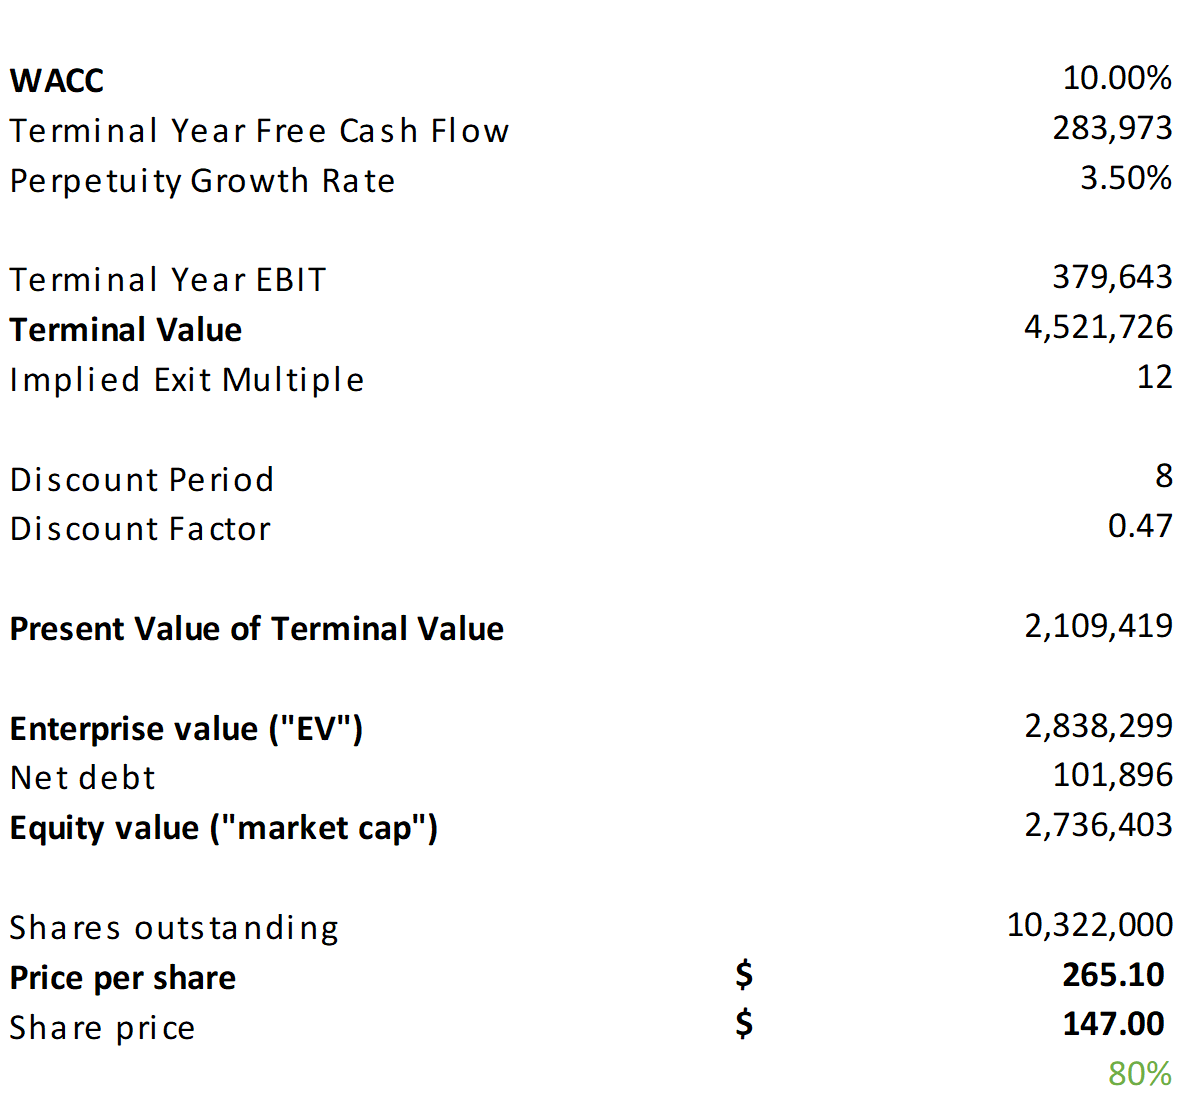
Amazon DCF Bull Case II (own assumptions; amazon.com; seekingalpha.com)
With the Bull-Case assumptions we get a fair value share price of $265. Meaning that the company could be undervalued right now by a whopping 80%. These however include growth rates above the market and profit margins on the higher end, compared to major competitors.
Things To Look For In The Next Earnings & Risks To Consider
The three focus segments for Amazon in the next few years are the 3rd Party Online Stores, the Advertisements and the Cloud segment in my opinion. For the next earnings I therefore want to see these main aspects:
- Increasing switch from 1st party to 3rd party
- Less focus on physical stores and Subscriptions
- High Growth rates in 3rd Party, Ads and AWS
- High Margins in 3rd Party, Ads and AWS
- Cost cutting and sustainable Free Cash Flow
If one or more of these points isn’t the case, I will critically review my investment in Amazon and might even sell the stock.
Conclusion
Amazon is a very complex company with a lot of different business segments that all bring own challenges and opportunities. The company is currently miss-priced by -6% to 80%, indicating that even in our Bear Case the company isn’t heavily overvalued.
As always the future can’t be predicted and the truth will probably lay somewhere between or we could even get results that aren’t in the said range. For example the lawsuit by the Federal Trade Commission or breaking up the company in its different business segments could impact the companies growth trajectory significantly.
I nevertheless think that the assumptions we took in this analysis are very realistic and could very well materialize just like we predicted. Which is why I currently rate the company as a ‘Strong Buy’ with a short term price target of $180, even tough the company is already up ~75% YTD.
Editor’s Note: This article was submitted as part of Seeking Alpha’s Top 2024 Long/Short Pick investment competition, which runs through December 31. With cash prizes, this competition — open to all contributors — is one you don’t want to miss. If you are interested in becoming a contributor and taking part in the competition, click here to find out more and submit your article today!
Enjoyed this article? Sign up for our newsletter to receive regular insights and stay connected.