
The world could be undergoing a transformation on par with the Industrial Revolution – thanks to a potential surge in investment in artificial intelligence (AI), the low-carbon transition and a rewiring of global supply chains. But the speed, size and impact of that investment is highly uncertain. And it comes against an unusual economic backdrop post-pandemic: sticky inflation, higher interest rates, weaker trend growth and high public debt. We think taking risk by leaning into the transformation and adapting as the outlook changes will be key.
The new regime of greater macro and market volatility has taken hold, shaped by supply constraints like shrinking working-age populations. The result? Higher inflation and interest rates amid weaker growth relative to the pre-pandemic era – and elevated public debt.
But now investment opportunities transcend the macro backdrop. We see waves of transformation on the horizon, driven by five mega forces – or structural shifts. We see three of them spurring major capital spending: the race to build out AI, the low-carbon transition and the rewiring of supply chains. The size, speed and impact of that investment is highly uncertain, but we think it could transform economies and markets like past technological revolutions. Together with BlackRock’s portfolio managers, we designed five starkly different scenarios to assess the near- term outlook, recognizing it could quickly change.
Before the pandemic, low inflation allowed central banks to slash interest rates and make massive asset purchases to buoy the economy. That boosted the financial economy – and helped drive gains across bonds and stocks. In this new regime, the real economy matters more. Our first theme is Getting real. We see the biggest opportunities in the real economy as investment flows into infrastructure, energy systems and technology – and the people driving them.
We think companies may need to revamp business models and invest to stay competitive. For investors, it means company fundamentals will matter even more. The gap between winners and losers could be wider than ever, in our view.
That dispersion creates opportunities and is why our second theme is Leaning into risk. The answer to a highly uncertain outlook is not simply reducing risk. We look for investments that can do well across scenarios and lean into the current most likely one. For us, that’s a concentrated AI scenario where a handful of AI winners can keep driving stocks.
We stand ready to adapt as and when another scenario – potentially suddenly – becomes more likely as the transformation unfolds.
So our third theme is Spotting the next wave. This is about being dynamic and ready to overhaul asset allocations when outcomes – and investment opportunities – can be vastly different.
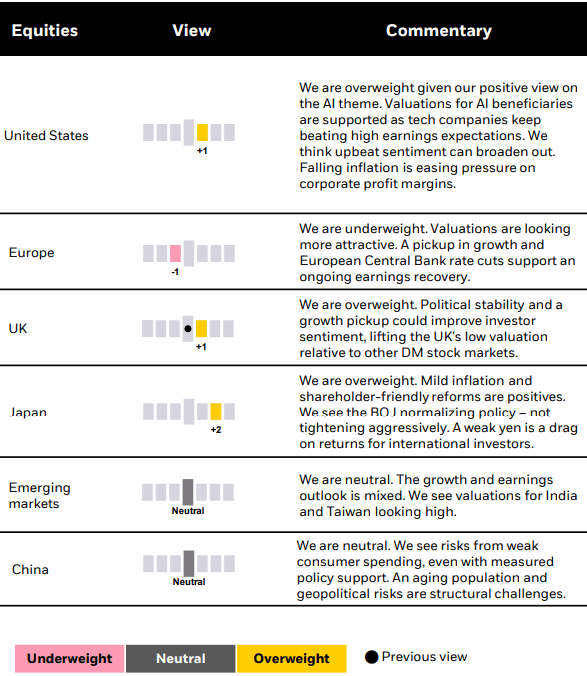
Investment implications: We stay overweight
U.S. stocks and the AI theme on a six- to 12- month view. Our overweight to Japanese stocks is one of our highest-conviction views. We like income in short-term bonds and credit. And we see private markets as a way to tap into the early winners and the infrastructure needed for the investment boom ahead.
Transformation ahead?
We think the world could be undergoing waves of transformation on a scale rarely seen in history.
Mega forces are driving this transformation and are starting to unleash massive investment into the real economy: infrastructure, energy systems, advanced technology – and people. We think the volume of investment could be on a par with past technological revolutions – reshaping markets and economies.
See the chart. Yet, the speed and scale of that investment, and its potential impact on economy-wide productivity, are highly uncertain.
Consider AI. The race to scale up AI capabilities is already spurring major capital spending. A range of estimates see investment in AI data centers rising by 60-100% annually in coming years. Yet, it is difficult to pin down exact amounts, even in the first phase of the AI buildout. It will depend on any resource constraints – like difficulty meeting AI’s energy needs on top of already growing demand, including for electrification. Innovations in computing and energy could ease those constraints.
In a second phase, we think investment will broaden out to firms seeking to harness AI – with the amount depending on AI’s buildout
and adoption. It is possible that this all results in a third phase of broad productivity gains. See pages 8-9.
The low-carbon transition is also spurring major investment. Our BlackRock Investment Institute Transition Scenario estimates energy system investment will hit $3.5 trillion per year this decade. Rising geopolitical fragmentation also implies investment: countries are prioritizing national security over economic efficiency. Reconfiguring supply chains requires investment.
Uncertainty around the speed and scale of coming investment, plus an unusual economic backdrop marked by supply constraints, make it tough to gauge exactly where the world is heading longer term. But we see the transformation evolving through distinct phases, like advances in the AI buildout first and broad adoption later. This progression can help provide direction – enabling us to evolve asset allocations on the way.
Mega capex coming Total cumulative contributions to GDP
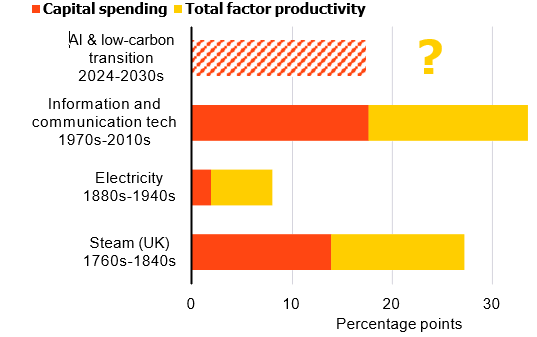
Chart takeaway: AI and the low-carbon transition could spur historically large capital spending – and in a much shorter space of time than previous technological revolutions. Forward looking estimates may not come to pass. Source: BlackRock Investment Institute, June 2024 with data from Crafts (2021). Notes: The chart shows cumulative contribution of previous U.S. technologies (except “steam”) to GDP over the periods indicated. The estimates for information and communication tech, electricity and steam are taken from historic economic literature as in Crafts (2021). The spend needed for artificial intelligence (AI) and the transition is a BII estimate based on external research on data center investment requirements and the BII Transition Scenario (for professional investors here). Other revolutions took place over decades so our estimates for AI and transition-related spend assumes an optimistic case over a short span of time.
We see a possible investment boom ahead that could transform economies and markets. But the speed, scale and impact of that investment is unclear.
Weighing near-term scenarios
We use scenarios to help identify where economies and markets may be headed on a six- to 12-month horizon. They help put parameters around very different states of the world – even if they don’t capture the many potential outcomes beyond that horizon.
We worked with portfolio managers across BlackRock to develop five, distinct scenarios for the near-term outlook. We see two scenarios where equities can do well: one with a concentrated group of winners in AI, even with a tough macro backdrop, and another where AI-driven growth becomes more broad-based, leading to productivity gains and sharp rate cuts. The two hard economic landing scenarios differ on whether central banks can come to the rescue with rate cuts. The fifth is one of subdued growth and stubborn inflation, where inflation proves sticky, keeping central bank policy rates higher. The arrows on the right show how the assumed market impact can diverge sharply across these scenarios.
We lean into the concentrated AI case, reflecting our view that AI valuations are rooted in solid earnings. Yet, we stand ready to pivot – and our approach gives us a roadmap to gauge when another scenario becomes more likely. We think expertise in identifying these scenario shifts could help investors deliver outsized returns.
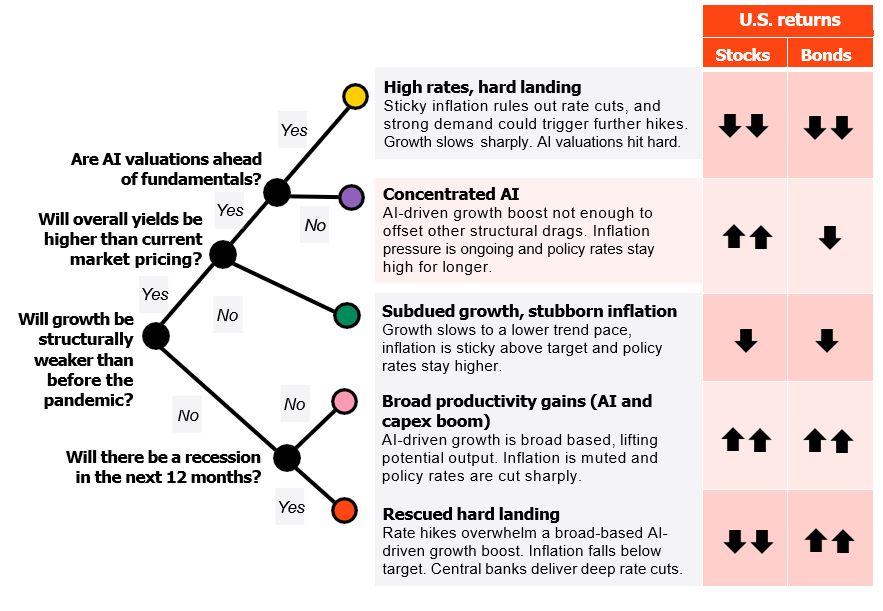
The opinions expressed are subject to change at any time due to changes in market or economic conditions. This material represents an assessment of the market environment at a specific time and is not intended to be a forecast of future events or a guarantee of future results. Sources: BlackRock Investment Institute, July 2024. Notes: Our five scenarios here can be represented as nodes on different pathways. The arrows indicate our expectation for U.S. equity and Treasury returns in each scenario, as two examples. Two arrows represents that a larger relative move is expected in this scenario than a single arrow. We only show U.S. equities and Treasuries but have run this analysis across several asset classes. For illustrative purposes only.
Getting real
We see much of the potential large investment flowing into the pipes and people of the economy. Think new data centers powering AI models, computer chips, solar farms, super batteries, factories, logistics centers – and roads, bridges, schools and hospitals in countries with growing populations. It’s a new wave of investment into the real economy transforming economies and markets. It’s a world where company fundamentals will matter even more, we think.
This is a big change from the pre- 2020 dominance of the financial economy. Steadily expanding global production capacity and growing workforces kept macro volatility at bay: whenever growth faltered, central banks could come to the rescue without fearing an inflation flare-up. This stability reduced uncertainty and allowed central banks to signal their intentions well in advance. Such a favorable backdrop buoyed most companies, leaving little room for differentiation among businesses and stock pickers. We think that era is over.
As the real economy takes over from the financial economy, we think investors should actively position for waves of transformation like we have rarely seen before, we think.
We see widespread opportunities for companies that innovate and position themselves to take advantage of this transformation.
That includes building capabilities to harness AI, for example. Spotting winners will require deep insights on the technology being developed, its applications and the potential disruption it entails.
We are seeing that play out now with companies building strong cash flows from the real economy thanks to their dominant positions. Nvidia’s (NVDA, NVDA:CA) price surge shows how fast winners can emerge – and be rewarded.
Companies who fall behind are likely to struggle in this environment – partly because central banks won’t be able to respond easily with lower rates if growth weakens, in our view. We are not going back to a time of cheap and plentiful capital.
Nvidia and the AI momentYears to go from $10 billion to current market capitalization
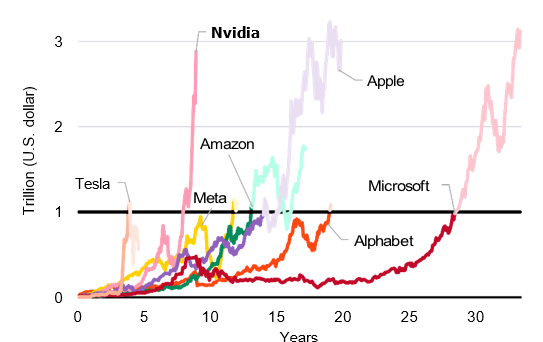
This information is not intended as a recommendation to invest in any particular asset class or strategy or as a promise – or even estimate – of future performance. Past performance is not a reliable indicator of future results. Source: BlackRock Investment Institute, with data from Bloomberg, July 2024. Notes: The chart shows how long it took for the “magnificent seven” stocks to go from $10 billion to its current market capitalization. Chart takeaway: Nvidia’s surge reflects the big investment expectations as a result of the rise of AI.
Investment implications
- We like infrastructure and industrial companies exposed to the investment boom.
- High-for-longer policy rates prompts us to favor quality in both fixed income and equities.
Leaning into risk
The transformation could take any of several very different paths: it could lead to a broad productivity boom or to AI winners becoming overvalued, for example. Investors may feel tempted to sit on the sidelines and await clarity – especially given the attractive returns from holding cash. Yet we see bigger rewards for leaning into risk in this environment. We think markets are likely to keep rewarding perceived AI winners in the next six to 12 months – regardless of where the transformation leads longer term.
We think investors should take risk more deliberately now, across multiple dimensions. First, consider the time horizon. We have most conviction about the near term. We think large technology companies investing heavily in the AI buildout, chip producers and firms supplying key inputs like energy and utilities can keep doing well. That’s why we lean into the concentrated AI scenario. See pages 8-9. Beyond tech, we like sectors such as industrials and materials that are also set to benefit in the near term.
Second, be deliberate in choosing the type of risk exposure. A few winner-takes-all companies have driven U.S. equity gains this year. We don’t see the concentration of equity performance as a problem as mega caps have delivered on earnings. Yet we actively choose to lean more heavily into AI than benchmark index weights. Two big U.S. tech firms each have a market capitalization larger than the entire UK or German benchmark stock indexes. See the chart.
Third, be deliberate about blending different sources of return across public and private markets. We think both active strategies and private markets play a bigger role now – and see private markets as a way to gain access to the early journeys of firms set to win in a potentially rapid transformation. We also see broader opportunities in private markets than public ones. That’s especially true in a world where elevated debt limits the ability of government to invest in infrastructure. Still, private markets are complex and not suitable for all investors.
Companies larger than country stock marketsMarket capitalization of select U.S. companies and stock indexes, 2005-24
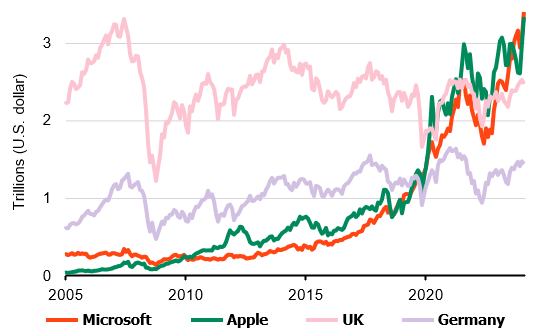
Chart takeaway: Some U.S. company stocks are now larger in value than the entire benchmark index of some nations, showing how they can dominate broad index exposures. This emphasizes why investors must be deliberate with their risk-taking. This information is not intended as a recommendation to invest in any particular asset class or strategy or as a promise – or even estimate – of future performance. It is not possible to invest directly in an index. Index performance does not account for fees. Source: BlackRock Investment Institute, with data from LSEG Datastream, July 2024. Notes: The chart shows the market capitalization of Apple, Microsoft and the UK and German stock markets. Index proxies used for UK and German equity markets: MSCI UK and MSCI Germany
Investment implications
- We lean into an above-benchmark exposure to the AI theme. We also like sectors such as tech, industrials, energy and materials.
- This is an environment that favors private markets and blending sources of returns.
Spotting the next wave
We are in a world where multiple, starkly different – or “polyfurcated” – outcomes are possible. This means we can no longer view the outlook in terms of slight deviations around a central outcome. We need to look at whole new ways of how the waves of transformation could reshape the economy and asset returns ahead.
Distributions are a useful way to think about this. A central base case meant a single distribution was sufficient in the past for describing potential outcomes. We think looking at the world in multiple distributions – with very little overlap between them – is a better way of characterizing the possible scale of the waves of transformation ahead. We show two distinct branches for U.S. GDP with distributions around them to illustrate this. See the chart. Diverging growth pictures are just one example of the very different ways in which the economy could reconfigure. A transformation potentially on a par with past technological revolutions could see entire sectors revamped.
It could mean a world that looks very different from the low growth, low inflation environment that dominated in the decade after the global financial crisis. Such profound changes could make it necessary to rethink what a long- term anchor for asset allocation looks like.
What does this mean in practice? Investors should look for where the next wave of investment opportunity may come – and be ready to overhaul portfolio allocations to capture it. This is not only about the next six months or year, but about recognizing the possibility of very different future states of the world. On the next page we lay out three phases of AI evolution to help track the path of global transformation.
We believe an active approach is key as we face very different states of the world. – Helen Jewell Chief Investment Officer EMEA, Fundamental Equities – BlackRock
Starkly different outcomesStylized view of two different U.S. GDP outcomes
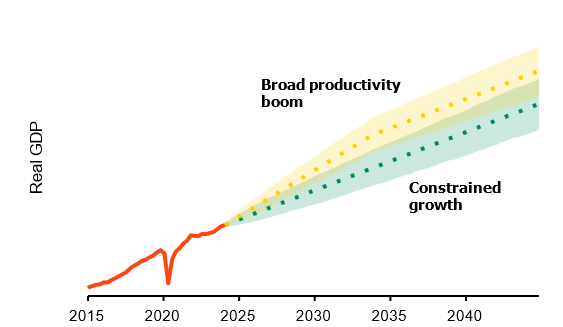
Starkly different outcomes Stylized view of two different U.S. GDP outcomes For illustrative purposes only. Forward looking estimates may not come to pass. Source: BlackRock Investment Institute, July 2024. Notes: The chart shows a stylized view of how U.S. GDP could play out under different scenarios where growth is lower than it was pre-pandemic, constrained by workforce aging, and another where growth is boosted over the next decade by an AI-driven productivity boom, before falling below pre- pandemic growth rates. We show one standard deviation bands around those stylized outcomes
Investment implications
- A wide range of outcomes means standing ready to overhaul portfolio allocations to capture opportunities from profound changes.
- Investors may need to rethink what a long- term anchor for asset allocation looks like.
AI’s rapid buildout now…
The AI juggernaut – still largely a U.S. story – has powered the S&P 500 (SPX) this year. We think AI is central to the transformation – and could make up a large part of the coming investment wave. We believe AI can keep driving returns across most outcomes. We don’t see a tech bubble: earnings and fundamentals support current valuations. Case in point: Nvidia’s forward earnings have kept pace with its rocketing share price so far. We think an understanding of how AI could evolve from here is key. We see three distinct phases.
1) AI buildout
AI relies on vast computing power, so some large technology firms are racing to invest in data centers to secure that power. We’re at the
start of this phase. Early winners
are already emerging, including those tech firms, chip producers and firms supplying key inputs like energy, utilities, materials and real estate. Yet the buildout faces challenges, notably whether the power grid can grow fast enough.
AI’s power needs are expected to grow in coming years, even with further energy efficiency. See the chart. Policy and regulation could put the brakes on buildout, too. For example, policymakers may step in if data center growth pushes up local energy prices. And rules on the use of AI could impact adoption. Supply bottlenecks could also slow progress as demand grows for metals and minerals like copper, aluminum and lithium – already in high demand as inputs for the low-carbon transition.
2) AI investment broadens
Here we see investment broadening to firms looking to harness AI. We see some of that already, especially in healthcare. It and other sectors like financials and communication services could benefit, potentially lifting economic growth. Yet both phases 1 and 2 could be inflationary: building AI and retooling creates extra demand before any supply- side or productivity benefits arise.
We don’t think markets or central banks appreciate that yet.
Massive energy and investment needsData center power demand as a share of total U.S. demand, 2022-2030
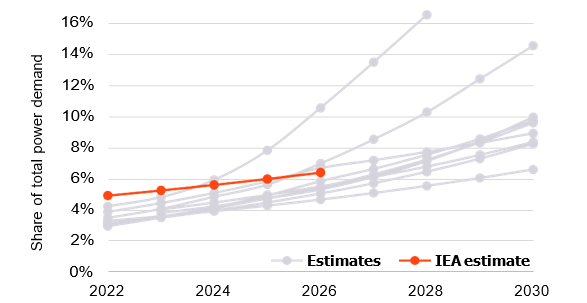
Chart takeaway: The power needs for data centers that feed AI applications like large language models are set to grow – but the pace is uncertain. Meeting those needs could require massive investment in power grids and renewable energy. Forward looking estimates may not come to pass. Source: BlackRock Investment Institute, International Energy Agency (IEA), Goldman Sachs, BGIF, Bank of America, Schneider, Semianalytics, Bernstein, McKinsey, Boston Consulting Group, and BlackRock’s Fundamental Equities team, May 2024. Notes: The chart shows data center power demand as a share of total U.S. power demand in 2022. Data center power demand includes those from traditional data centers and artificial intelligence (AI) computing/dedicated AI data centers and excludes consumption from crypto currencies and data transmission networks.
Investment implications
- AI’s buildout could initially be inflationary as
demand for energy and commodities surges.
- Early winners could include large tech firms, chip makers and energy and utility firms – before benefits expand to other sectors.
…could boost productivity later
3) Productivity boom
In this very uncertain phase, AI could enable economies to produce more with the same amount of capital, labor – and energy as AI-enabled innovation potentially balances out AI’s power needs. Technological innovations have done that before. The chart shows broad computer adoption drove up average output per hour by over 1 percentage point for nearly a decade. AI could eventually help economies grow faster and ease inflation pressure, in our view.
The size and spread of productivity gains from AI are uncertain. Capital could be misallocated in the AI race. Estimates of AI’s boost to annual U.S. growth range from 0.1 to 1.5 percentage points. We find the lower end more realistic – it will depend on sector adoption and cost savings. Yet these gains can only come after AI capabilities are fully deployed. That could take years, followed by the typical lag. It took nearly a century for the steam engine to boost productivity.
And it was decades before the 1970- 80s computer and tech revolution paid off. It’s not impossible this phase starts within a year, but we think several years is more likely. The potential winners in this phase are less clear-cut than in the earlier phases. It could be just a subset of companies that own the key tech. Or certain parts of society: For example, if AI enhances worker productivity, wages could rise – with benefits felt widely across the economy. In all events, AI is likely to spur a broad reallocation of workers across sectors. Even with this uncertainty, the potential for big future rewards supports the case for investing now and our AI overweight.
AI could eventually deliver broad productivity gains – yet the path is uncertain. – Simona Paravani-Mellinghoff, Co-Head of Multi-Asset Strategies & Solutions – BlackRock
Reward comes with a lagU.S. IT investment rate and productivity growth, 1970-2024
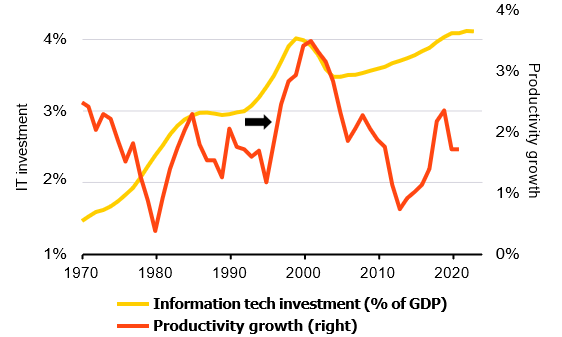
Chart takeaway: Rising investment in information tech during the 1970s and beyond delivered meaningful productivity gains in the U.S. – but only with a lag. Source: BlackRock Investment Institute, U.S. Bureau of Economic Analysis with data from Haver Analytics, July 2024. Notes: The chart shows U.S. historic productivity growth and the rate of investment in information tech processing equipment and software as a share of nominal GDP.
Investment implications
- The third phase is deeply uncertain, yet any AI- led productivity gains could be deflationary and enhance growth.
- Potential for big future rewards underpins the importance of investing now.
Elections spur granularity
As countries representing over half of the global population go to the polls this year, voters are focused on economic issues including the surge in the cost of living. Yet record or elevated government debt levels limit leaders’ ability to address these concerns. See the chart.
Neither candidate or major party in the U.S. presidential election has made debt and deficits a key campaign issue – or shied away from advocating more sizable spending. These ongoing budget deficits reinforce persistent inflation pressures and our view the Federal Reserve will keep rates higher for longer. That’s why we see investors demanding more compensation for the risk of holding long-term U.S. bonds – and favor shorter-term bonds.
We think France’s unprecedented political stalemate after its parliamentary election and weak fiscal outlook will draw greater investor scrutiny. This contrasts with perceived policy stability in the UK after its election.
Global elections add to the geopolitical volatility we see. This is a challenging time for incumbents. We see a structural shift toward geopolitical fragmentation, exacerbated by ongoing competition with China and protectionist measures in areas like advanced technology and electric vehicles – both in the U.S. and EU.
Global supply chains are rewiring in response – and that will involve new infrastructure needs. See the next page. Countries like India and Mexico stand to benefit over the long term as intermediate trade partners between economic and geopolitical blocs. That’s one reason we get granular with our country preferences.
Globalization has proved resilient – but it is also more expensive. – Tom Donilon Chairman, BlackRock Investment Institute
Persistently large Government debt-to-GDP ratios, 1940-2024
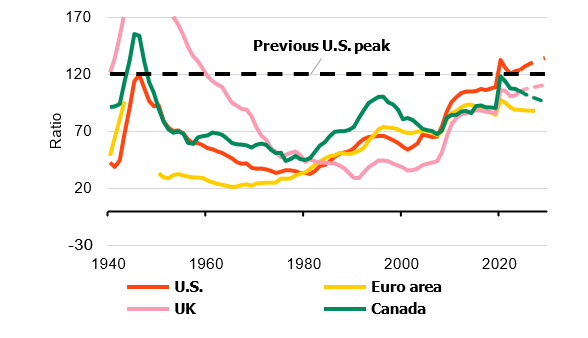
Chart takeaway: We think large deficits reinforce persistent inflation and higher-for-longer interest rates. Debt levels for some countries are near or beyond World War Two peaks.Forward looking estimates may not come to pass. Source: BlackRock Investment Institute, International Monetary Fund and Macrohistory (Jorda et al., 2017), with data from Haver Analytics, June 2024. Notes: The chart shows the historic and estimated level of government debt as a share of GDP. Forward looking estimates may not come to pass. Source: BlackRock Investment Institute, International Monetary Fund and Macrohistory (Jorda et al., 2017), with data from Haver Analytics, June 2024. Notes: The chart shows the historic and estimated level of government debt as a share of GDP
Investment implications
- We turn overweight UK stocks. The potential for relative political stability and attractive valuations may pull in foreign investors.
- We like inflation-linked bonds on a strategic horizon, partly due to elevated debt levels.
Infrastructure opportunities
Infrastructure is at the intersection of the mega forces driving the waves of transformation. AI is a key aspect of economic competition among countries, while the investment in data centers is starting to impact the low-carbon transition as well. Net-zero emissions targets of the companies investing the most in the AI buildout could drive up demand for renewable energy.
AI’s energy needs could magnify the already massive investment expected, as noted earlier.
Infrastructure investment is key to funding the low-carbon transition: By the 2040s, we estimate that low-carbon investment will account for up to 80% of energy spending, up from 64% now.
We see geopolitical fragmentation reinforcing energy pragmatism as countries seek to balance the transition with energy security and affordability. The rewiring of supply chains is driving infrastructure demand globally and we favor the emerging markets set to benefit.
Across markets, demographic divergence is shaping investment needs. Typically, the faster a population grows, the faster capital investment grows to support growing populations. See the chart. And developed markets will need to invest to adapt to aging populations. See the next page.
A huge gap exists between the total amount of infrastructure investment needed globally and the amount governments can spend given high debt levels in many countries. We see private markets bridging the gap – though private markets are complex and not suitable for all investors.
We are seeing the AI buildout boost demand for renewable energy. -David Giordano, Global Head of Climate Infrastructure – BlackRock
Investment-demographic linkG20 population and investment growth, 2000-2019
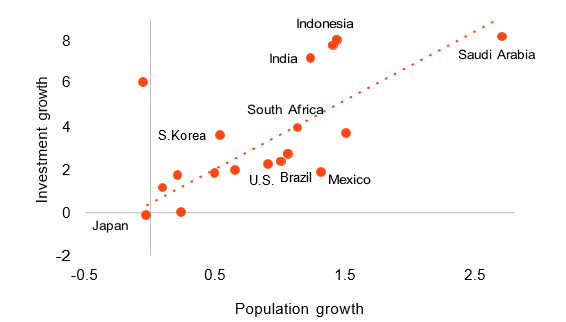
Chart takeaway: The faster a population grows, the faster capital investment grows, we find. Opportunities arise where investment has not kept up with that growth. Source: BlackRock Investment Institute, World Bank Development Indicators, UN, with data from Haver, March 2024. Note: The chart shows the relationship between average population growth and average real investment growth, as measured by the gross fixed capital formation component of GDP, between 2000 and 2019. The chart includes data up to 2019 to avoid the pandemic’s distortion of the data
Investment implications
- We see private markets filling the gap between infrastructure investment needs and what governments can spend.
- We prefer infrastructure equity to other private growth assets on a strategic horizon.
Demographics matter now
Demographic trends tend to be seen as long term in nature and not impacting returns now. We disagree. Rising life expectancy and falling birth rates mean the working-age population – usually defined as 15-64 years old – is shrinking in many developed markets and China. That means those economies will not be able to produce as much and grow as quickly as in the past.
These developments impact labor markets and sector-level demand now. Aging could be inflationary: retirees stop producing economic output but don’t typically spend less. Governments are likely to spend more on healthcare. We think that’s another reason why central banks will likely have to keep policy rates higher.
Governments can respond by trying to boost the workforce and/or productivity by investing in automation and AI. These strategies can provide some offset, but it’s unlikely to be enough. We see opportunities in countries that better adapt to aging.
By contrast, working-age populations in many EMs are still growing. We see opportunities in those that best capitalize on their demographic advantage, such as by improving workforce participation and investing in infrastructure. Countries with higher investment demand – India, Mexico and Saudi Arabia – may offer higher returns.
Across countries, we think investors need to assess what markets have priced in. Research finds markets can be slow to price in the impact of even predictable demographic shifts. See the chart. That looks to be the case in the U.S. and Europe, like Japan before – and is why we favor the healthcare sector in both.
Aging populations underpin our favorable outlook for the healthcare sector. – Carrie King, Chief Investment Officer of U.S. and Developed Markets, Fundamental Equities – BlackRock
Slow to price in agingJapan healthcare outperformance vs. dependency ratio, 1970-2024
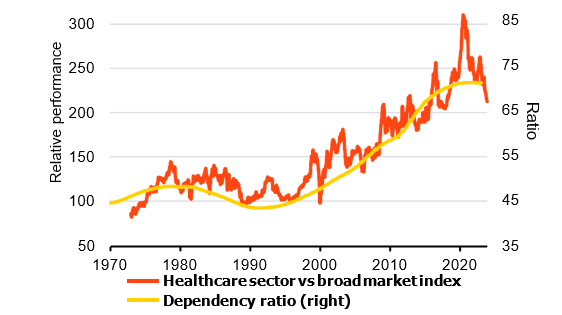
Past performance is not a reliable indicator of current or future results. Indexes are unmanaged and do not account for fees. It is not possible to invest directly in an index. Source: BlackRock Investment Institute, United Nations, Reuters, with data from LSEG Datastream, March 2024. Notes: The orange line shows the ratio of the performance of Japan’s healthcare equity sector vs. the overall market index, indexed to 1990. We use total market indices constructed by Datastream.Chart takeaway: The growth of retirees in Japan was well documented years in advance. Yet Japan’s healthcare stocks have only risen in value – relative to the broader market – as that growth in retiree population actually materialized.
Investment implications
- Different demand patterns in aging populations create opportunities in sectors like healthcare.
- We favor countries like India and Saudi Arabia benefitting from younger populations and infrastructure investment.
Why we like Japan
Japan is at the forefront of major economies grappling with an aging population. Yet its economic revival – and return of long-missing inflation – makes its equity market one of our strongest convictions on both on tactical and strategic horizons.
In the near term, a benign macro backdrop and brightening corporate fundamentals – including ongoing reforms to improve profitability – prompted us to go further overweight Japanese equities. At the same time, the
Bank of Japan is being patient in normalizing policy after raising policy rates for the first time in nearly two decades. Japan’s stable macro outlook – with mild inflation feeding higher wages and corporate pricing power – has also reinforced our upbeat outlook for equity returns on strategic horizons of five years or longer. In our view, that means Japanese stocks warrant a higher allocation on such horizons of five years or longer than the benchmark would suggest.
We hold an above-benchmark allocation, or overweight, to Japanese equities in our strategic views – with a preference for an unhedged exposure vs. currency hedged. See the chart on the right. We see a medium-term improvement in corporate earnings as the return of inflation and worker wage gains gives companies greater pricing power. We are watching for signs of a structural inflows into local stocks from households after an overhaul to the country’s tax- exempt investment vehicles.
Finally, we see mega forces creating compelling sectoral opportunities in Japan – such as in healthcare – and favoring a more active approach.
Japan’s economic revival has strong roots, creating long-term opportunities. – Yuichi Chiguchi, Japan Chief Investment Strategist and Head of Japan Multi-Asset Strategies & Solutions – BlackRock
Japan for the long termHypothetical strategic allocation to Japan equities
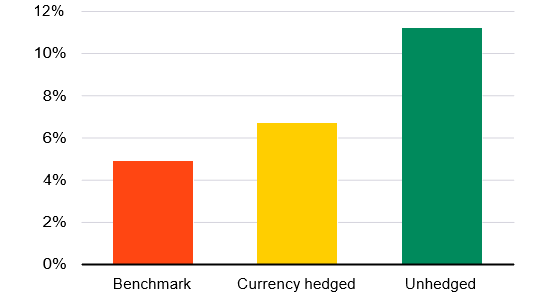
Chart takeaway: We favor an above-benchmark allocation to Japanese equities in long-term portfolios as a benign macro backdrop brightens the outlook for corporate profits.This information is not intended as a recommendation to invest in any particular asset class or strategy or as a promise – or even estimate – of future performance. Source: BlackRock Investment Institute, June 2024. Notes: The chart shows our hypothetical allocation to Japanese equities as a percentage of the overall equity in a strategic portfolio with a long-term investment horizon of 10 years relative to their weights in respective benchmarks, on both a currency hedged and unhedged basis. We use the MSCI ACWI for equities. Indices are unmanaged. It is not possible to invest directly in an index
Investment implications
- We like Japanese stocks on both tactical and strategic horizons, one of our highest- conviction views.
- We think sectors like healthcare can benefit from aging populations.
Ready to adapt
Our scenarios framework helps ground our views on a tactical horizon. Yet we could change our stance quickly if a different scenario were to look more likely. This is one reason why we may need to think about strategic asset allocation differently in the future – building on our long-held view that strategic views should be dynamic in this new environment. It is no longer possible to base strategic views on just one central view of the future state of the world with some deviation around it, in our view.
We have seen the AI theme drive broader equity returns in the first half of the year – and we stick with our overweight. Beyond the U.S., we like emerging market countries like India and Saudi Arabia that are positioned to benefit from mega forces. We like Japanese stocks across horizons – and recommend strategic allocations larger than what index benchmarks would suggest.
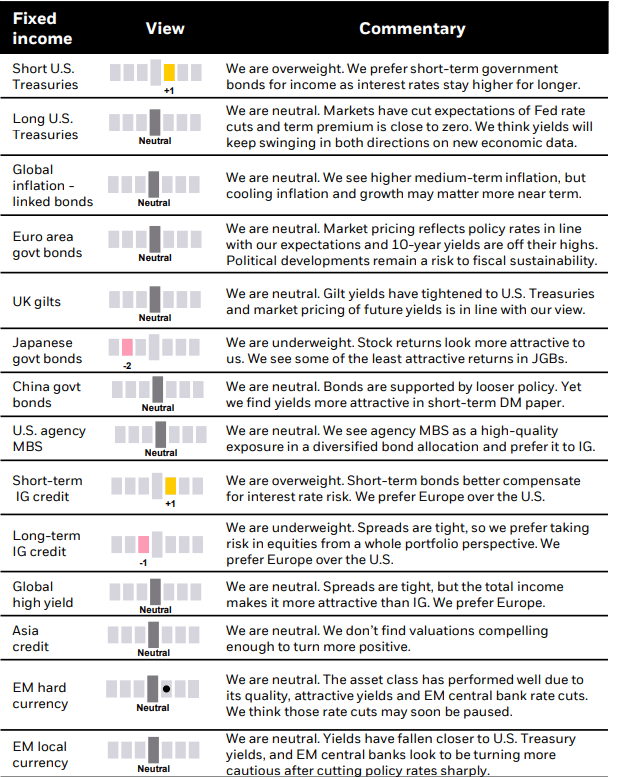
We also still like earning quality income in short-term government bonds and credit on both tactical and strategic horizons. Sticky inflation makes us prefer inflation-linked over nominal long-term bonds on a strategic horizon.
We stick to our long-term preference for private credit even as spreads have tightened and we make cautious default assumptions. Why? We see private credit stepping up to play a bigger role in lending.
Big callsOur highest conviction views on tactical (6-12 month) and strategic (long-term) horizons, July 2024
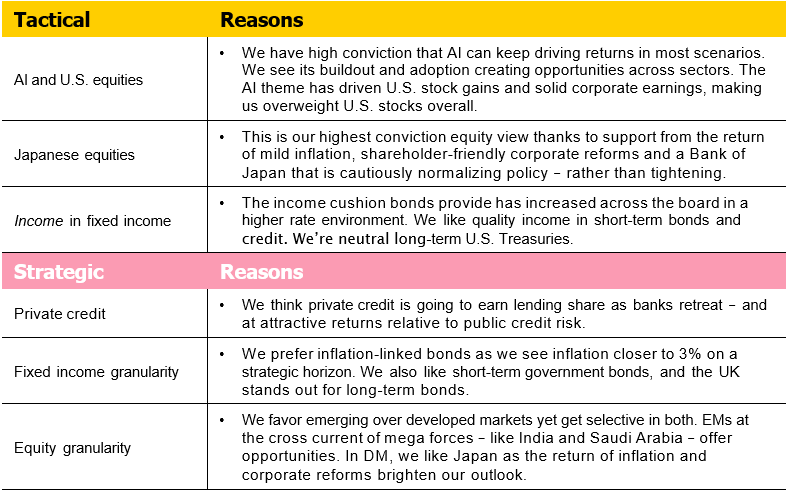
Note: Views are from a U.S. dollar perspective, July 2024. This material represents an assessment of the market environment at a specific time and is not intended to be a forecast of future events or a guarantee of future results. This information should not be relied upon by the reader as research or investment advice regarding any particular funds, strategy or security
Tactical granular views
Six- to 12-month tactical views on selected assets vs. broad global asset classes by level of conviction, July 2024
Our approach is to first determine asset allocations based on our macro outlook – and what’s in the price. The table below reflects this and, importantly, leaves aside the opportunity for alpha, or the potential to generate above-benchmark returns. We don’t think this environment is conducive to static exposures to broad asset classes but creates more space for alpha.
Past performance is not a reliable indicator of current or future results. It is not possible to invest directly in an index. The statements on alpha do not consider fees. Note: Views are from a U.S. dollar perspective. This material represents an assessment of the market environment at a specific time and is not intended to be a forecast or guarantee of future results. This information should not be relied upon as investment advice regarding any particular fund, strategy or security.
Past performance is not a reliable indicator of current or future results. It is not possible to invest directly in an index. The statements on alpha do not consider fees. Note: Views are from a U.S. dollar perspective. This material represents an assessment of the market environment at a specific time and is not intended to be a forecast or guarantee of future results. This information should not be relied upon as investment advice regarding any particular fund, strategy or security.
BlackRockInvestmentInstitute
The BlackRock Investment Institute (BII) leverages the firm’s expertise and generates proprietary research to provide insights on macroeconomics, sustainable investing, geopolitics and portfolio construction to help Blackrock’s portfolio managers and clients navigate financial markets. BII offers strategic and tactical market views, publications and digital tools that are underpinned by proprietary research.
General disclosure: This material is intended for information purposes only, and does not constitute investment advice, a recommendation or an offer or solicitation to purchase or sell any securities to any person in any jurisdiction in which an offer, solicitation, purchase or sale would be unlawful under the securities laws of such jurisdiction. The opinions expressed are as of July 2024, and are subject to change without notice. Reliance upon information in this material is at the sole discretion of the reader. Investing involves risks. This information is not intended to be complete or exhaustive and no representations or warranties, either express or implied, are made regarding the accuracy or completeness of the information contained herein. This material may contain estimates and forward-looking statements, which may include forecasts and do not represent a guarantee of future performance.
In the U.S. and Canada, this material is intended for public distribution. In EMEA, in the UK and Non-European Economic Area (EEA) countries: this is Issued by BlackRock Investment Management (UK) Limited, authorised and regulated by the Financial Conduct Authority. Registered office: 12 Throgmorton Avenue, London, EC2N 2DL. Tel: + 44 (0)20 7743 3000. Registered in England and Wales No. 02020394.
For your protection telephone calls are usually recorded. Please refer to the Financial Conduct Authority website for a list of authorised activities conducted by BlackRock. In the European Economic Area (EEA): this is Issued by BlackRock (Netherlands) B.V. is authorised and regulated by the Netherlands Authority for the Financial Markets. Registered office Amstelplein 1, 1096 HA, Amsterdam, Tel: 020 – 549 5200, Tel: 31-20-549-5200. Trade Register No. 17068311 For your protection telephone calls are usually recorded. In Italy, for information on investor rights and how to raise complaints please go to https://www.blackrock.com/corporate/compliance/investor-right available in Italian.
In Switzerland, for qualified investors in Switzerland: This document is marketing material. Until 31 December 2021, this document shall be exclusively made available to, and directed at, qualified investors as defined in the Swiss Collective Investment Schemes Act of 23 June 2006 (“CISA”), as amended. From 1 January 2022, this document shall be exclusively made available to, and directed at, qualified investors as defined in Article 10 (3) of the CISA of 23 June 2006, as amended, at the exclusion of qualified investors with an opting-out pursuant to Art. 5 (1) of the Swiss Federal Act on Financial Services (“FinSA”). For information on art. 8 / 9 Financial Services Act (FinSA) and on your client segmentation under art. 4 FinSA, please see the following website: Aladdin – Sign In
For investors in Israel: BlackRock Investment Management ((UK) Limited is not licensed under Israel’s Regulation of Investment Advice, Investment Marketing and Portfolio Management Law, 5755-1995 (the “Advice Law”), nor does it carry insurance thereunder. In South Africa, please be advised that BlackRock Investment Management (UK) Limited is an authorized financial services provider with the South African Financial Services Board, FSP No. 43288.
In the DIFC, this material can be distributed in and from the Dubai International Financial Centre (DIFC) by BlackRock Advisors (UK) Limited – Dubai Branch which is regulated by the Dubai Financial Services Authority (DFSA). This material is only directed at ‘Professional Clients’ and no other person should rely upon the information contained within it. Blackrock Advisors (UK) Limited – Dubai Branch is a DIFC Foreign Recognised Company registered with the DIFC Registrar of Companies (DIFC Registered Number 546), with its office at Unit 06/07, Level 1, Al Fattan Currency House, DIFC, PO Box 506661, Dubai, UAE, and is regulated by the DFSA to engage in the regulated activities of ‘Advising on Financial Products’ and ‘Arranging Deals in Investments’ in or from the DIFC, both of which are limited to units in a collective investment fund (DFSA Reference Number F000738).
In the Kingdom of Saudi Arabia, issued in the Kingdom of Saudi Arabia (KSA) by BlackRock Saudi Arabia (BSA), authorised and regulated by the Capital Market Authority (CMA), License No. 18-192-30. Registered under the laws of KSA. Registered office: 7976 Salim Ibn Abi Bakr Shaikan St, 2223 West Umm Al Hamam District Riyadh, 12329 Riyadh, Kingdom of Saudi Arabia, Tel: +966 11 838 3600. CR No, 1010479419. The information contained within is intended strictly for Sophisticated Investors as defined in the CMA Implementing Regulations. Neither the CMA or any other authority or regulator located in KSA has approved this information.
In the United Arab Emirates this material is only intended for -natural Qualified Investor as defined by the Securities and Commodities Authority (SCA) Chairman Decision No. 3/R.M. of 2017 concerning Promoting and Introducing Regulations. Neither the DFSA or any other authority or regulator located in the GCC or MENA region has approved this information. In the State of Kuwait, those who meet the description of a Professional Client as defined under the Kuwait Capital Markets Law and its Executive Bylaws. In the Sultanate of Oman, to sophisticated institutions who have experience in investing in local and international securities, are financially solvent and have knowledge of the risks associated with investing in securities. In Qatar, for distribution with pre-selected institutional investors or high net worth investors. In the Kingdom of Bahrain, to Central Bank of Bahrain (CBB) Category 1 or Category 2 licensed investment firms, CBB licensed banks or those who would meet the description of an Expert Investor or Accredited Investors as defined in the CBB Rulebook. The information contained in this document, does not constitute and should not be construed as an offer of, invitation, inducement or proposal to make an offer for, recommendation to apply for or an opinion or guidance on a financial product, service and/or strategy.
In Singapore, this is issued by BlackRock (Singapore) Limited (Co. registration no. 200010143N). This advertisement or publication has not been reviewed by the Monetary Authority of Singapore. In Hong Kong, this material is issued by BlackRock Asset Management North Asia Limited and has not been reviewed by the Securities and Futures Commission of Hong Kong. In South Korea, this material is for distribution to the Qualified Professional Investors (as defined in the Financial Investment Services and Capital Market Act and its sub- regulations). In Taiwan, independently operated by BlackRock Investment Management (Taiwan) Limited. Address: 28F., No. 100, Songren Rd., Xinyi Dist., Taipei City 110, Taiwan. Tel: (02)23261600. In Japan, this is issued by BlackRock Japan. Co., Ltd. (Financial Instruments Business Operator: The Kanto Regional Financial Bureau. License No375, Association Memberships: Japan Investment Advisers Association, the Investment Trusts Association, Japan, Japan Securities Dealers Association, Type II Financial Instruments Firms Association.) For Professional Investors only (Professional Investor is defined in Financial Instruments and Exchange Act). In Australia, issued by BlackRock Investment Management (Australia) Limited ABN 13 006 165 975 AFSL 230 523 (BIMAL).
The material provides general information only and does not take into account your individual objectives, financial situation, needs or circumstances. In New Zealand, issued by BlackRock Investment Management (Australia) Limited ABN 13 006 165 975, AFSL 230 523 (BIMAL) for the exclusive use of the recipient, who warrants by receipt of this material that they are a wholesale client as defined under the New Zealand Financial Advisers Act 2008. In China, this material may not be distributed to individuals resident in the People’s Republic of China (“PRC”, for such purposes, not applicable to Hong Kong, Macau and Taiwan) or entities registered in the PRC unless such parties have received all the required PRC government approvals to participate in any investment or receive any investment advisory or investment management services. For Other APAC Countries, this material is issued for Institutional Investors only (or professional/sophisticated /qualified investors, as such term may apply in local jurisdictions). In Latin America, no securities regulator within Latin America has confirmed the accuracy of any information contained herein. The provision of investment management and investment advisory services is a regulated activity in Mexico thus is subject to strict rules. For more information on the Investment Advisory Services offered by BlackRock Mexico please refer to the Investment Services Guide available at Gestión de inversiones y servicios financieros | BlackRock
©2024 BlackRock, Inc. All Rights Reserved. BLACKROCK is a trademark of BlackRock, Inc., or its subsidiaries in the United States and elsewhere. All other trademarks are those of their respective owners.
This post originally appeared on the iShares Market Insights.
Enjoyed this article? Sign up for our newsletter to receive regular insights and stay connected.