
SP500 and its warning signs
These days, with stock indices (such as the DJI, SP500, NASDAQ, and RTY) all hovering around record highs across the board, it has almost become a daily routine for me to see at least 1 “warning sign” pushed to my email box. Some recent examples include the high P/E ratios, high Buffett index, high rule of 20 scores, the AI bubble, and also the high concentration in mega-cap stocks (with the MAG 7 stocks being the most notable examples).
With this background, the goal of this article is to explain why this wisdom, much of which is the result of historical statistics, can be outdated and very misleading. Making investment decisions based on them is essentially like fighting the last war. The article will become quite lengthy if I cover all these warnings and explain why their applicability is questionable under today’s market conditions. Plus, I’ve written recently to share my thoughts on some of them already. For example, you can see a recent article titled “S&P 500: Rule Of 20 Likely To Remain Misleading In 2026” with my detailed thoughts on the SP500’s rule of 20 score. Hence, this article will concentrate on the SP500’s (and other indices too, such as the Nasdaq or RTY) high concentration in mega-cap stocks. Discussion of this issue will also involve my thoughts on some related issues, such as the SP500’s valuation and the AI bubble. So hopefully, I will end up with a good balance between depth and breadth.
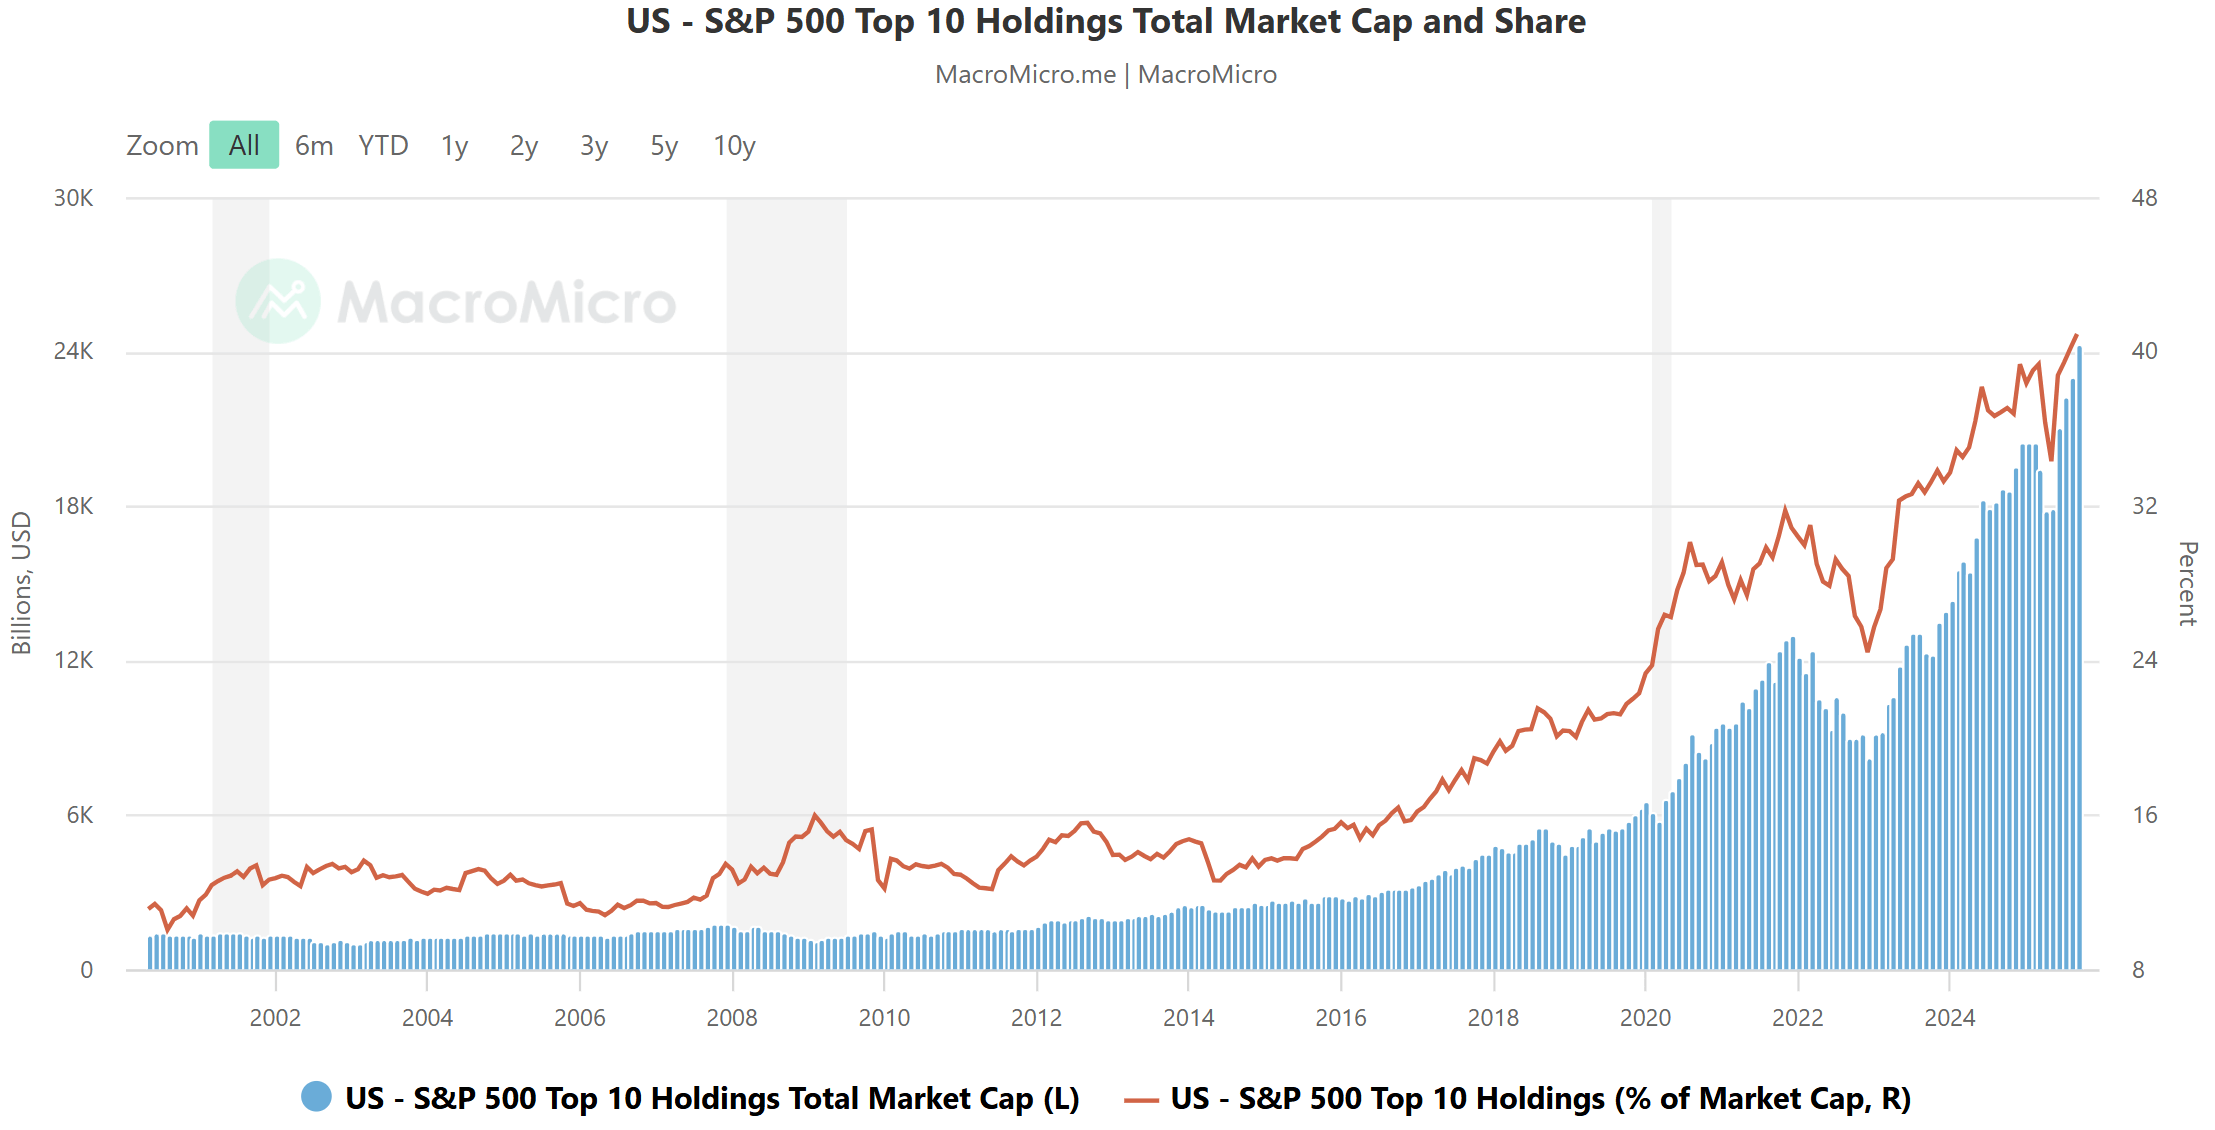
A particular reason I picked this issue as an entry point to this analysis is that the evidence seemed almost self-evident and irrefutable. As a simple example, the chart below displays the total MC (market cap) and also their weight in the S&P 500 index since the 2000s. As seen, their weight (shown by the red line) has dramatically increased since around 2015. Before that, their collective weight stayed below 16%. But after that, their weight has been on an overall upward trend—a quite sharp one, I might add – and has reached around 40% at present. It of course can make investors feel uncomfortable to come to the recognition that 10 companies demand about 40% of the largest 500 companies in the country. The fact that 9 out of these 10 companies (the only exception is Berkshire Hathaway, BRK) all have common and substantial exposure to the AI industry only adds to the concern.
Next, I will provide my perspective to explain why such seemingly self-evident and irrefutable data are actually refutable.
MacroMicro
SP500 profitability without the mega 7
With the equity market’s concentration in a few mega-caps, all with AI exposure, bears love to compare the current market conditions to the 2000s’ dot-com bubble. However, I think these comparisons (at least, the ones I’ve read) missed some of the most fundamental differences.
To start, today’s mega-caps enjoy far better profitability metrics than those during the dot-com bubble. The real danger in investing is not to bid up the price of businesses of good quality but to bid up the prices of businesses with weak profits or even no profits—which was what happened during the dot-com bubble. Today’s mega-caps not only enjoy far superior profitability metrics, far better scalability, and global market reach than the broader market average. Yet, their valuations are not necessarily more expensive than the overall market.
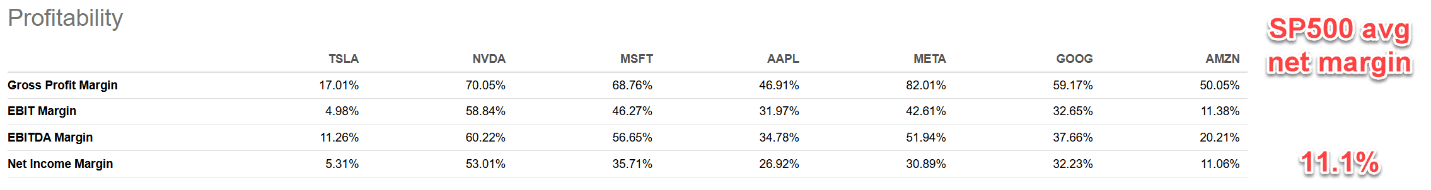
As an example, the chart below compares the profitability metrics of the Magnificent Seven stocks (Mag 7) to the SP500 index. As seen, these stocks generally exhibit far superior profit margins compared to the S&P 500’s average net margin of 11.1%, with the exception of TSLA and AMZN. NVIDIA (NVDA), the stock with the largest MC in the index, stands out with the highest margins across the board, including a dominant 70%+ Gross Profit Margin and a remarkable 53%+ Net Income Margin, almost five-fold of the SP500 average. Other companies in this group (such as META, GOOG, APPL, MSFT, etc.) all boast strong net margins, on average threefold better than the SP500 average. Even the lower margins of Tesla (TSLA) at 5.31% and Amazon (AMZN) at 11.06% are a reflection of their unique business models in my view, not their earnings capabilities.
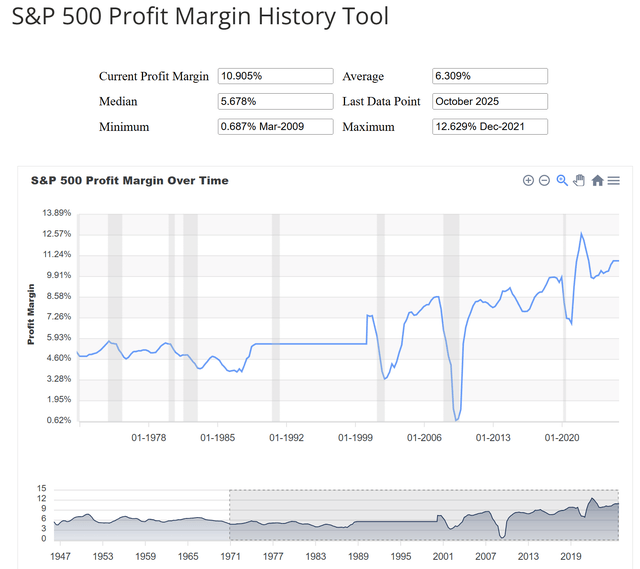
And to put an even broader context to this discussion, the current profitability of the SP500 itself is far better than that during the 2000s—actually far better than any time since the 1970s, according to the statistics shown in the next chart, as seen.
Seeking Alpha
SP500 profit margin
SP500 valuation without the mega-caps
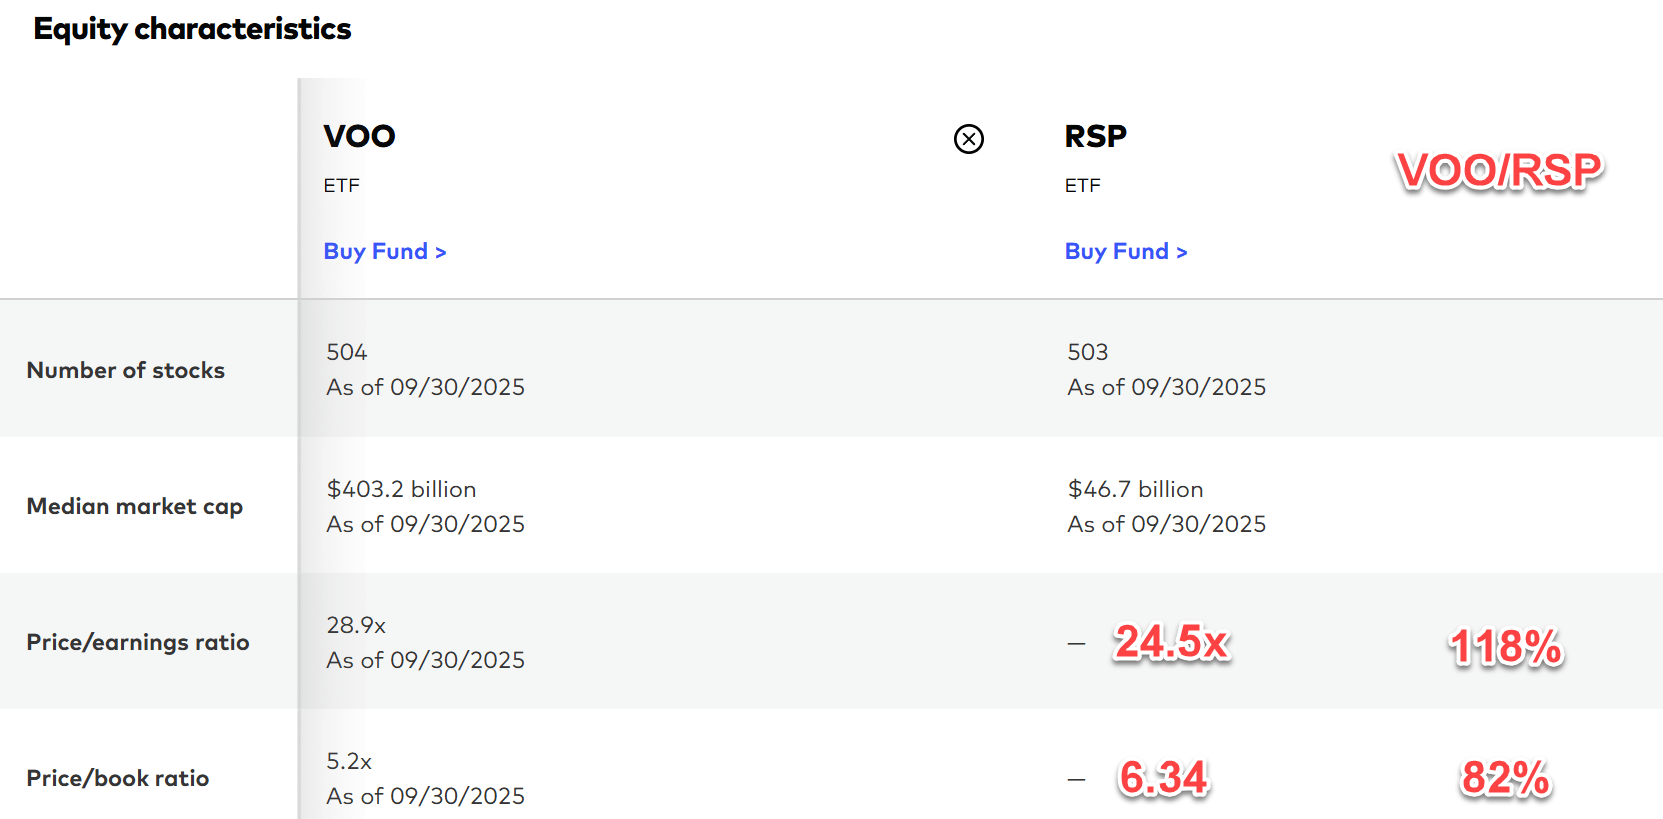
Despite the SP500’s continuously improving profitability and the mega-cap’s even better margins, the mega-caps and overachievers are not necessarily pricier than the overall market. To illustrate this point, the table below compares a popular (and also the largest) market-weighted S&P 500 ETF fund, VOO, to an equal-weighted S&P 500 ETF fund (RSP).
Due to RSP’s equal weight indexing method, the weight of each constituent stock is on average 0.2% (roughly 1/500). Thus, the total weight of the top 10 mega-caps will be around 2% only. As a result, RSP can provide good insights into the valuation differences between the rest of the SP500 and the top mega-cap stocks.
At a global level, VOO’s P/E currently stands around 28.9x. It is indeed higher than RSP’s 24.5x, but the P/E premium is quite mild in my view at 18% when contextualized by the vastly better profitability metrics of the mega-caps as just mentioned. Furthermore, other valuation metrics (such as P/B ratio) even show that VOO is priced at a discount relative to the equal-weighted RSP (5.2x vs. 6.34x). At a tree’s levels, as shown in the second chart below, the mega 7 stocks’ average P/E ratio is not that alarming at all compared to the SP500. If we exclude TSLA, the rest of the mega 7 now trades at a median P/E of around ~31x, not that different from the ~29x P/E of VOO despite their far better profit margins and also growth potential.
Vanguard
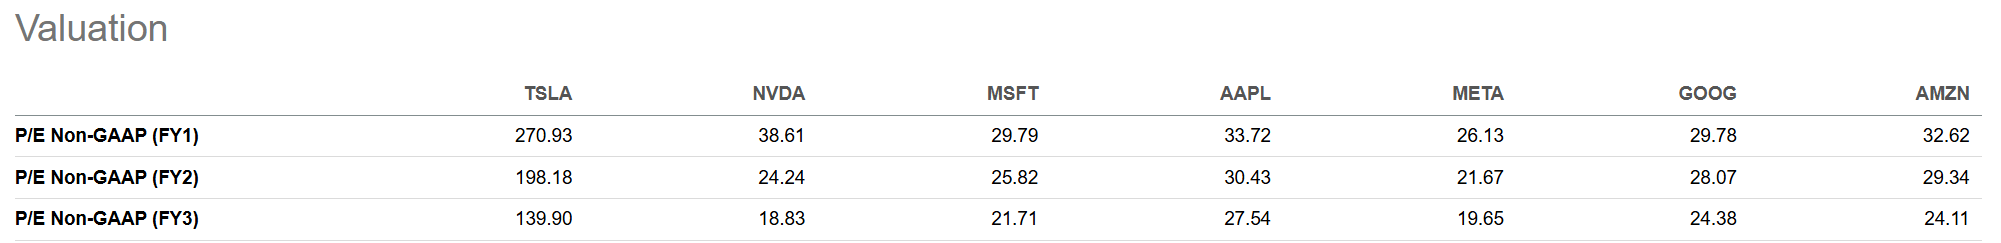
Seeking Alpha
Other risks and final thoughts
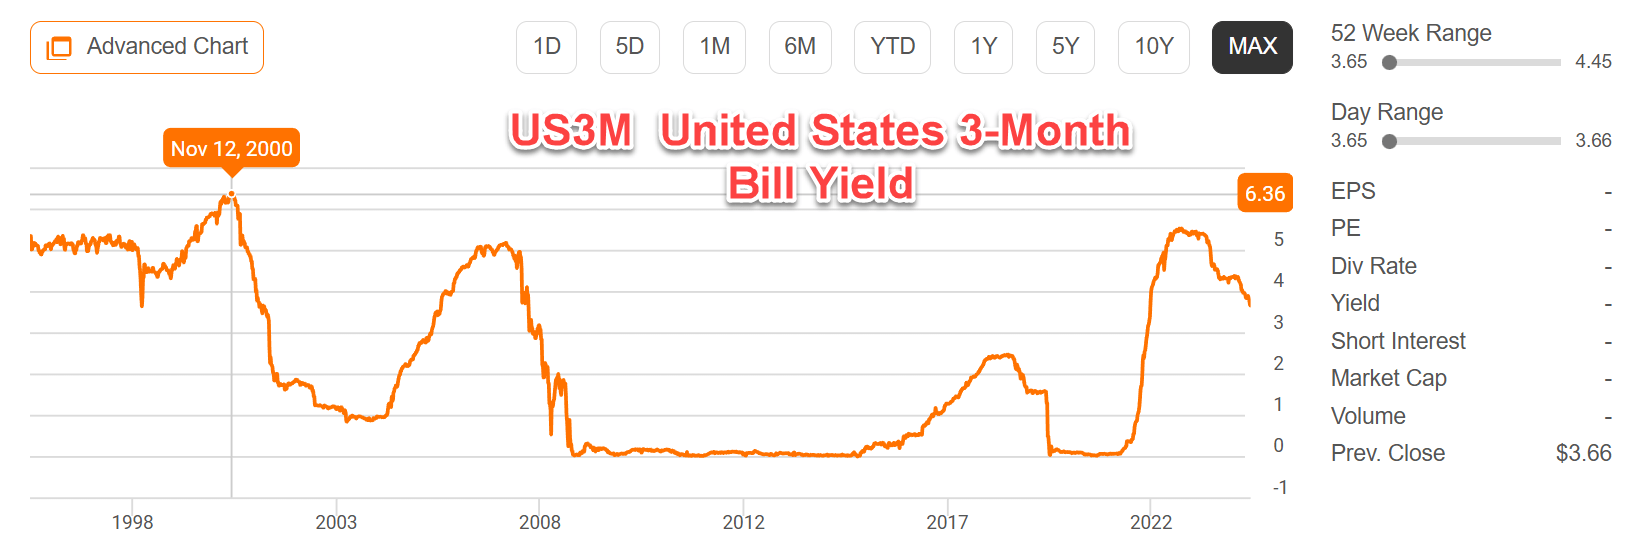
Another fundamental difference between our current situation and the 2000s’ dot-com bubble is interest rates. As seen in the next chart below, the 2000s saw the highest interest rates in the past 3 decades. Even short-term treasury rates (3-month treasury rates) hovered above 5% for years. Looking ahead, I see little chance for interest rates to be that high for that long again. My detailed thought process behind this prediction can be found in an earlier article; the gist is quoted below:
The debt of the country has expanded many drastically in the past 3~4 decades. In the meantime, corporate tax rates have been drastically lowered over the years per data from the Peterson Foundation. Due to the lower tax rates, the United States now collects fewer revenues from corporations, measured as a percentage of its GDP, than most similarly developed countries. In 2022, for example, the latest year for which data is available for international comparison, U.S. corporate tax revenues accounted for just 1.3 percent of GDP, while the average fraction is 3.2% among the 13 developed countries.
Risk-free rates act as the gravity on all asset valuation, especially equity valuation. A structurally lower risk-free rate should be able to support structurally higher equity valuation.
Before closing, my above analyses are oriented towards the long-term and also at a microscopic level. Near-term issues, such as the ongoing trade disputes, inflation, and geopolitical events, can all impact the equity market’s earnings, profit margins, and also valuation multiples. They can also all impact the risk-free interest rates and cause them to go in the opposite direction as I anticipated above. However, if/when these deviations occur, I consider them to be temporary only. And to be completely fair, most of the traditional wisdom the bears love to quote against the current market (Buffet index, rule of 20, high CAPE ratio, etc.) are all long-term oriented and have no near-term predictive power either.
Plus, these traditional wisdoms are all derived from historical data gathered under macroeconomic and geopolitical conditions that are very different from today’s conditions. In particular, this article offered a few counterarguments against the market’s concentration on a few mega-cap stocks and bubble risk (which many bears love to draw similarities from the dot-com). To me, these arguments missed some of the most fundamental aspects, such as the profitability metrics of the mega-caps, their valuation ratios relative to the index average, and also the role of risk-free interest rates
Seeking Alpha
Enjoyed this article? Sign up for our newsletter to receive regular insights and stay connected.