
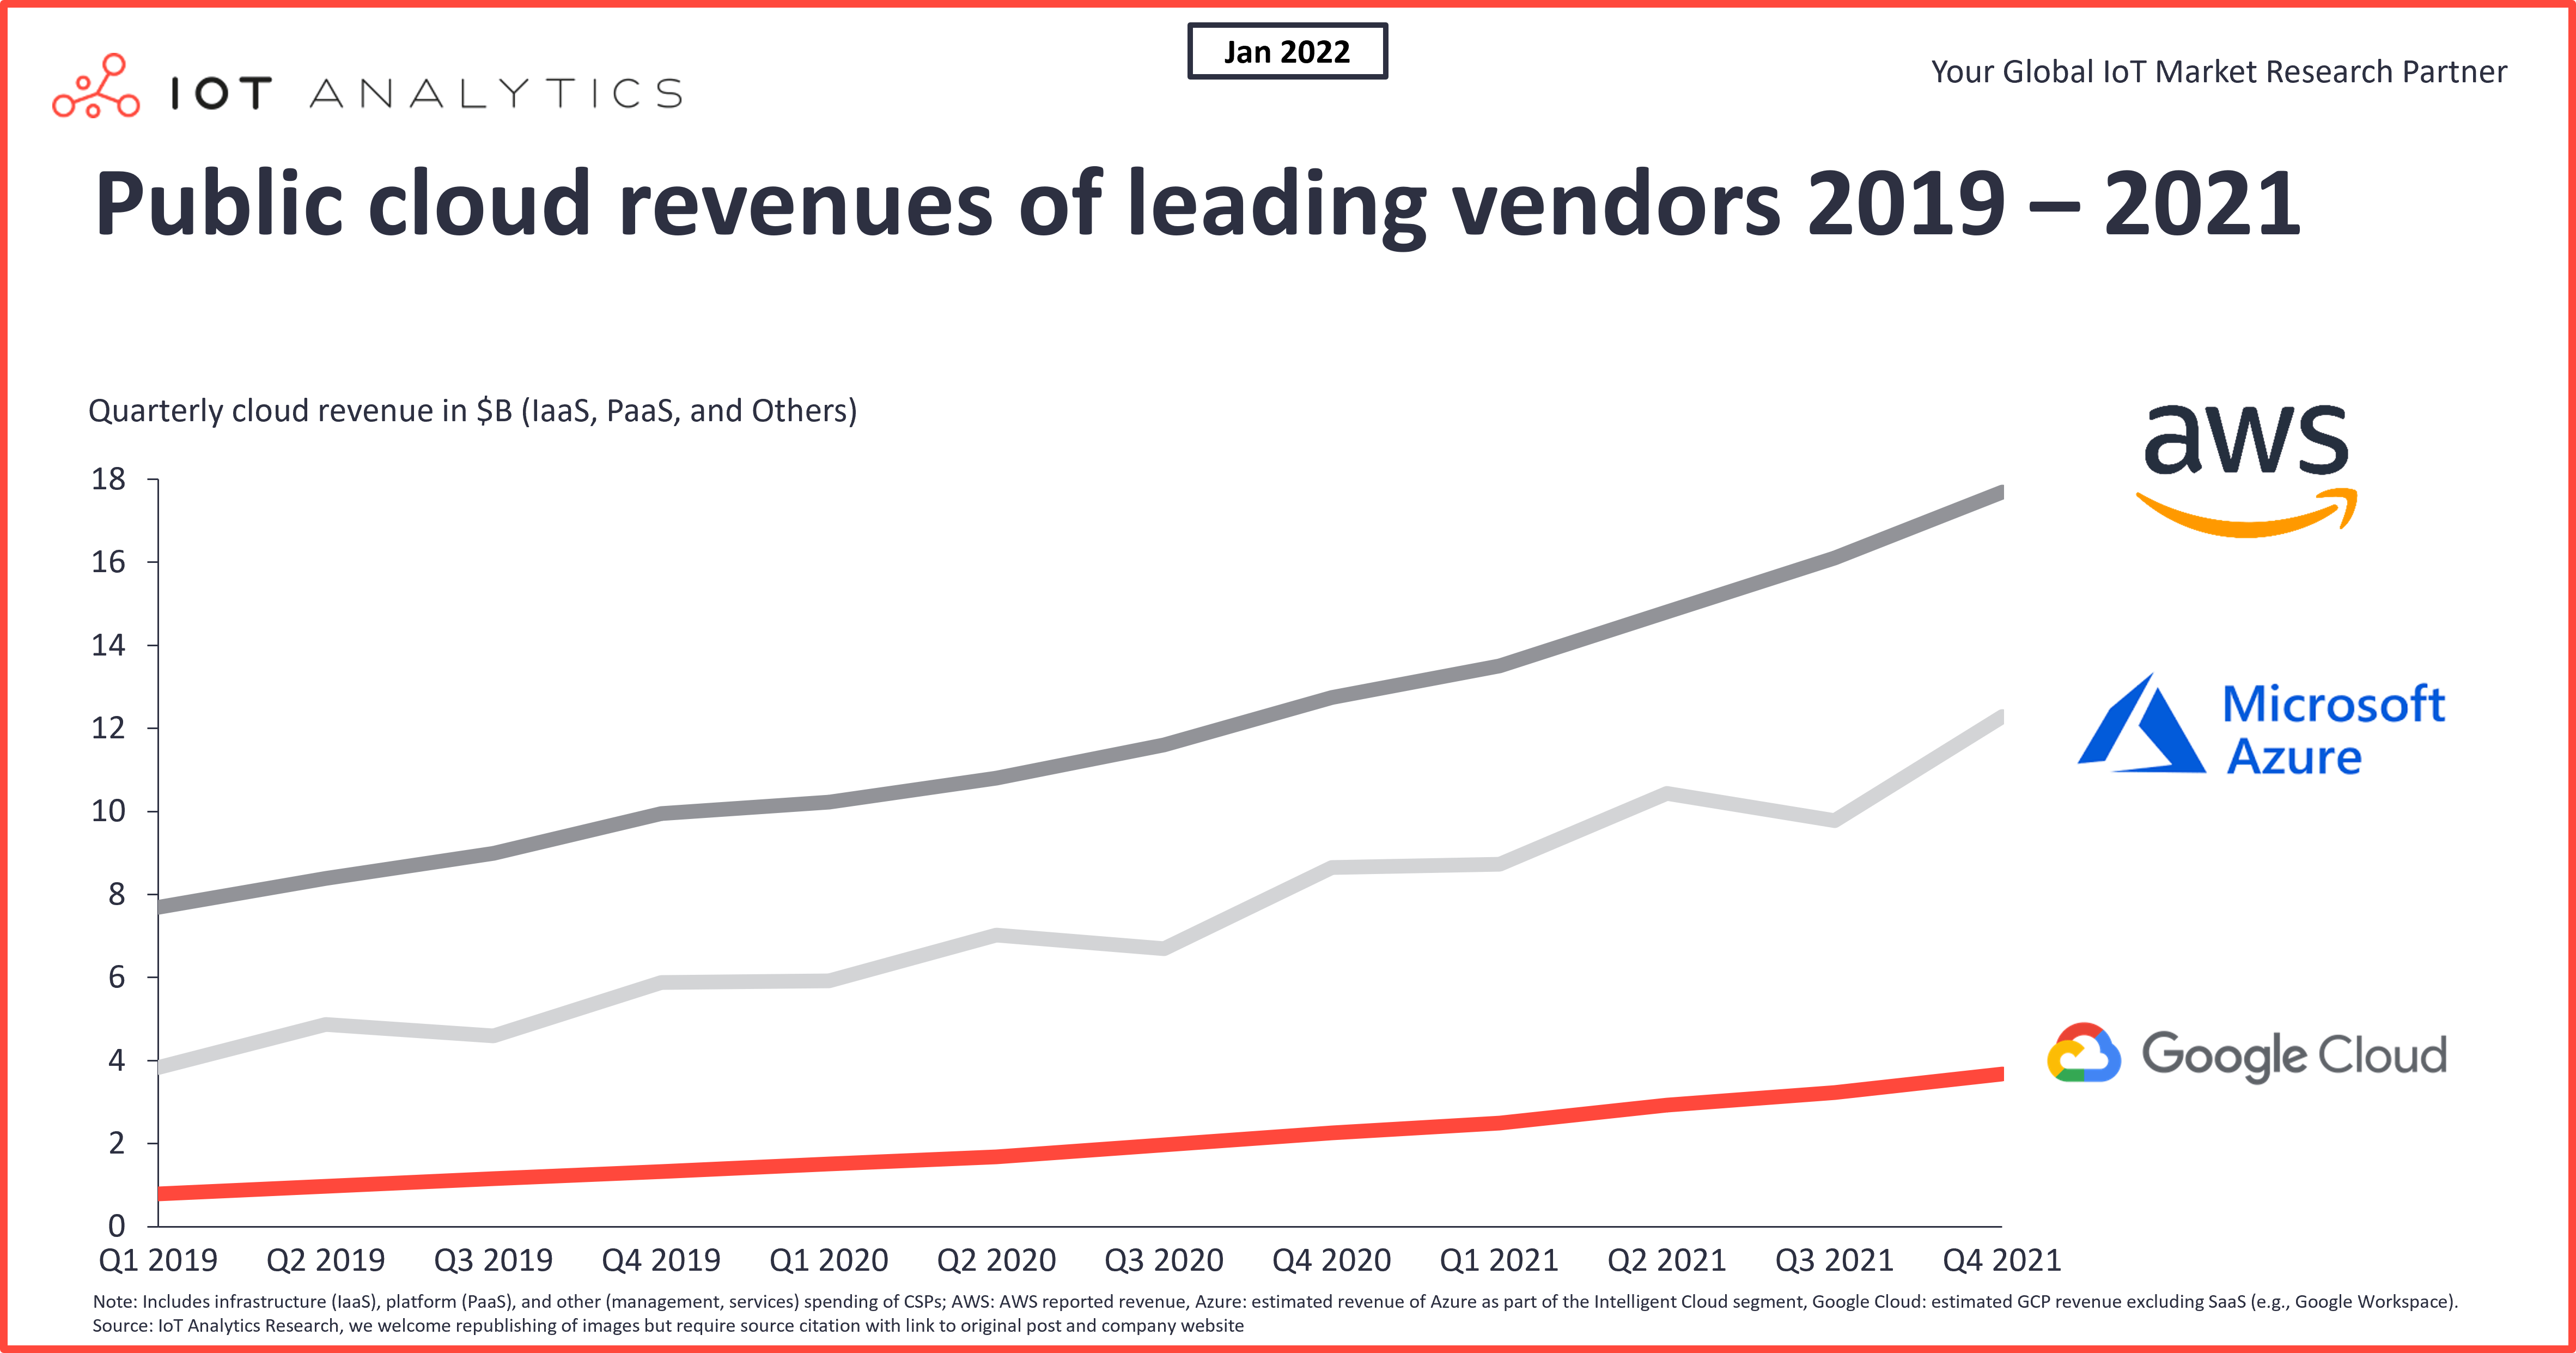
The global public cloud market (hyperscaler IaaS and PaaS) reached $157 billion in 2021, according to our recently released Cloud Computing Market Report 2021–2026.
The cloud market is dominated by three US-based firms that have seen their revenues grow at high double digits for years, with 2021 being no exception. Among the leading firms, both Google Cloud and Microsoft Azure reported 2021 revenue growth near 50% and are closing in on market leader AWS.
When talking to clients, we often get asked similar questions:
- How much longer will these businesses grow at such rates?
- How big will the market be when the growth curve has flattened?
- What share will AWS, Microsoft, Google, and some of the smaller players have?
In the last 12 months, we have developed our opinion regarding market direction based on research into the public cloud market and a deep dive into the IoT cloud market (Note: The IoT cloud market report will be published later in February 2022) . Core to the cloud total addressable market (TAM) analysis are driving factors such as workload adoption, workload spend, and workload expansion, which we discussed and validated with a number of practitioners and end users in the field.
We ran three scenarios and believe that the one we consider most likely will result in a $2 trillion public cloud market in the foreseeable future (a 10–20-year timeframe). This figure represents the market for hyperscalers only. It does not include enterprise spending for thousands of companies building software solutions (mostly SaaS) in the cloud on top of what the hyperscalers provide or on top of their own data center hardware (which is not in the public cloud). Therefore, revenues from companies including Salesforce, SAP, Meta, or Zoom are not considered in this market sizing and neither are any revenues for hardware and chipsets made for data centers.
Starting point: The difficulty in sizing technology markets
In 1943, then-chairman of IBM Thomas Watson predicted, “I think there’s a world market for maybe five computers.” Nearly 80 years later, there are about 2 billion computers in the world without even accounting for smartphones, which are much more powerful than the computers of the 1940s. This example shows how difficult it is to size technology markets, especially early on.
In theory, technology adoption is often approximated using an adoption s-curve. There have been a number of s-curve analyses and maps of technology adoption curves for key inventions in the past 100 years. (See, for example, an analysis in Harvard Business Review here.)
A company operating in a technology market often focuses on the total addressable market (TAM). The TAM describes the potential scale of the market when it has reached maturity and flattened out. (Note: TAM can be used to describe the total market size at the present time or at some later point when the market has reached maturity. In our analysis, we consider a scenario of market maturity in 10–20 years.)
Consider the example of the global smartphone market. It took roughly 10 years for the market to reach maturity and achieve the TAM of approximately 1.5 billion devices sold per year (according to Statista).
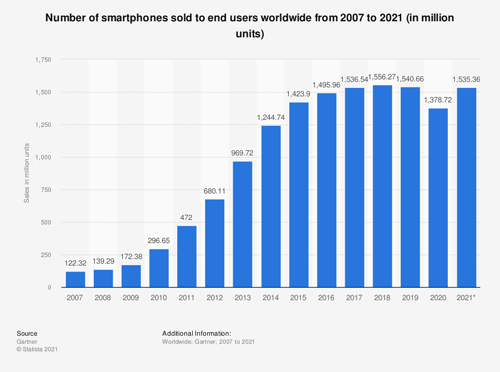
Source: Statista -Number of smartphones sold to end users worldwide from 2007 to 2021
Key factors for determining cloud TAM
In 2006, AWS became the first company to offer public cloud services with the launch of Simple Storage Service (S3). The market has matured tremendously since those early days, and the major players, including AWS, now offer hundreds of different cloud services that are either characterized as Infrastructure-as-a-Service (commonly known as storage, compute, and networking) or Platforms-as-a-Service (additional and sometimes use-case-specific services).
How is cloud adoption measured? Within the complexity of services, practitioners have chosen to zoom in on workload adoption as the dominant variable to measure cloud adoption. “Workload” is a vague term that describes the amount of work performed by an IT system in a given period of time. For example, CPU workload indicates the number of instructions being executed by a processor during a given period or at a particular instant of time.
When sizing the market for public cloud, it is therefore important to understand what percentage of total enterprise workloads are in the public cloud (vs. elsewhere). But it is also important to understand the average workload spend and the amount by which workloads are expanding or contracting in total.
The road to a $2 trillion cloud market (or even more)
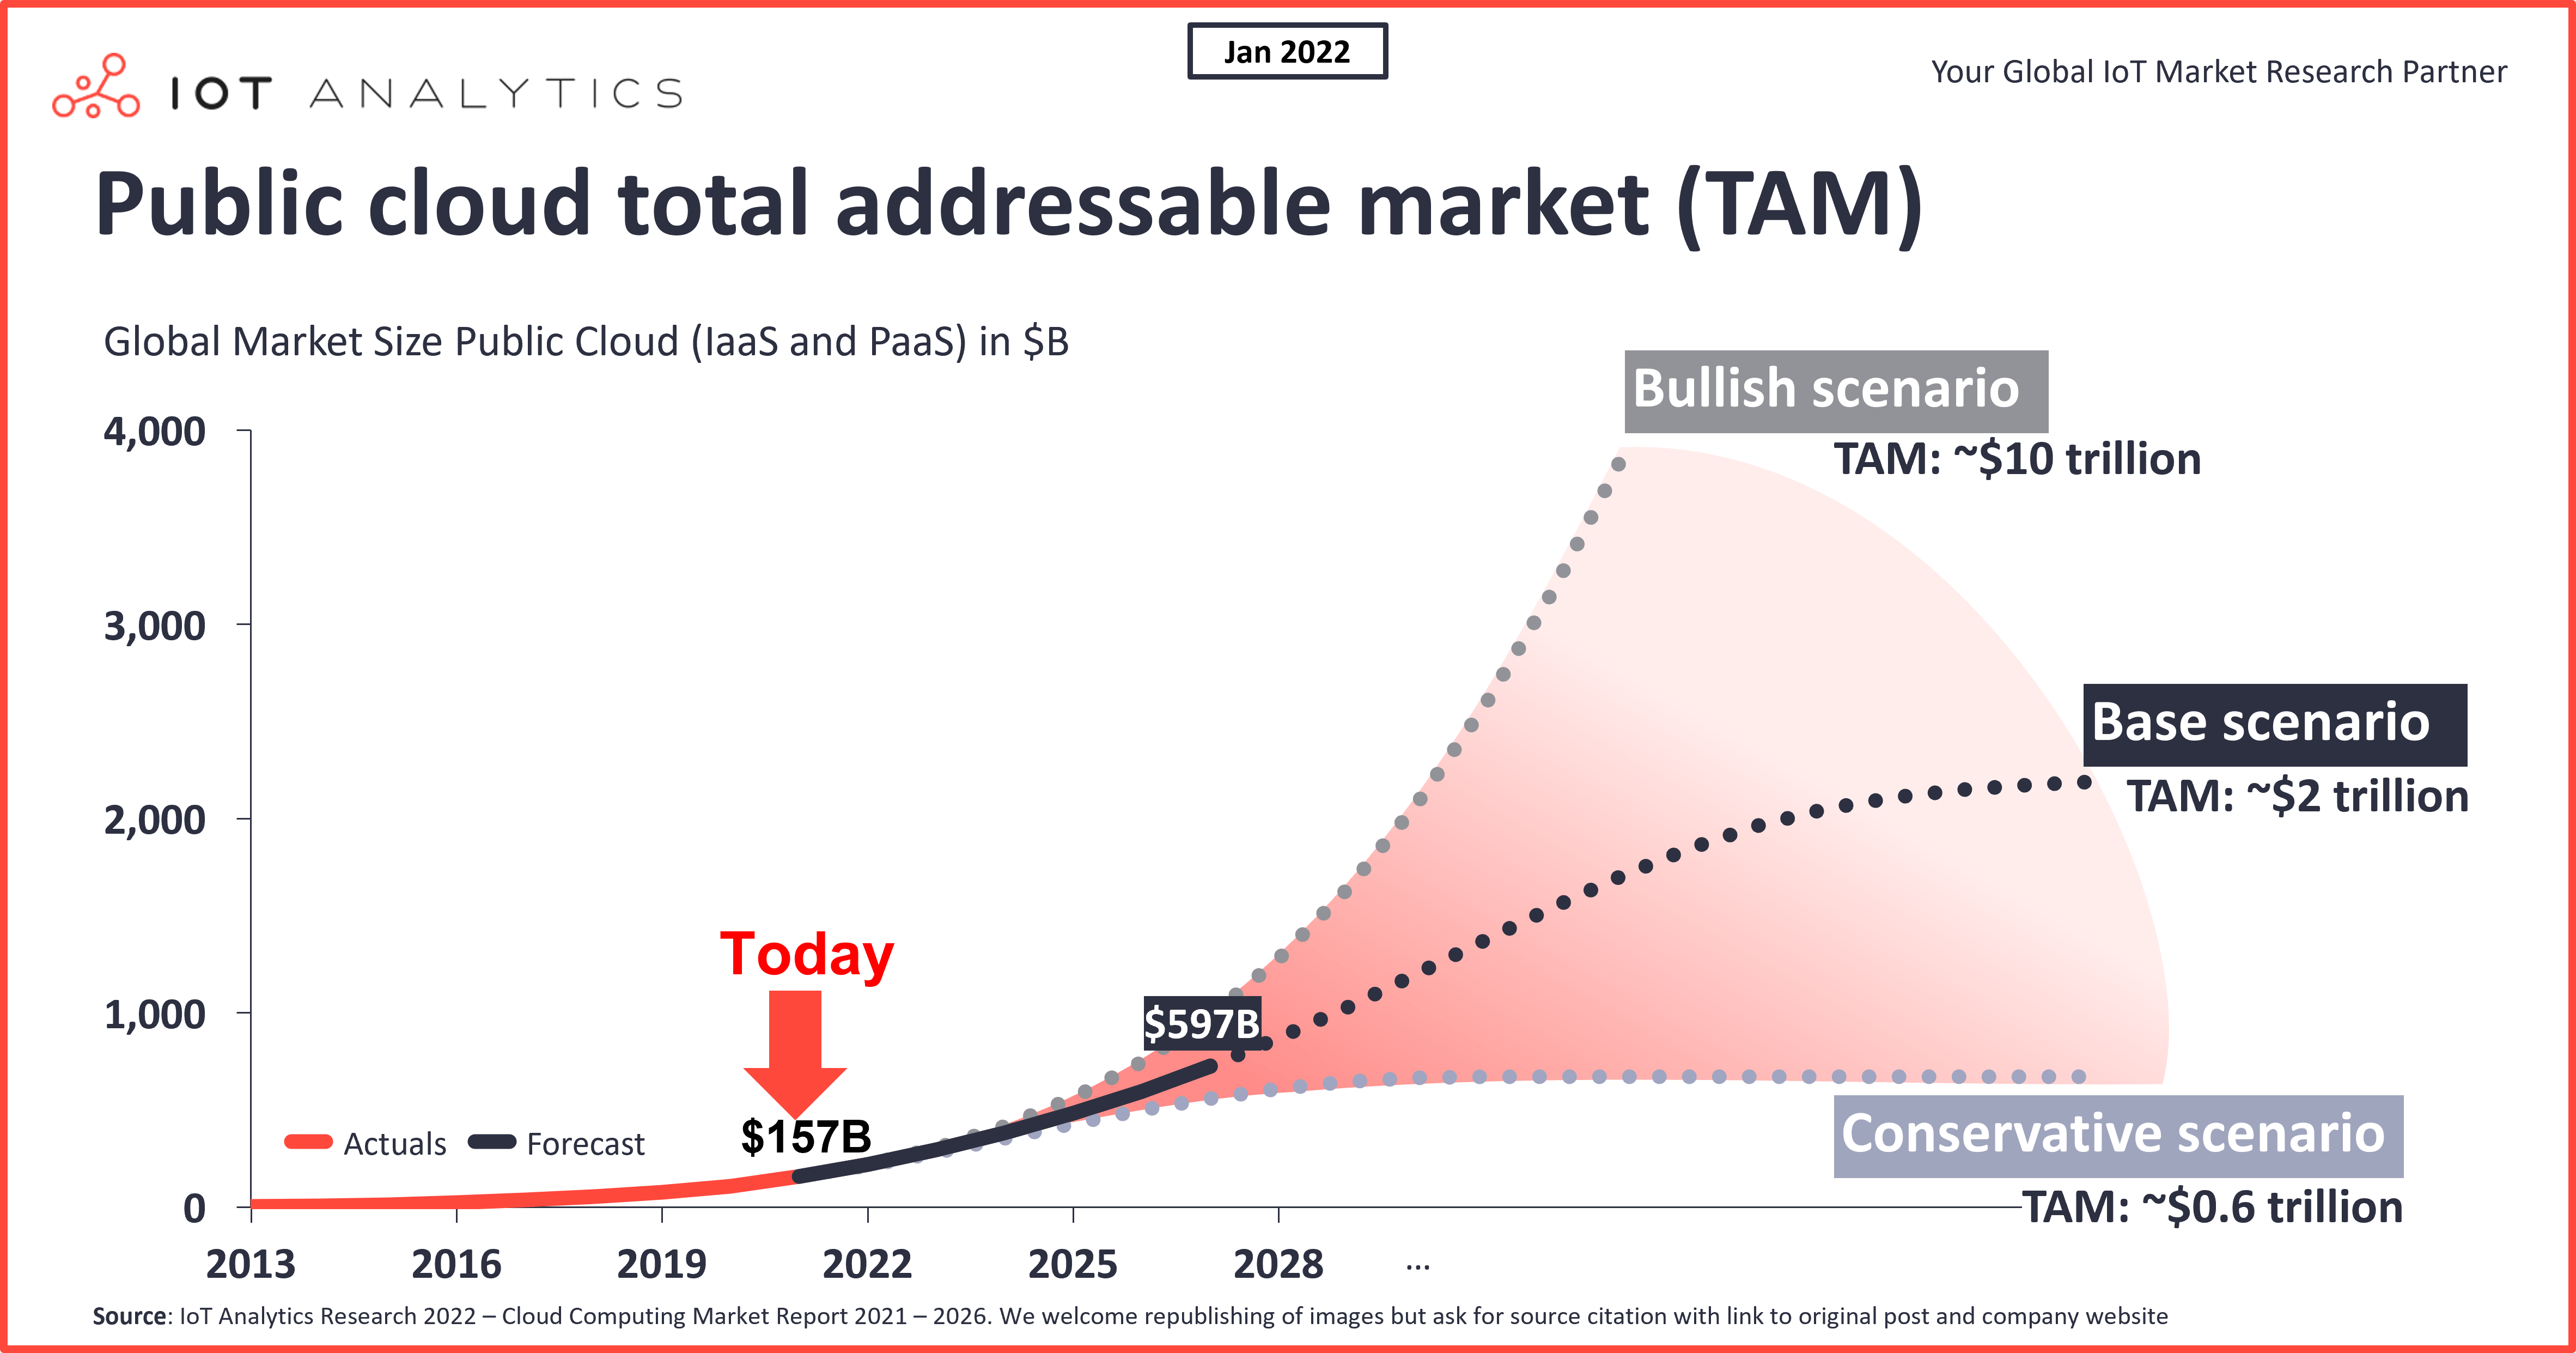
Based on our research, we defined three cases for public cloud TAM:
- Conservative case: This is the scenario we consider the most conservative, resulting in a total cloud TAM of $0.6 trillion.
- Bullish case: This is the scenario we consider the most optimistic, resulting in a total cloud TAM of ~$10 trillion.
- Base case: This is the scenario we consider the most likely and see as the base case going forward, resulting in a total cloud TAM of ~$2 trillion.
1. The conservative case
According to the findings of our cloud research, practitioners estimate the current adoption of public cloud workloads to be between 15% and 25%. When asked what percentage of workloads they imagine seeing in the public cloud in a future end state, answers ranged from 50% to 75%. For the conservative scenario, we assume that we have already reached 25% of workloads at the current market size of $157 billion and will double to 50% workload share from here. While this scenario does assume further price decreases in base workloads on a per-workload basis, it also assumes that general workload expansion will more than offset those price decreases. As an expert from a large cloud integration company put it:
“Spend going down for a given client in a 12-month period is almost unheard of. What we see in practice time and time again is that our customers are so enthralled in what is possible in the cloud that they take the cost savings on a given workload and spend it elsewhere. It is the opposite: Spend goes up and up and up.”
President at a major cloud integration company (January 2022)
In this scenario, the market will more than triple from current levels, but hyperscaler growth rates will come down substantially from the 30–50% growth rate starting next year or the year after.
2. The bull case
The bull case takes the other side of the coin than the conservative case, assuming that the current market of $157 billion reflects 15% of workloads in the cloud, with the end state being approximately 75%. There are good reasons to believe the 15% starting point. Consider the following statements we came across:
“I still speak to organizations that are just getting started on their cloud journey. Their current infrastructure is 100% running their own data centers.”
– COO at a major cloud integration firm (September 2021)
“So I don’t think I have seen yet a company that can say that it has reached 50% of the cloud transformation.”
– Thierry Delaporte, CEO at Wipro Limited (January 2022)
The real story, and the driver of the $10 trillion market cap, however, is not the workload assumption. It is about workload expansion and subsequent spending expansions that could be massive. Reports on the ground are that companies that adopted public cloud early (in 2014 and 2015) are currently going through major modernization cycles, as they need to upgrade to container-based and serverless architectures to compete with more modern cloud architectures. Although the modernization itself typically results in a more efficient and lean architecture, integrators implementing these architectures have told us that once companies have finished their modernization, they end up spending 2x–3x more than they were before the modernization for the same workloads or applications.
“We are at this new trend of internal cloud-to-cloud migration. Many customers that went to cloud providers in 2013, 2014, 2015 haven’t [kept] up with all the new advances and new cloud-native services that have been put out there since. So, now, it is migration from existing AWS to new AWS, and there is so much of that going on in the market right now. By doing this modernization, we witness a two to three times increase in spend with the cloud provider over a 12–18-month period.”
– CEO at a major cloud integration firm (November 2021)
Our bull case assumes that such a modernization of 2.5x additional spend is going to be required every seven years going forward as cloud architectures continue to evolve. Today’s container and serverless architectures or data models might need another major revamp in seven years.
3. Our base case
Our base case reflects what we consider to be most likely to happen. We assume that current cloud adoption stands at 20% (the average of practitioner estimates). We also assume that in the end scenario, 60% of workloads will be in the public cloud. This does leave room for 40% of enterprise workloads to be performed either in private on-premises data centers (still the preference for many large corporates for the majority of workloads) or other edge devices.
The 20% workload assumption is also in line with our own survey data. A 2020 survey on cloud adoption in the manufacturing industry, for example, showed up to 32% current cloud adoption for enterprise asset management applications on the high end and ~15% public cloud adoption for ERP- or MES-type applications.
After running our research, it is clear to us that workload expansion, and specifically workload modernization, is outpacing decreasing workload costs. The cloud enables companies to run new workloads they previously were not running at all. Just consider how product OEMs (such as car companies) are now orchestrating over-the-air updates from the cloud, something they were not doing at all 5–10 years ago. It is expected that data management and AI will become further drivers of additional workloads. Companies are already investing heavily into modern data warehouse PaaS solutions, such as AWS Redshift or Azure Synapse (or third-party solutions, such as Snowflake or Databricks, for that matter). Investment into AI-specific offerings by these companies (such as Google Vertex AI) is still rather low but is expected to increase strongly in the coming years.
With all these additional services and changes to base architecture, we have modeled a 10-year modernization cycle with a 2x increase in costs into our base case.
Making sense of a $2 trillion cloud market
Make no mistake. The cloud market will be massive in any case.
For comparison:
- The conservative market size ($600 billion) is roughly the size of the economy (GDP) of Sweden today.
- The base case ($2 trillion) is roughly the size of the economy of Italy today.
- The bullish case ($10 trillion) is larger than the size of Japan’s and Germany’s economies combined.
The latter scenario seems quite unlikely given that comparison. Nonetheless, data can be seen as the “new oil” fueling the global economy, and the cloud companies are the gate keepers. It is therefore clear that the value of some market participants’ businesses will surpass that of individual nations.
Another proxy to consider is that today’s IT enterprise spending amounts to roughly $4 trillion, or 4.4% of global GDP. Given the importance of data, information technology, and digitization, it is not unimaginable that the share of IT enterprise spending to global GDP would more than double to 10% by 2040 (which would translate to $15 trillion in IT spending in 2040, assuming a global GDP growth of 3%). A $2 trillion spend on public cloud seems almost small in that comparison, though $10 trillion appears quite large.
What could this mean to company valuations?
It looks as though the market for public cloud is going to remain a three-horse race. Assuming one of the companies can continue to hold a 40% market share in a $2 trillion dollar market, a conservative estimate shows that this business could easily be valued at $6 trillion on the market (assuming an operating margin of 30% and a P/E ratio of 25).
Considering that Microsoft, Amazon, and Google today are each valued at around or less than $2 trillion for their entire businesses (with cloud contributing less than one-third of the revenue for each of the three companies), the valuations of these companies could greatly increase (although, in all fairness, this still needs to be earned).
The big unknown: The edge
While cloud momentum seems unbreakable at the moment, there is one substitute to consider: the edge.
Some of the workloads that are currently moving from on-premises systems to the cloud might eventually come back to local compute resources (known as the edge). With compute and storage chips becoming more and more powerful and the overall cloud bill increasing, some companies are evaluating whether the benefits of running workloads on modern edge devices, such as edge servers, gateways, or IPCs, outweigh the benefits of running the same workloads in the cloud for certain scenarios.
For now, the consensus is that we are steering toward a hybrid edge-to-cloud infrastructure, with workloads executed on both sides of the spectrum. The degree to which the edge will be a major threat to cloud companies is not yet clear. While many architectures and services have become standardized for the cloud, the same cannot (yet) be said about the edge.
More information and further reading
Are you interested in learning more about cloud computing?
The Cloud Computing Market Report 2021-2026 is a comprehensive 149-page report highlighting the market and current trends of the global Cloud Computing market. It includes a detailed overview and explanation of the 6 main public cloud building blocks and 31 subelements, market sizing of the public cloud market, a forecast to 2026, a breakdown by country and segment, a look at the competitive landscape, an analysis of nearly 5,000 cloud client case studies, a detailed discussion of 22 recent trends & developments, and much more.
It is part of IoT Analytics’ ongoing coverage of IoT Platforms & Software but goes beyond just the IoT scope of the cloud.
This report provides answers to the following questions (among others):
- How big is the Cloud computing market and how fast is it growing across the following dimensions:
- Type: PaaS vs. IaaS?
- Vertical (13 segments)?
- Country/region (57 countries)?
- How much further runway is there for growth in the market?
- What does the competitive landscape look like in general?
- What do the 3 leading cloud service providers offer in each public cloud building block and how do they differentiate?
- What are the main trends and developments in the cloud market?
- In which sectors of the cloud are VCs investing and where are companies acquiring?
And more…
Sample
The sample of the report gives you a holistic overview of the available analysis (outline, key slides). The sample also provides additional context on the topic and describes the methodology of the analysis. You can download the sample here:
Related articles
You may also be interested in the following recent articles:
- 10 IoT technology trends to watch in 2022
- IoT technology market attractiveness: Where to invest going into 2022
- IoT integrators: The secret backbone of the IoT – Insights from 700+ companies providing professional IoT services
Are you interested in continued IoT coverage and updates?
Subscribe to our newsletter and follow us on LinkedIn and Twitter to stay up-to-date on the latest trends shaping the IoT markets. For complete enterprise IoT coverage with access to all of IoT Analytics’ paid content & reports including dedicated analyst time check out Enterprise subscription.
The post The case for a $2 trillion addressable public cloud market appeared first on IoT Analytics.
Enjoyed this article? Sign up for our newsletter to receive regular insights and stay connected.