
This article describes best practices for monitoring a microservices application that runs on Azure Kubernetes Service (AKS).
In any complex application, at some point something will go wrong. In a microservices application, you need to track what’s happening across dozens or even hundreds of services. To make sense of what’s happening, you must collect telemetry from the application. Telemetry can be divided into logs, traces, and metrics.
Logs are text-based records of events that occur while the application is running. They include things like application logs (trace statements) or web server logs. Logs are primarily useful for forensics and root cause analysis.
Traces, also called Operations connect the steps of a single request across multiple calls within and across microservices. They can provide structured observability into the interactions of system components. Traces can begin early in the request process, like within the UI of an application, and can propagate through network services, across a network of microservices that handle the request.
- Spans are units of work within a trace. Each span is connected with a single trace and can be nested with other spans. They often correspond to individual requests in a cross-service operation, but they can also define work in individual components within a service. Spans also track outbound calls from one service to another (sometimes these are called dependency records).
Metrics are numerical values that can be analyzed. You can use them to observe the system in real time (or close to real time), or to analyze performance trends over time. To understand the system holistically, you must collect metrics at various levels of the architecture, from the physical infrastructure to the application, including:
- Node-level metrics, including CPU, memory, network, disk, and file system usage. System metrics help you to understand resource allocation for each node in the cluster, and troubleshoot outliers.
- Container metrics. For containerized applications, you need to collect metrics at the container level, not just at the VM level.
- Application metrics. This includes any metrics that are relevant to understanding the behavior of a service. Examples include the number of queued inbound HTTP requests, request latency, or message queue length. Applications can also create custom metrics that are specific to the domain, such as the number of business transactions processed per minute.
- Dependent service metrics. Services may call external services or endpoints, such as managed PaaS services or SaaS services. Third-party services may or may not provide any metrics. If not, you’ll have to rely on your own application metrics to track statistics for latency and error rate.
Monitoring cluster status
Use Azure Monitor to monitor the overall health of your clusters. The following screenshot shows a cluster with critical errors in user-deployed pods.
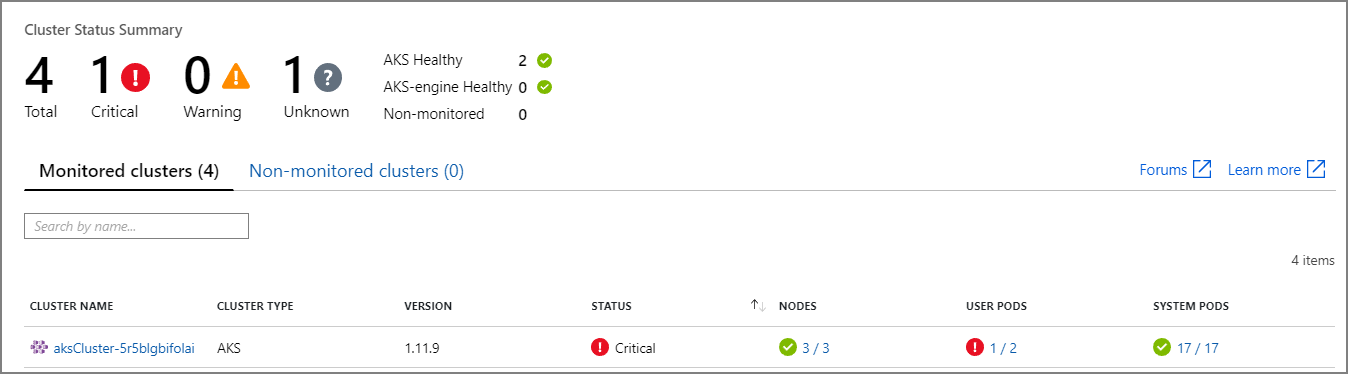
From here, you can drill in further to find the issue. For example, if the pod status is ImagePullBackoff, it means that Kubernetes could not pull the container image from the registry. This could be caused by an invalid container tag or an authentication error trying to pull from the registry.
Note that a container crashing will put the container state into State = Waiting,with Reason = CrashLoopBackOff. For a typical scenario where a pod is part of a replica set and the retry policy is Always, this won’t show as an error in the cluster status. However, you can run queries or set up alerts for this condition. For more information, see Understand AKS cluster performance with Azure Monitor container insights.
Metrics
We recommend using Azure Monitor to collect and view metrics for your AKS clusters and any other dependent Azure services.
- For cluster and container metrics, enable Azure Monitor container insights. When this feature is enabled, Azure Monitor collects memory and processor metrics from controllers, nodes, and containers via the Kubernetes metrics API. For more information about the metrics that are available through Azure Monitor container insights, see Understand AKS cluster performance with Azure Monitor container insights.
- Use Application Insights to collect application metrics. Application Insights is an extensible Application Performance Management (APM) service. To use it, you install an instrumentation package in your application. This package monitors the app and sends telemetry data to the Application Insights service. It can also pull telemetry data from the host environment. The data is then sent to Azure Monitor. Application Insights also provides built-in correlation and dependency tracking (see Distributed tracing, below).
Application Insights has a maximum throughput measured in events/second, and it throttles if the data rate exceeds the limit. For details, see Application Insights limits. Create different Application Insights instances per environment, so that dev/test environments don’t compete against the production telemetry for quota.
A single operation can generate many telemetry events, so if the application experiences a high volume of traffic, its telemetry capture is likely to get throttled. To mitigate this problem, you can perform sampling to reduce the telemetry traffic. The tradeoff is that your metrics will be less precise, unless the instrumentation supports pre-aggregation (in which case there will be fewer trace samples for troubleshooting, but the metrics will maintain accuracy). For more information, see Sampling in Application Insights. You can also reduce the data volume by pre-aggregating metrics — that is, calculating statistical values, such as the average and standard deviation, and sending those values instead of the raw telemetry. The following blog post describes an approach to using Application Insights at scale: Azure Monitoring and Analytics at Scale.
If your data rate is high enough to trigger throttling, and sampling or aggregation are not acceptable, consider exporting metrics to a time-series database, such as Azure Data Explorer, Prometheus, or InfluxDB running in the cluster.
- Azure Data Explorer is an Azure-native highly-scalable data exploration service for log and telemetry data. Data Explorer features support for multiple data formats, a rich query language, and connections to consume data in popular tools like Jupyter Notebooks and Grafana. Azure Data Explorer has built-in connectors to ingest log and metrics data via Azure Event Hub. See Ingest and query monitoring data in Azure Data Explorer.
- InfluxDB is a push-based system. An agent needs to push the metrics. You can use TICK stack, to setup monitoring of Kubernetes, and push it to InfluxDB using Telegraf, which is an agent for collecting and reporting metrics. InfluxDB can be used for irregular events and string data types.
- Prometheus is a pull-based system. It periodically scrapes metrics from configured locations. Prometheus can scrape metrics generated by Azure Monitor or kube-state-metrics. kube-state-metrics is a service that collects metrics from the Kubernetes API server and makes them available to Prometheus (or a scraper that is compatible with a Prometheus client endpoint). For system metrics, use Node exporter, which is a Prometheus exporter for system metrics. Prometheus supports floating point data, but not string data, so it is appropriate for system metrics but not logs. Kubernetes Metrics Server is a cluster-wide aggregator of resource usage data.
Logging
Here are some of the general challenges of logging in a microservices application:
- Understanding the end-to-end processing of a client request, where multiple services might be invoked to handle a single request.
- Consolidating logs from multiple services into a single aggregated view.
- Parsing logs that come from multiple sources, which use their own logging schemas or have no particular schema. Logs may be generated by third-party components that you don’t control.
- Microservices architectures often generate a larger volume of logs than traditional monoliths, because there are more services, network calls, and steps in a transaction. That means logging itself can be a performance or resource bottleneck for the application.
There are some additional challenges for a Kubernetes-based architecture:
- Containers can move around and be rescheduled.
- Kubernetes has a networking abstraction that uses virtual IP addresses and port mappings.
In Kubernetes, the standard approach to logging is for a container to write logs to stdout and stderr. The container engine redirects these streams to a logging driver. For ease of querying, and to prevent possible loss of log data if a node crashes, the usual approach is to collect the logs from each node and send them to a central storage location.
Azure Monitor integrates with AKS to support this approach. Azure Monitor collects container logs and sends them to a Log Analytics workspace. From there, you can use the Kusto query language to write queries across the aggregated logs. For example, here is a Kusto query to show the container logs for a specified pod:
let ContainerIdList = KubePodInventory
| where ClusterName =~ '<cluster-name>'
| where Name =~ '<pod-name>'
| distinct ContainerID;
ContainerLog
| where ContainerID in (ContainerIdList)
Azure Monitor is a managed service, and configuring an AKS cluster to use Azure Monitor is a simple configuration switch in the CLI or Resource Manager template. (For more information, see How to enable Azure Monitor container insights.) Another advantage of using Azure Monitoring is that it consolidates your AKS logs with other Azure platform logs, providing a unified monitoring experience.
Azure Monitor is billed per gigabyte (GB) of data ingested into the service (see Azure Monitor pricing). At very high volumes, cost may become a consideration. There are many open-source alternatives available for the Kubernetes ecosystem. For example, many organizations use Fluentd with Elasticsearch. Fluentd is an open-source data collector, and Elasticsearch is a document database that is for search. A challenge with these options is that they require additional configuration and management of the cluster. For a production workload, you may need to experiment with configuration settings. You’ll also need to monitor the performance of the logging infrastructure.
OpenTelemetry
OpenTelemetry is a cross-industry effort to improve tracing by standardizing the interface between applications, libraries, telemetry, and data collectors. When using a libray and framework that are instrumented with OpenTelemetry, most of the work of tracing traditionally system operations is handled by the underlying libraries, which includes the following common scenarios:
- Logging basic request operations, such as start/exit time and duration
- Exceptions thrown
- Context propagation (such as sending a correlation ID across HTTP call boundaries)
Instead, the base libraries and frameworks that handle these operations create rich interrelated span and trace data structures and propagate these across contexts. Before OpenTelemetry, these were usually just injected as special log messages or as proprietary data structures that were specific to the vendor who built the monitoring tools. OpenTelemetry also encourages a richer instrumentation data model than a traditional logging-first approach, and the logs are made more useful since the log messages are linked to the traces and spans where they were generated. This often makes finding logs that are associated with a specific operation or request very easy.
Many of the Azure SDKs have been instrumented with OpenTelemetry or are in the process of implementing it.
An application developer can add manual instrumentation by using the OpenTelemetry SDKs to do the following:
- Add instrumentation where an underlying library does not provide it.
- Enrich the trace context by adding spans to expose application-specific units of work (such as an order loop that creates a span for the processing of each order line).
- Enrich existing spans with entity keys, in order to enable easier tracing (for example, add an “OrderID” key/value to the request that processes that order). These are surfaced by the monitoring tools as structured values for querying, filtering, and aggregating (without parsing out log message strings or looking for combinations of log message sequences, as was commmon with a logging-first approach).
- Propagate trace context by accessing trace and span attributes, injecting traceIds into responses and payloads and/or reading traceIds from incoming messages, in order to create requests and spans.
Read more about instrumentation and the OpenTelemetry SDKs, in the OpenTelemetry documentation.
Application Insights
Application Insights collects rich data from OpenTelemetry and its instrumentation libraries, capturing it in an efficient data store to provide rich visualization and query support. The Application Insights OpenTelemetry-based instrumentation libraries, for languages such as .NET, Java, Node.js, or Python, make it easy to send telemetry data to Application Insights.
If you are using .NET Core, we recommend also looking at the Application Insights for Kubernetes library. This library enriches Application Insights traces with additional information, such as the container, node, pod, labels, and replica set.
Application Insights maps the OpenTelemetry context to its internal data model:
- Trace -> Operation
- Trace ID -> Operation ID
- Span -> Request or Dependency
Considerations:
- Application Insights throttles the telemetry if the data rate exceeds a maximum limit; for details, see Application Insights limits. A single operation may generate several telemetry events, so if the application experiences a high volume of traffic, it is likely to get throttled.
- Because Application Insights batches data, it’s possible to lose a batch if a process crashes with an unhandled exception.
- Application Insights is billed based on data volume. For more information, see Manage pricing and data volume in Application Insights.
Structured logging
To make logs easier to parse, use structured logging where possible. Structured logging is approach where the application writes logs in a structured format, such as JSON, rather than outputting unstructured text strings. There are many structured logging libraries available. For example, here is a logging statement that uses the Serilog library for .NET Core:
public async Task<IActionResult> Put([FromBody]Delivery delivery, string id)
{
    logger.LogInformation("In Put action with delivery {Id}: {@DeliveryInfo}", id, delivery.ToLogInfo());

    ...
}
Here, the call to LogInformation includes an Id parameter and DeliveryInfo parameter. With structured logging, these values are not interpolated into the message string. Instead, the log output will look something like this:
{"@t":"2019-06-13T00:57:09.9932697Z","@mt":"In Put action with delivery {Id}: {@DeliveryInfo}","Id":"36585f2d-c1fa-4a3d-9e06-a7f40b7d04ef","DeliveryInfo":{...
This is a JSON string, where the “@t” field is a timestamp, “@mt” is the message string, and the remaining key/value pairs are the parameters. Outputting JSON format makes it easier to query the data in a structured way. For example, the following Log Analytics query, written in the Kusto query language, searches for instances of this particular message from all containers named fabrikam-delivery:
traces
| where customDimensions.["Kubernetes.Container.Name"] == "fabrikam-delivery"
| where customDimensions.["{OriginalFormat}"] == "In Put action with delivery {Id}: {@DeliveryInfo}"
| project message, customDimensions["Id"], customDimensions["@DeliveryInfo"]
Viewing the result in the Azure portal shows that DeliveryInfo is a structured record that contains the serialized representation of the DeliveryInfo model:
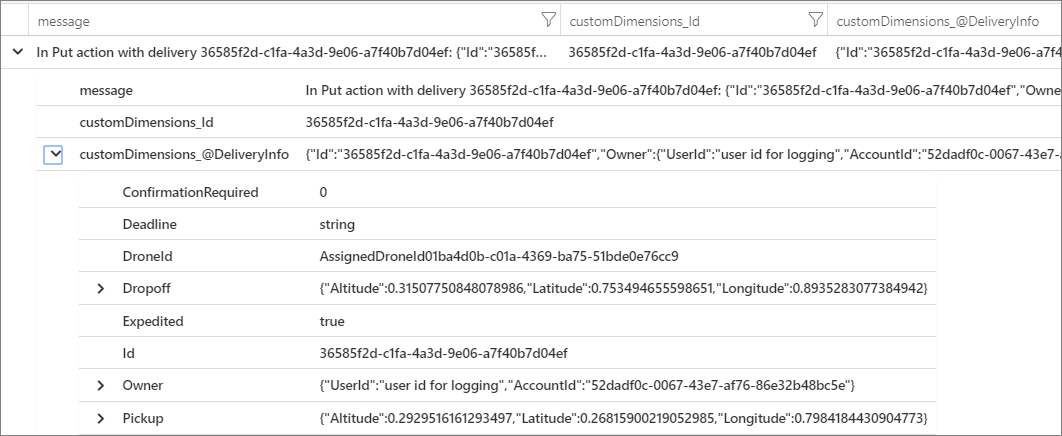
Here is the JSON from this example:
{
  "Id": "36585f2d-c1fa-4a3d-9e06-a7f40b7d04ef",
  "Owner": {
    "UserId": "user id for logging",
    "AccountId": "52dadf0c-0067-43e7-af76-86e32b48bc5e"
  },
  "Pickup": {
    "Altitude": 0.29295161612934972,
    "Latitude": 0.26815900219052985,
    "Longitude": 0.79841844309047727
  },
  "Dropoff": {
    "Altitude": 0.31507750848078986,
    "Latitude": 0.753494655598651,
    "Longitude": 0.89352830773849423
  },
  "Deadline": "string",
  "Expedited": true,
  "ConfirmationRequired": 0,
  "DroneId": "AssignedDroneId01ba4d0b-c01a-4369-ba75-51bde0e76cc9"
}
Many log messages mark the start or end of a unit of work, or they connect a business entity with a set of messages and operations for traceability. In many cases, enriching OpenTelemetry span and request objects is a better approach than only logging the start and end of that operation. This adds that context to all connected traces and child operations, and it puts that information in the scope of the full operation. The OpenTelemetry SDKs for various langauges support creating spans or adding custom attributes on spans. Using the Java OpenTelemetry SDK that’s (supported by Application Insights). An existing parent span (for example, a request span that’s associated with a REST controller call and created by the web framework being used) can be enriched with an entity ID that’s associated with it. See the following script:
import io.opentelemetry.api.trace.Span;

// ...

Span.current().setAttribute("A1234", deliveryId);
This code sets a key or value on the current span, which is connected to operations and log mesages that occur under that span. This appears in the Application Insights request object, as shown in the following code:
requests
| extend deliveryId = tostring(customDimensions.deliveryId)  // promote to column value (optional)
| where deliveryId == "A1234"
| project timestamp, name, url, success, resultCode, duration, operation_Id, deliveryId
This becomes more powerful when used with logs, filtering, and annotating log traces with span context. See the following:
requests
| extend deliveryId = tostring(customDimensions.deliveryId)  // promote to column value (optional)
| where deliveryId == "A1234"
| project deliveryId, operation_Id, requestTimestamp = timestamp, requestDuration = duration  // keep some request info
| join kind=inner traces on operation_Id   // join logs only for this deliveryId
| project requestTimestamp, requestDuration, logTimestamp = timestamp, deliveryId, message
By using a library or framework that’s already instrumented with OpenTelemetry, it handles creating spans and requests, but the application code might also create units of work. For example, a method that loops through an array of entities that performs work on each one, might create a span for each iteration of the processing loop. See the OpenTelemery Instrumenting documentation, on how to add instrumentation to application and library code.
Distributed tracing
A significant challenge of microservices is to understand the flow of events across the services. A single transaction can involve calls to multiple services.
Example of distributed tracing
This example follows a distributed transaction through a set of microservices. The example is taken from a reference implementation described here.

In this scenario, the distributed transaction has the following steps:
- The Ingestion service puts a message on a Service Bus queue.
- The Workflow service pulls the message from the queue.
- The Workflow service calls three backend services to process the request (Drone Scheduler, Package, and Delivery).
The following screenshot shows the application map for the Drone Delivery application. This map shows calls to the public API endpoint that result in a workflow that involves five microservices.
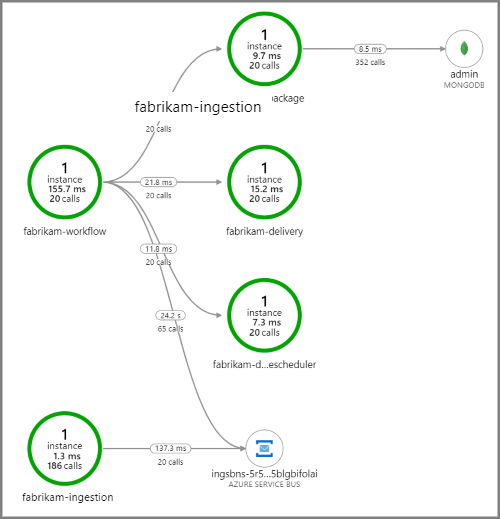
The arrows from fabrikam-workflow and fabrikam-ingestion to a Service Bus queue show where the messages are sent and received. You can’t tell from the diagram which service is sending messages and which is receiving — the arrows just show that both services are calling Service Bus — but this information is available in the details:
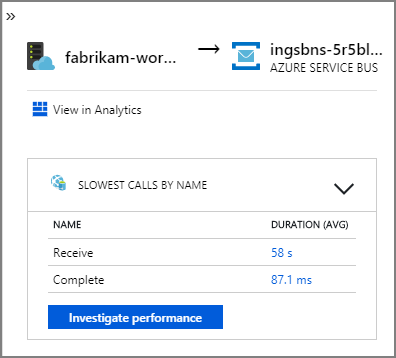
Because every call includes an operation ID, you can also view the end-to-end steps in a single transaction, including timing information and the HTTP calls at each step. Here is the visualization of one such transaction:

This visualization shows the steps from the ingestion service to the queue, from the queue to the workflow service, and from the workflow service to the other backend services. The last step is the Workflow service marking the Service Bus message as completed.
Now here is an example when calls to a backend service were failing:
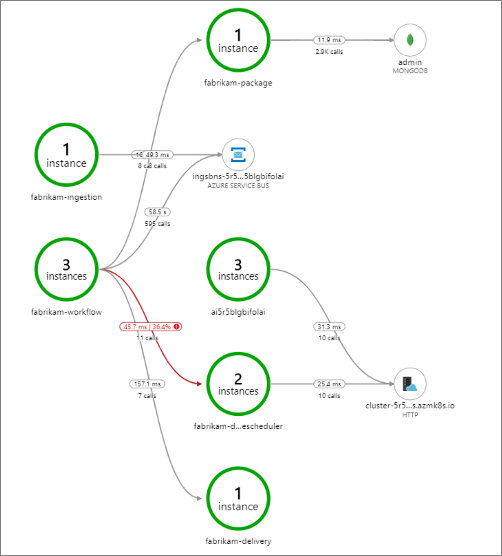
This shows that a large fraction (36%) of calls to the Drone Scheduler service failed during the period being queried. In the end-to-end transaction view, it shows that an exception occurs when sending an HTTP PUT request to the service.
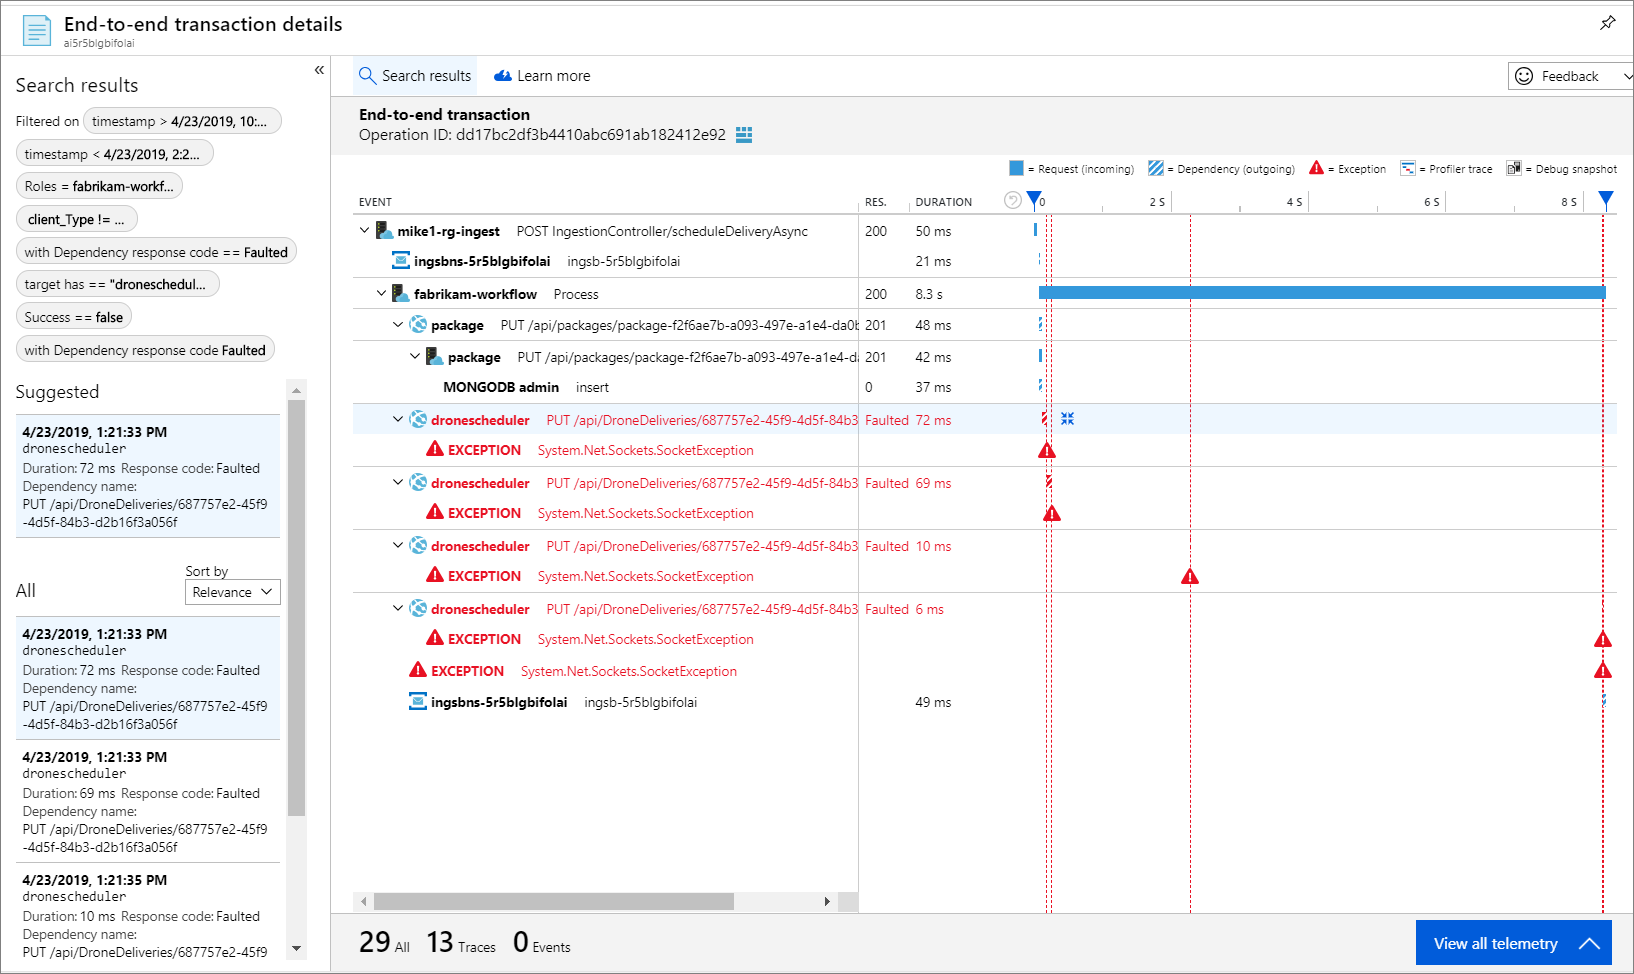
Further drilling in, the exception turns out to be a socket exception, “No such device or address.”
Fabrikam.Workflow.Service.Services.BackendServiceCallFailedException: No such device or address —u003e System.Net.Http.HttpRequestException: No such device or address —u003e System.Net.Sockets.SocketException: No such device or address
This is a hint that the backend service is not reachable. At this point, you might use kubectl to view the deployment configuration. In this example, it turned out the service hostname was not resolving, due to an error in the Kubernetes configuration files. The article Debug Services in the Kubernetes documentation has tips for diagnosing this sort of error.
Here are some common causes of errors:
- Code bugs. These might manifest as:
- Exceptions. Look in the Application Insights logs to view the exception details.
- Process crashing. Look at container and pod status, and view container logs or Application Insights traces.
- HTTP 5xx errors
- Resource exhaustion:
- Look for throttling (HTTP 429) or request timeouts.
- Examine container metrics for CPU, memory, and disk
- Look at the configurations for container and pod resource limits.
- Service discovery. Examine the Kubernetes service configuration and port mappings.
- API mismatch. Look for HTTP 400 errors. If APIs are versioned, look at which version is being called.
- Error pulling a container image. Look at the pod specification. Also make sure the cluster is authorized to pull from the container registry.
- RBAC issues.
Next steps
Learn more about features in Azure Monitor that support monitoring of applications on AKS:
For more information about using metrics for performance tuning, see see Performance tuning a distributed application.
Enjoyed this article? Sign up for our newsletter to receive regular insights and stay connected.