
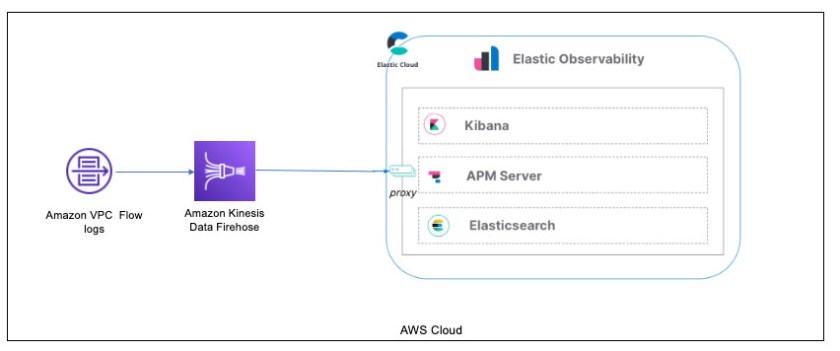
The notable technical shift is not improved analytics alone, but the removal of intermediate plumbing between AWS log sources and Elastic. By wiring Kinesis Data Firehose directly to an Elastic endpoint, the setup bypasses Lambda transforms, S3 staging, agents, and Beats, which materially changes operational burden. For teams that need VPC flow logs quickly, the value is lower integration overhead and faster time to first query, not a claim that insight itself becomes effortless or automatic.
The mechanism is straightforward: Firehose accepts streams from AWS services, forwards them to an Elastic deployment on AWS, and maps them into a named data stream such as logs-aws.vpcflow-default. That matters because the resulting records are immediately usable in Discover, dashboards, and anomaly detection without a custom pipeline. Practitioners can filter rejected traffic, inspect source IPs, and identify suspicious ports like 8081, turning raw network telemetry into an operational signal before the next incident window closes.
The limits are equally important. This integration depends on an Elastic deployment on AWS, valid credentials, and the correct VPC flow log configuration, so it is not a universal shortcut. The out-of-the-box dashboard and machine-learning views still rely on disciplined data selection and interpretation; they surface patterns, but they do not replace network policy or incident response. For operators, the significance is practical: less ingestion engineering, more immediate visibility, and clearer tradeoffs around where complexity now lives.
This is a guest post co-written with Udayasimha Theepireddy from Elastic. Processing and analyzing log and Internet of Things (IoT) data can be challenging, especially when dealing with large volumes of real-time data. Elastic and Amazon Kinesis Data Firehose are two powerful tools that can help make this process easier. For example, by using Kinesis Data Firehose to ingest data from IoT devices, you can stream data directly into Elastic for real-time analysis. This can help you identify patterns and anomalies in the data as they happen, allowing you to take action in real time. Additionally, by using Elastic to store and analyze log data, you can quickly search and filter through large volumes of log data to identify issues and troubleshoot problems. In this post, we explore how to integrate Elastic and Kinesis Data Firehose to streamline log and IoT data processing and analysis. We walk you through a step-by-step example of how to send VPC flow logs to Elastic through Kinesis Data Firehose.
Solution overview
Elastic is an AWS ISV Partner that helps you find information, gain insights, and protect your data when you run on AWS. Elastic offers enterprise search, observability, and security features that are built on a single, flexible technology stack that can be deployed anywhere. Kinesis Data Firehose is a popular service that delivers streaming data from over 20 AWS services such as AWS IoT Core and Amazon CloudWatch logs to over 15 analytical and observability tools such as Elastic. Kinesis Data Firehose provides a fast and easy way to send your VPC flow logs data to Elastic in minutes without a single line of code and without building or managing your own data ingestion and delivery infrastructure. VPC flow logs capture the traffic information going to and from your network interfaces in your VPC. With the launch of Kinesis Data Firehose support to Elastic, you can analyze your VPC flow logs with just a few clicks. Kinesis Data Firehose provides a true end-to-end serverless mechanism to deliver your flow logs to Elastic, where you can use Elastic Dashboards to search through those logs, create dashboards, detect anomalies, and send alerts. VPC flow logs help you to answer questions like what percentage of your traffic is getting dropped, and how much traffic is getting generated for specific sources and destinations. Integrating Elastic and Kinesis Data Firehose is a straightforward process. There are no agents and beats. Simply configure your Firehose delivery stream to send its data to Elastic’s endpoint. The following diagram depicts this specific configuration of how to ingest VPC flow logs via Kinesis Data Firehose into Elastic.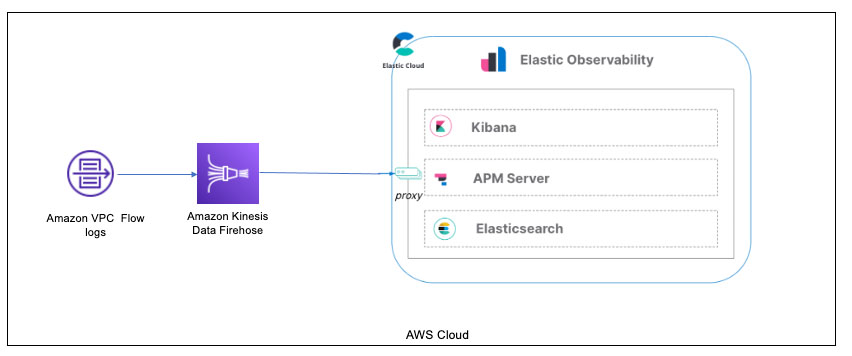
Prerequisites
To set up this demonstration, make sure you have the following prerequisites:- An account on Elastic Cloud and a deployed stack on AWS. Deploying this on AWS is required for Kinesis Data Firehose log ingestion. For instructions, refer to Installing the Elastic Stack.
- An AWS account with permissions to pull the necessary data from AWS.
- VPC flow logs enabled for the VPC where the application is deployed and configured to send data to Kinesis Data Firehose.
- A three-tier web architecture in AWS, which can ingest metrics from several AWS services.
Deploy Elastic on AWS
Follow the instructions on the Elastic registration page to get started on Elastic Cloud.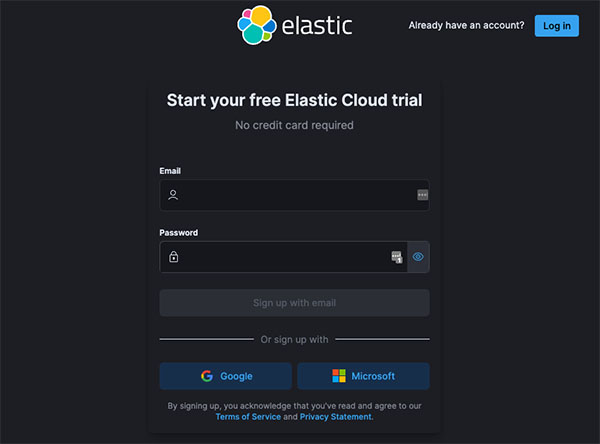
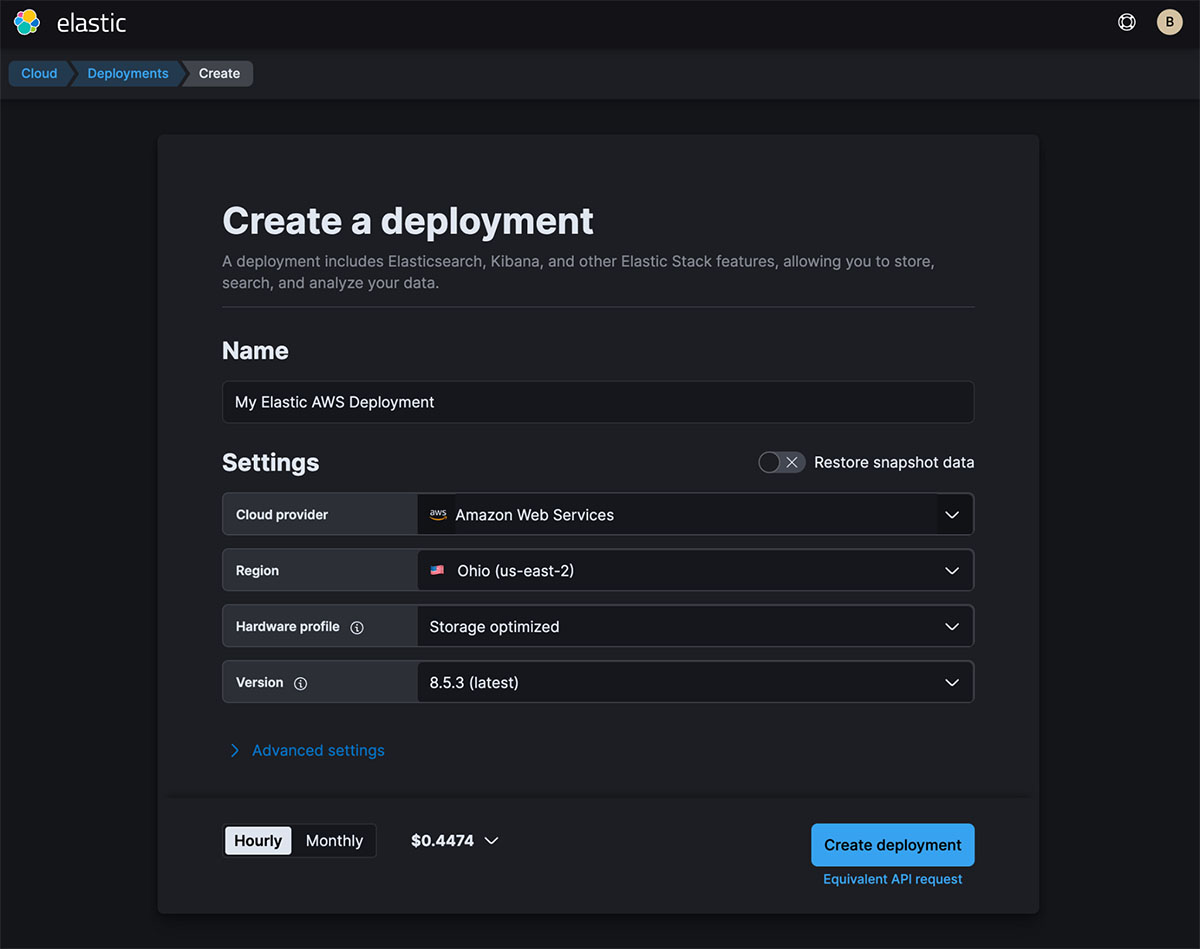

https://thevaa-cluster-01.es.us-east-1.aws.found.io.
Enable Elastic’s AWS integration
In your deployment’s Elastic Integration section, navigate to the AWS integration and choose Install AWS assets.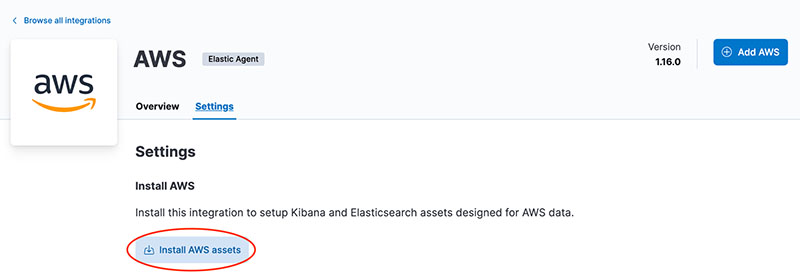
Configure a Firehose delivery stream
Create a new delivery stream on the Kinesis Data Firehose console. This is where you provide the endpoint you saved earlier. Refer to the following screenshot for the destination settings, and for more details, refer to Choose Elastic for Your Destination.
logs-aws.vpcflow-default). The parameter es_datastream_name can be configured with one of the following types of logs:
- logs-aws.cloudfront_logs-default – AWS CloudFront logs
- logs-aws.ec2_logs-default – Amazon Elastic Compute Cloud (Amazon EC2) logs in CloudWatch
- logs-aws.elb_logs-default – Elastic Load Balancing logs
- logs-aws.firewall_logs-default – AWS Network Firewall logs
- logs-aws.route53_public_logs-default – Amazon Route 53 public DNS queries logs
- logs-aws.route53_resolver_logs-default – Route 53 DNS queries and responses logs
- logs-aws.s3access-default – Amazon S3 server access log
- logs-aws.vpcflow-default – VPC flow logs
- logs-aws.waf-default – AWS WAF logs
Deploy your application
Follow the instructions on the GitHub repo and instructions in the AWS Three Tier Web Architecture workshop to deploy your application. After you install the app, get your credentials from AWS to use with Elastic’s AWS integration. There are several options for credentials:- Use access keys directly
- Use temporary security credentials
- Use a shared credentials file
- Use an AWS Identity and Access Management (IAM) role Amazon Resource Name (ARN)
Configure VPC flow logs to send to Kinesis Data Firehose
In the VPC for the application you deployed, you need to configure your VPC flow logs and point them to the Firehose delivery stream.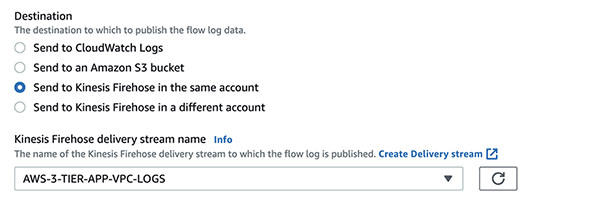
Validate the VPC flow logs
In the Elastic Observability view of the log streams, you should see the VPC flow logs coming in after a few minutes, as shown in the following screenshot.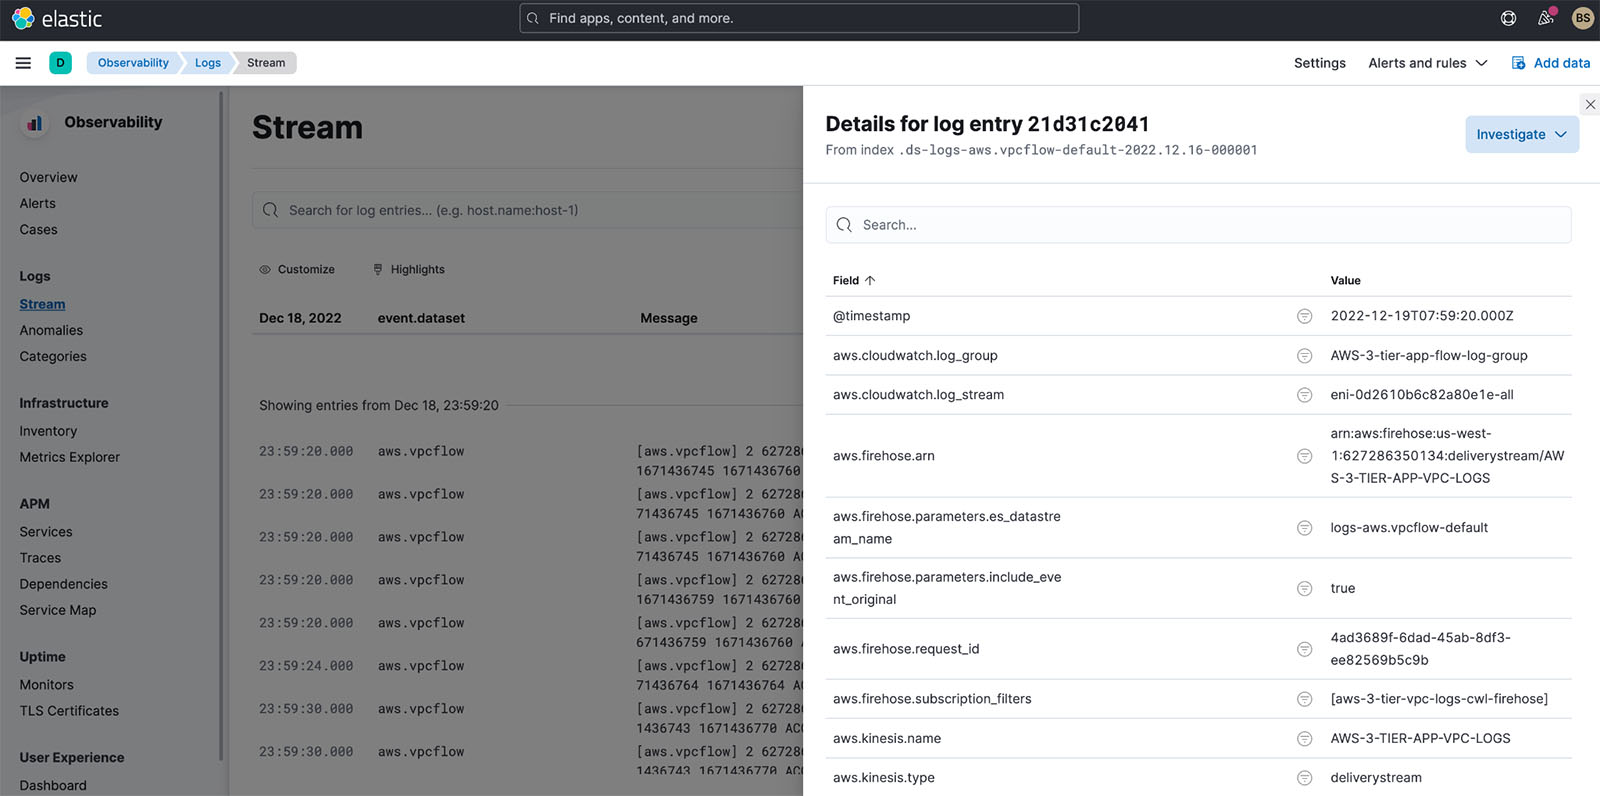
Analyze VPC flow logs in Elastic
Now that you have VPC flow logs in Elastic Cloud, how can you analyze them? There are several analyses you can perform on the VPC flow log data:- Use Elastic’s Analytics Discover capabilities to manually analyze the data
- Use Elastic Observability’s anomaly feature to identify anomalies in the logs
- Use an out-of-the-box dashboard to further analyze the data
Use Elastic’s Analytics Discover to manually analyze data
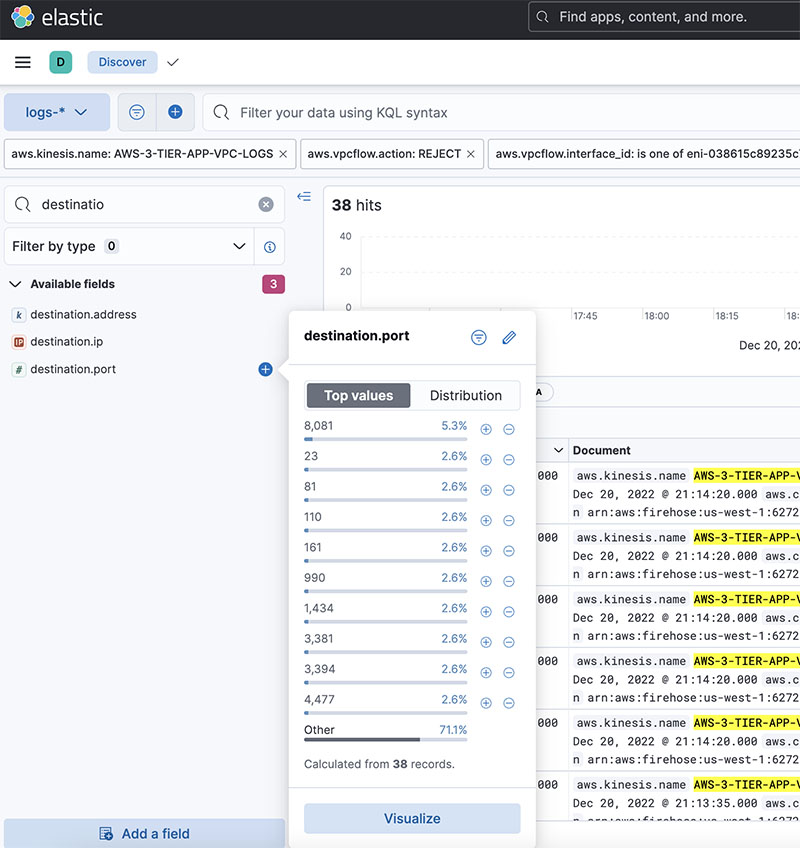
In Elastic Analytics, you can search and filter your data, get information about the structure of the fields, and display your findings in a visualization. You can also customize and save your searches and place them on a dashboard. For a complete understanding of Discover and all of Elastic’s Analytics capabilities, refer to Discover. For VPC flow logs, it’s important to understand the following:- How many logs were accepted or rejected
- Where potential security violations occur (source IPs from outside the VPC)
- What port is generally being queried
- Delivery stream name –
AWS-3-TIER-APP-VPC-LOGS - VPC flow log action –
REJECT - Time frame – 5 hours
- VPC network interface – Webserver 1 and Webserver 2 interfaces
REJECT actions from. We simply find the source.ip field and can quickly get a breakdown that shows 185.156.73.54 is the most rejected for the last 3 or more hours we’ve turned on VPC flow logs.
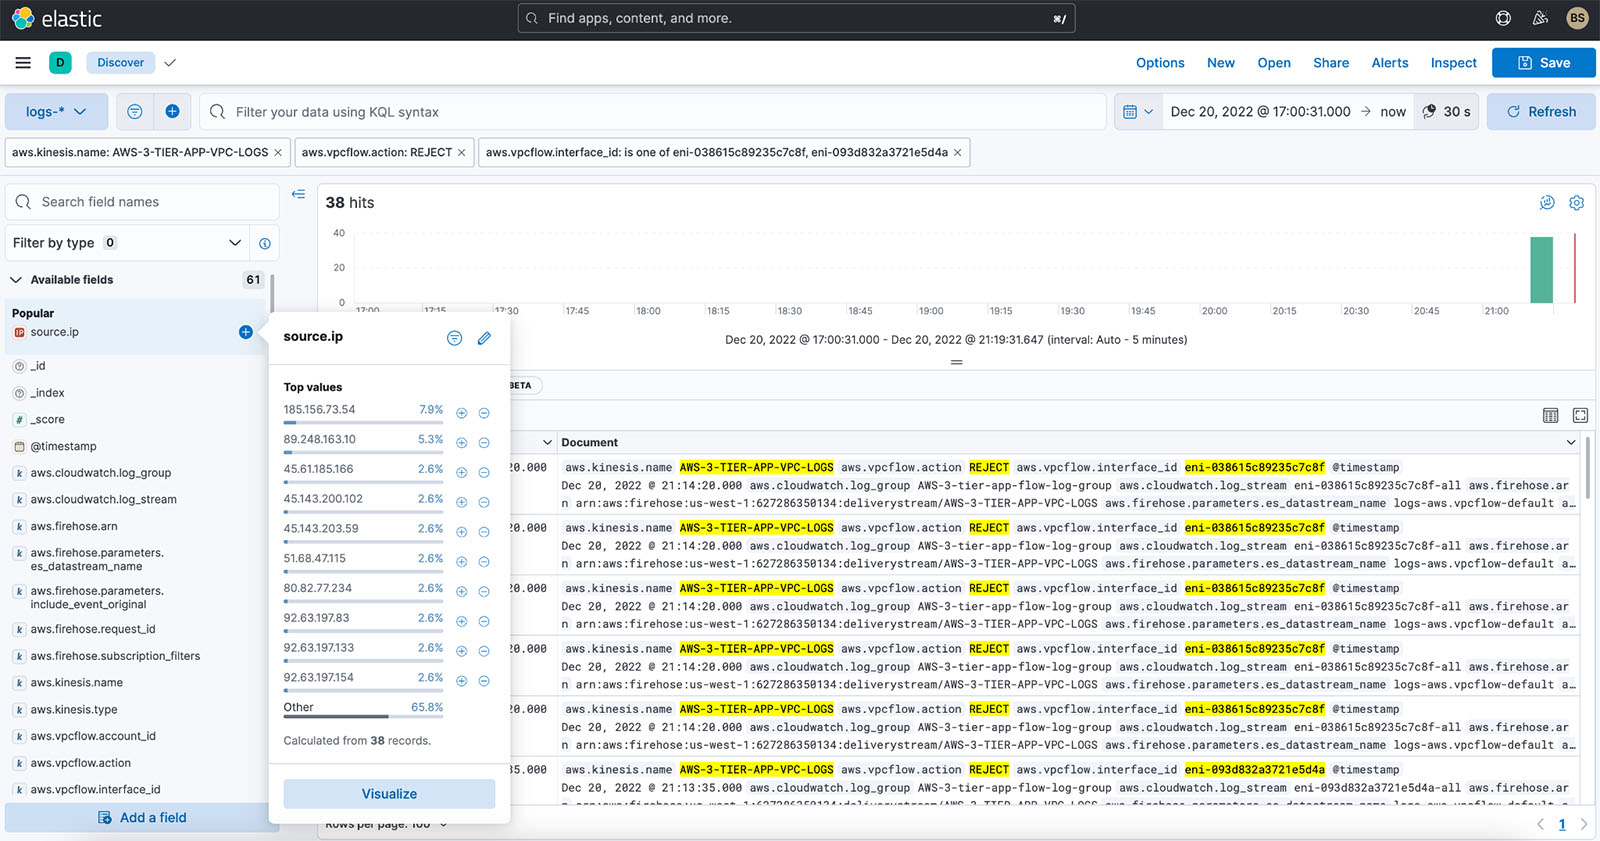

8081 is being targeted. This port is generally used for the administration of Apache Tomcat. This is a potential security issue, however port 8081 is turned off for outside traffic, hence the REJECT.
Detect anomalies in Elastic Observability logs
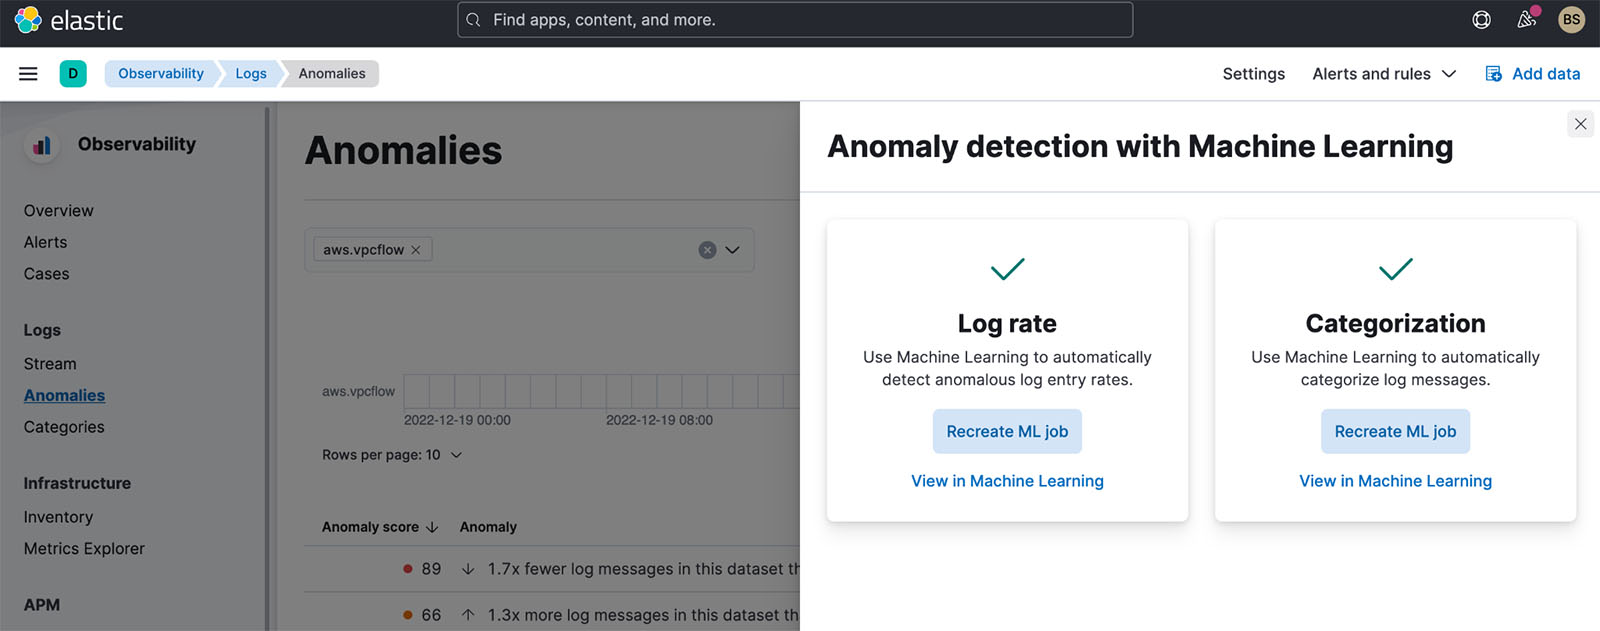
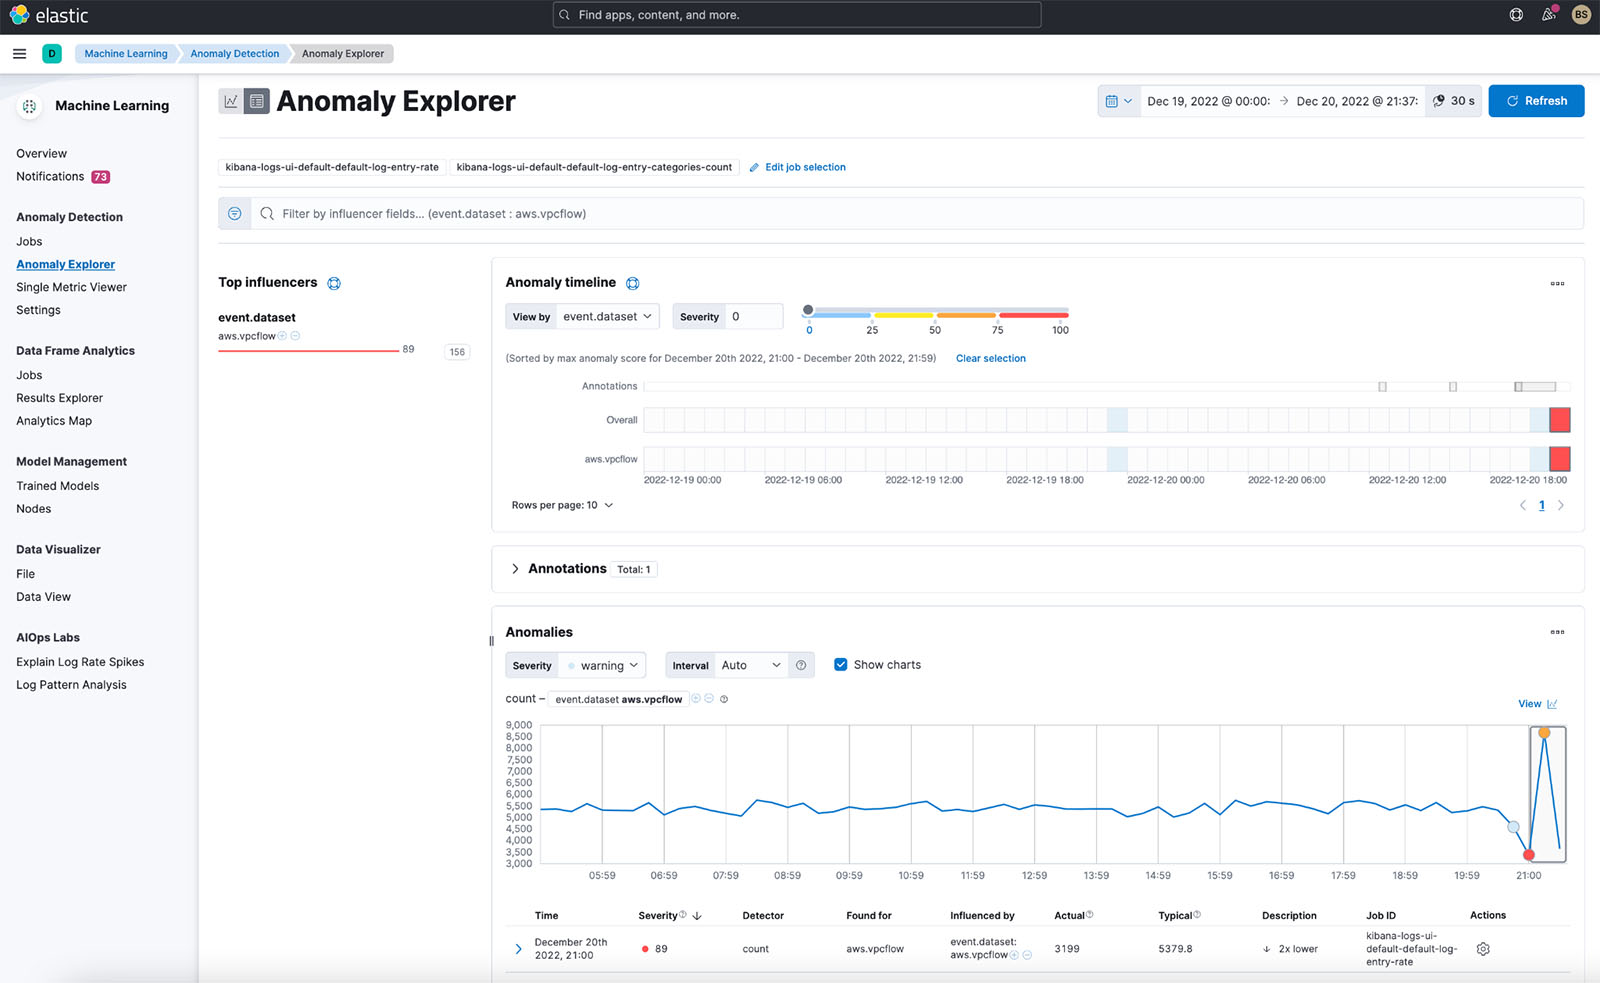
In addition to Discover, Elastic Observability provides the ability to detect anomalies on logs using machine learning (ML). The feature has the following options:- Log rate – Automatically detects anomalous log entry rates
- Categorization – Automatically categorizes log messages


Use the VPC flow log dashboard
Finally, Elastic also provides an out-of-the-box dashboard to show the top IP addresses hitting your VPC, geographically where they are coming from, the time series of the flows, and a summary of VPC flow log rejects within the time frame. You can enhance this baseline dashboard with the visualizations you find in Discover, as we discussed earlier.
Conclusion
This post demonstrated how to configure an integration with Kinesis Data Firehose and Elastic for efficient infrastructure monitoring of VPC flow logs in Elastic Kibana dashboards. Elastic offers flexible deployment options on AWS, supporting software as a service (SaaS), Original Postp/Elasticsearch-Inc-Elasticsearch-Service-on-Elastic/B01N6YCISK" target="_blank" rel="noopener">AWS Marketplace, and bring your own license (BYOL) deployments. Elastic also provides AWS Marketplace private offers. You have the option to deploy and run the Elastic Stack yourself within your AWS account, either free or with a paid subscription from Elastic. To get started, visit the Kinesis Data Firehose console and specify Elastic as the destination. To learn more, explore the Amazon Kinesis Data Firehose Developer Guide.About the Authors
Udayasimha Theepireddy is an Elastic Principal Solution Architect, where he works with customers to solve real world technology problems using Elastic and AWS services. He has a strong background in technology, business, and analytics. Antony Prasad Thevaraj is a Sr. Partner Solutions Architect in Data and Analytics at AWS. He has over 12 years of experience as a Big Data Engineer, and has worked on building complex ETL and ELT pipelines for various business units. Mostafa Mansour is a Principal Product Manager – Tech at Amazon Web Services where he works on Amazon Kinesis Data Firehose. He specializes in developing intuitive product experiences that solve complex challenges for customers at scale. When he’s not hard at work on Amazon Kinesis Data Firehose, you’ll likely find Mostafa on the squash court, where he loves to take on challengers and perfect his dropshots.Enjoyed this article? Sign up for our newsletter to receive regular insights and stay connected.