ProShares UltraPro Short QQQ ETF: More Frequent 10% Yield Opportunities
Summary
- The SQQQ ETF provides 3 times inverse exposure to the Nasdaq-100 index.
- Intra-day volatility indicates that there are significant opportunities for making daily gains of 10% and above.
- However, it is important to consider the risks.
- Market conditions are currently uncertain with COVID lurking in the White House but expect more of a correction, not a sell-off.
- SQQQ is appropriate both for trading and as part of a hedging strategy.
Only three weeks back, nothing seemed to be able to stop the surge of technological names on the stock market with the NASDAQ composite index setting a new all-time high.
That was on September 2 and on that very date the tech index was at a yearly high of 35%, a performance well above that of other stock market indices.
The next day changed all that with the Invesco QQQ ETF (QQQ) down by 5%. On the other hand, the ProShares UltraPro Short QQQ ETF (NASDAQ:SQQQ), which follows the opposite path to QQQ but three times more aggressively, gained 15%.
Figure 1: Share price evolution of QQQ and SQQQ during the last 3 months.
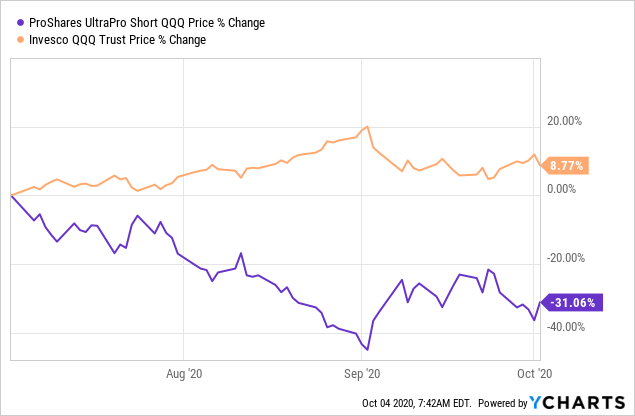
Now, a 15% gain on $10,000 during a single day represents a win of $1,500 (excluding fees) over the market but there are compounding risks trading the SQQQ.
Still, its average daily volume traded exceeds even the popular QQQ despite carrying a higher expense ratio of 0.95% and this indicates that there must be advantages despite the risks.
For that matter QQQ carries an expense ratio of only 0.20%.
Therefore, identifying the opportunities either for trading to make some quick bucks or as part of a hedging strategy makes sense.
The opportunities
SQQQ is also one of the most actively traded ETFs in the world providing three times inverse (-3x) exposure to the Nasdaq-100.
Therefore, SQQQ makes progress when there is havoc in the markets, especially impacting tech stocks. Also, the ProShares ETF is not necessarily designed for the bear market but to take advantage of downturns in just any market condition.
It is able to do so by providing inverse exposure to the tech-heavy NASDAQ and excludes financial names.
For the purpose of providing inverse exposure the fund mainly applies a swap mechanism on QQQ.
Figure 2: Top 10 constituents of the NASDAQ-100 by weight.
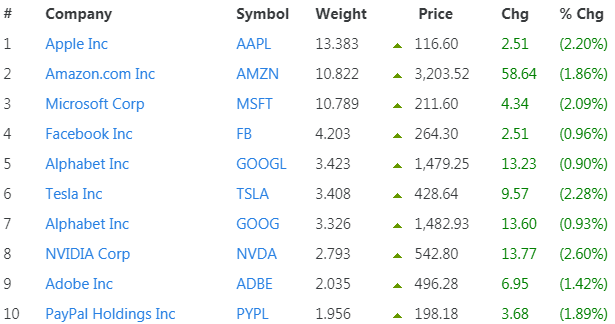
Source: Slickcharts.com
Therefore, looking for an opportunity to profit from SQQQ entails identifying situations when these big names are likely to face trouble or taking cognizance of macro-economic conditions which may impact the broader stock market.
To this end, most investors are already aware that we are amid a period of increased volatility for tech stocks, previously seen as a safe haven of high growth. There have often been trading days when the broader S&P 500 and the Dow Jones indices, more focused on industrial stocks, were up while the NASDAQ declined.
Some analysts refer to this broader stock movement as a rotation from tech to value stocks.
Therefore, the ingredients which can potentially cause the market to fluctuate are present but more precision is needed as to the degree of volatility and this can only be made possible through close observation of SQQQ’s intra-day share price evolution.
For this purpose, I calculated the percentage difference between the daily Highs and the Lows for SQQQ over the last one year in order to find out the intra-day volatility.
Figure 3: Percentage difference between the daily Highs and Lows when these are higher than 10%.
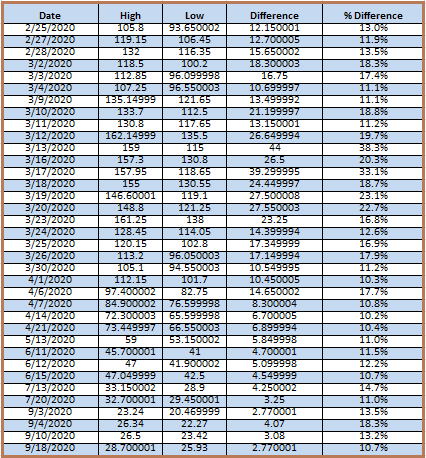
Source: Table compiled with data from Yahoo Finance
On filtering out all values below 10% and treating the highly volatile month of March as an exceptional case, a trend starts to appear.
This trend shows that after the relatively non-volatile (on an intra-day basis) months of April, May, June, July and August, September has been marked by a return of higher volatility, while still being dwarfed by March’s highs.
Hence, last month has been marked by four days when the intra-day volatility exceeded 10% with September 4th being the culminating point at 18.3%.
Figure 4: Trending the intra-day volatility for SQQQ.
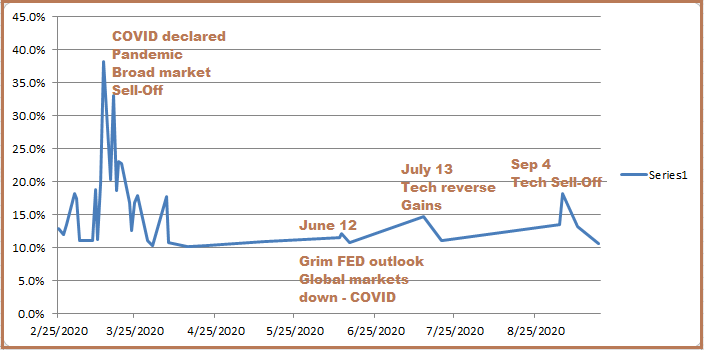
Source: Chart compiled with data from Yahoo Finance
Now, the next question is whether this will continue in October and the rest of the year.
This all comes to questioning the continuous ability of big-techs to buck the negative trend in the market by reporting promising revenue figures despite the global coronavirus outbreak.
Also, can the safety net constituted by softness in monetary policy and strong fiscal stimulus continue to shield the market against some of the dire realities which are starting to surface?
Part of the answer comes from observing the mixed economic indicators with some economists saying that the initial rebound has turned into a grind. Also, there is some uncertainty as to the amount of fiscal stimulus required and whether in an election year, Democrats and Republicans will have the willingness to align themselves around a single objective.
More importantly, there is strong momentum created by high investors’ optimism about the future earnings prospects of some stocks like Amazon (AMZN), Tesla (TSLA) and Zoom Video Communications (ZM), companies with individual P/E ratios of well above QQQ’s 24.
This means that if these companies do not meet analysts’ expectations, they could face a steep decline. Now, together with some other adverse economic news, the result can be another downside.
Therefore, the catalysts are present for a tech correction, not a sell-off and this means gains for the SQQQ.
Now, this ability of SQQQ to perform in either a bull or a bear market is in contrast to QQQ which is only a good investment tool in the event of a bull market.
Also, in contrast with QQQ which is re-balanced on a quarterly basis, SQQQ as one of the most inverse and leveraged investment products available in the stock market today is designed to provide exposure on a daily basis, not over long-time horizons.
This is the reason why a more detailed look at the risks in trading the SQQQ is warranted.
Risks and alternatives
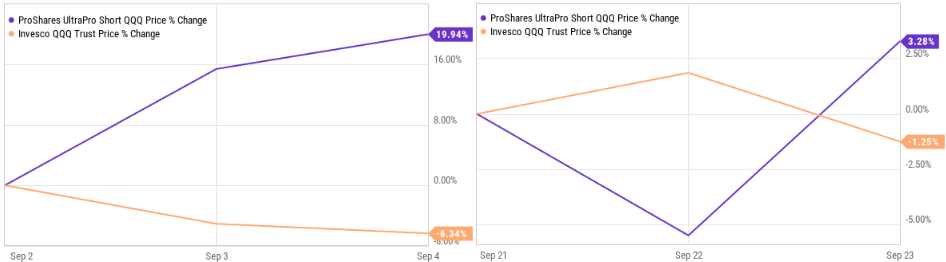
In case we take the example of September 3rd when QQQ dropped by 5%, SQQQ provided 15% returns to investors before fees and expenses.
Moreover, this was the case even the next day (September 4th) as the QQQ’s downtrend continued.
However, it is not always the case that QQQ falls for two consecutive days or over a longer term and I use both ETFs’ price evolution on September 21st to 23rd to illustrate my point.
Figure 5: SQQQ and QQQ evolution from September 2nd to 4th and 21st to 23rd, respectively.
Source: YCharts
QQQ rose on September 22 and fell the next day for an overall decline of -1.25%. However, SQQQ did not undergo a 3.75% upside as per its theoretical specifications but only a 3.28% rise.
The reason for this is the leverage which signifies that the average returns on leveraged funds during volatility tend to underperform the multiplier (3x).
This underperformance is worsened by more volatility on a day-to-day basis and this is called compounding risk.
Therefore, due to the compounding of daily returns, amounts gained over periods of more than one day are likely to less than the 3x multiplier.
This difference in amount is more pronounced for ETFs with larger and inverse multipliers like the SQQQ and this is the reason for which it is better for investors who are more adepts of passive investing to stick to other less aggressive inverse index followers such as the ProShares Short QQQ (PSQ).
The latter is an inverse 1x follower of the Nasdaq-100.
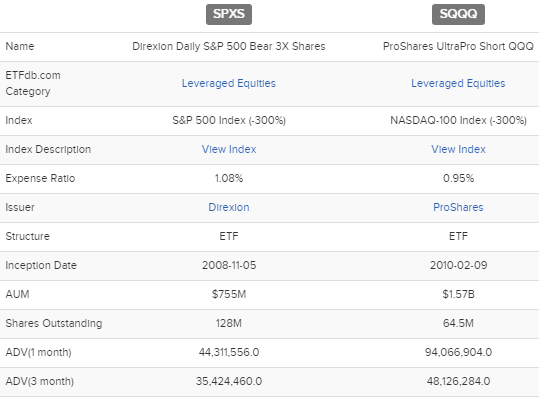
Exploring further, for traders and investors with a more aggressive profile, there is also the Direxion Daily S&P 500 Bear 3x Shares ETF (SPXS) which also provides 3x inverse exposure. However, SPXS basically inversely follows the broader S&P 500 including big financial and pharmaceutical names.
Figure 6: Comparing the SQQQ with the SPXS.
Source: etf.com
Also, the expense ratio for SPXS is higher and average daily volumes traded are lower than SQQQ and the latter offers a dividend of 7.51% compared to the former’s 1.91%.
This said, both of these two leverage inverse ETF tools are commonly used for hedging different types of portfolios.
Valuations and Key takeaways
First, it must be clear in the minds of investors that this is a valuation exercise aimed at trading and not for holding SQQQ.
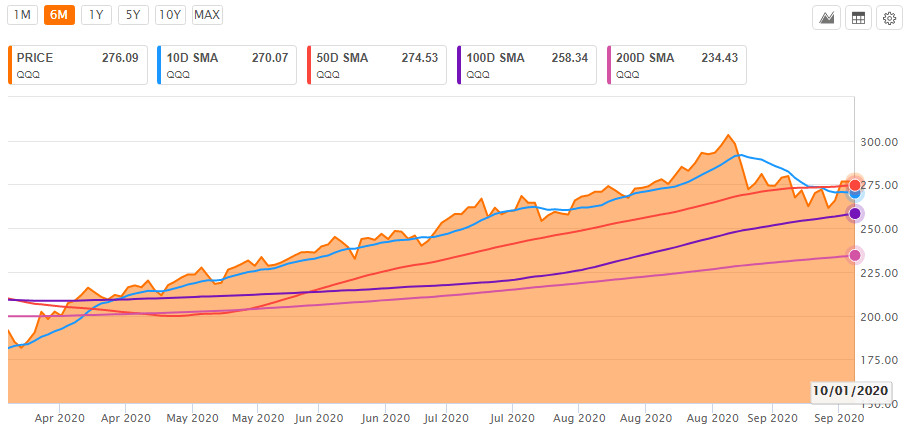
Second, it is useful to take a glance at the momentum indicators for QQQ in order to get some confirmation about price trends in the technology space.
Figure 7: Simple moving averages for QQQ.
Source: Seeking Alpha
After the September downside, QQQ’s share price does not currently look to be following a consistent uptrend. The reason is that while the ETF’s price is above the 10-day SMA, the latter has not yet crossed over the 50-Day SMA.
Also, with QQQ’s share price still not comfortably higher above the 50-Day SMA, it may still go down.
Interestingly, QQQ has shown resistance at $302.76.
Thus, one smart thing to do is to wait for the market to proceed to the 300-302 level before placing your buy.
In the meantime, for more aggressive traders, Friday’s COVID-related uncertainty in the White House was an 8% yielder for ProShares’ Ultrashort.
In this case, investors should remember that SQQQ trades rather briskly and it is important to monitor holdings as frequently as daily. Thus, the ETF should be viewed more as a trading tool with investors being willing to accept short-term losses instead of undergoing longer-term underperformance as a result of compounding risks.
As a matter of fact, on observing the longer term share price performance of SQQQ, investors will notice that there is a net downtrend. It is for this reason that ProShares regularly performs reverse stock splits, with the last such action carried out on August 18 (on a 1-for-5 basis) being the fifth one since 2012.
This reverse split addresses the problem of the shares having fallen to a lower per-share price point than desired by ProShares.
On a more positive note, the high volumes of SQQQ traded daily despite the steep expense ratio show the possibility of making solid gains of above 10% within one day.
Moreover, a 1x inverse return as derived by trading PSQ means purchasing more shares, three times more to be exact to accomplish the same results as a 3x inverse ETF like SQQQ.
For example, someone with a $90K portfolio may consider having a theoretical $90K equivalent of PSQ at $16 each or about 5600 shares. On the other hand, he just needs to buy 1300 shares of SQQQ at $22 each to benefit from the same level of protection.
Hence, SQQQ is more suitable for the smaller investor with less upfront capital but who after having seen progressive gains from tech stocks for some time, has become more risk-averse and wants to protect hard-earned gains.
Also, the fact that daily trade volumes for SQQQ is more than ten times than PSQ reveals that despite all the compounding or decay concerns, it can be a more effective tool when used appropriately.
Looking back, the over-performance of SQQQ at the beginning of September, which was more than 3 times the underperformance of the QQQ over a two-day period, shows that compounding can actually help to have better returns in a trending environment.
Now, a few words of wisdom concerning hedging.
There is no need to go to the extent of having 100% portfolio coverage with hedging as protection against a downside can take other forms like sector, asset class or even country-level diversification.
Also, by choosing the ETF approach, albeit an inverse one, small investors do not have to bother about exploring other more “sophisticated” solutions like put options or selling calls.
My point here is not to discredit other hedging options but more to share my own experience as a small investor.
Enjoyed this article? Sign up for our newsletter to receive regular insights and stay connected.