
Summary
- The large stock build from 2025 Q3 to 2026 Q1 leads to falling Brent Crude prices through 2026 Q1; oil prices then stabilize at around $55/b in 2026.
- The EIA expects OPEC+ will produce at about 1.5 Mb/d below their target in 2026.
- Refinery margin (profits) are expected to increase in 2025 and 2026 for both gasoline and diesel fuel.
- Natural gas prices for residential consumers are expected to rise only by 2% this winter to $13.80/MCF.
A summary in chart form.
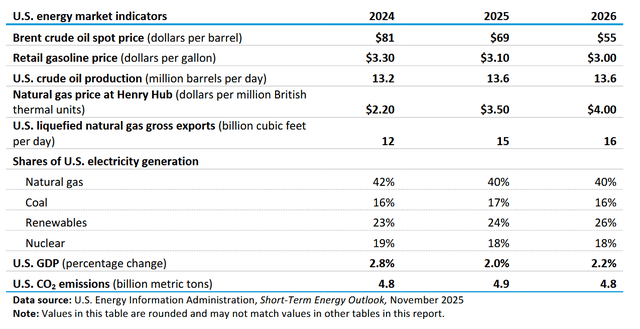
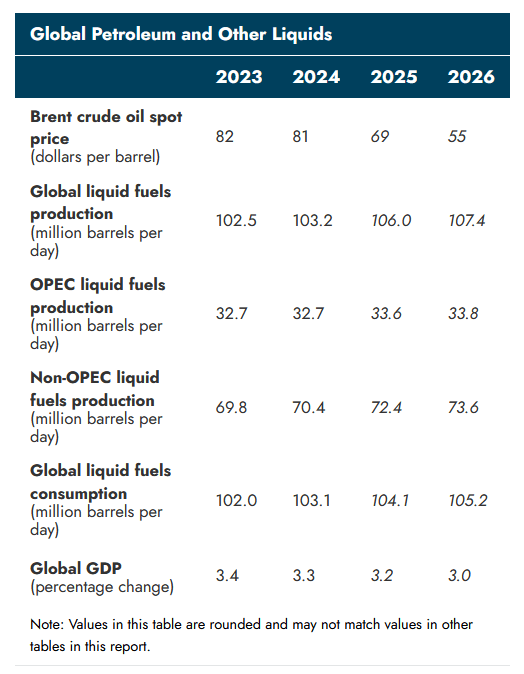
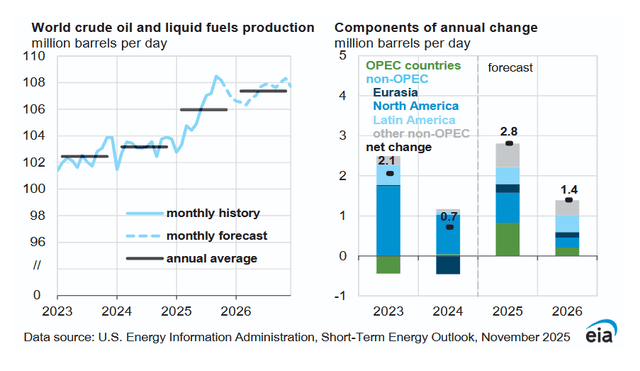
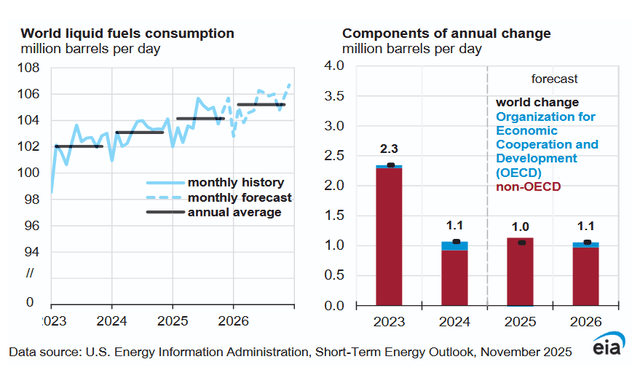
Higher Global GDP growth is expected compared to last month’s STEO in 2025 and 2026, up by 0.1% for both years. This raises Global liquids fuel consumption by 0.1 Mb/d compared to the previous STEO in both 2025 and 2026. OPEC liquids fuel output increases by 0.1 Mb/d in 2025 and 2026 compared to last month. Non-OPEC liquid fuel is revised lower by 0.1 Mb/d in 2024, and the expected output in 2026 increases by 0.1 Mb/d compared to last month.
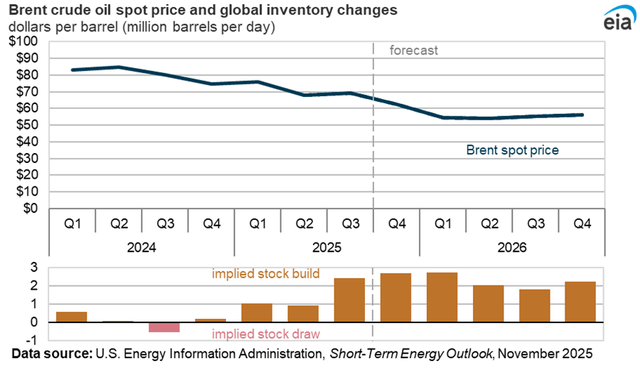
The large stock build from 2025 Q3 to 2026 Q1 leads to falling Brent Crude prices through 2026 Q1; oil prices then stabilize at around $55/b in 2026.
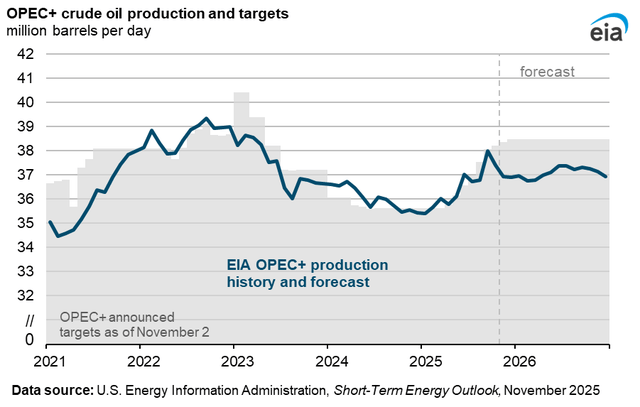
The EIA expects OPEC+ will produce at about 1.5 Mb/d below their target in 2026.
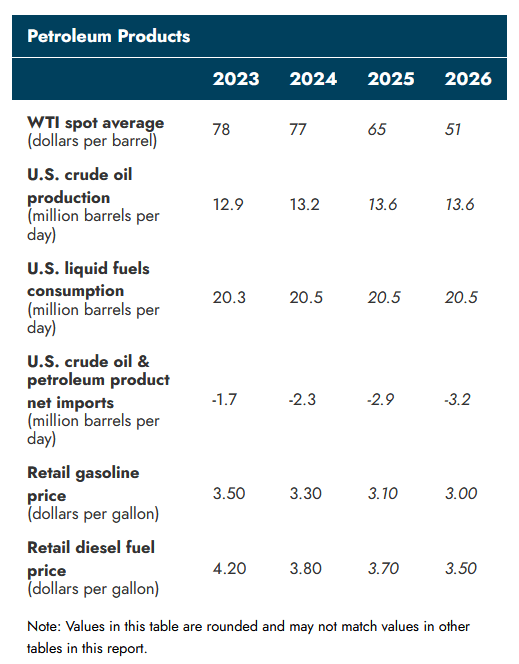
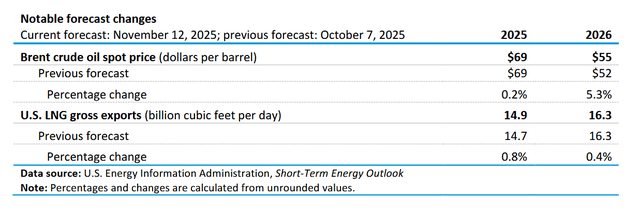
WTI oil price was revised $2/b higher in 2026 than last month’s STEO.
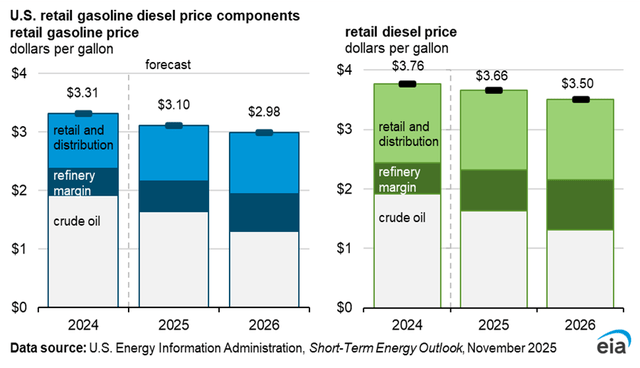
Refinery margin (profits) are expected to increase in 2025 and 2026 for both gasoline and diesel fuel.
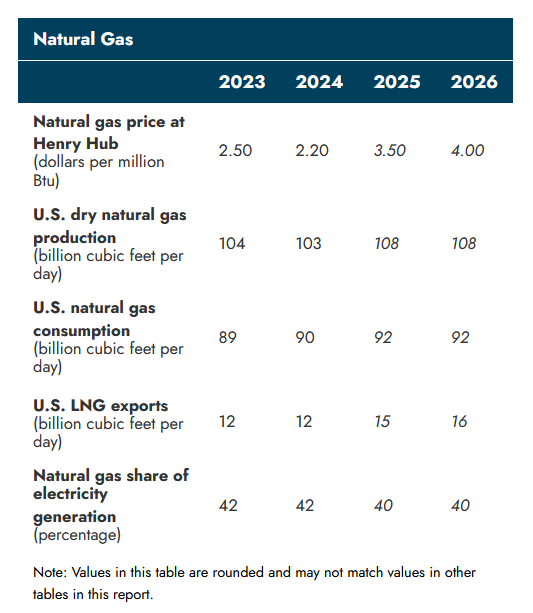
The price of natural gas at Henry Hub was revised higher by 10 cents per MCF in both 2025 and 2026 compared to last month. Natural gas output was also revised higher in 2025 and 2026 by 1 BCF/d compared to last month’s STEO.
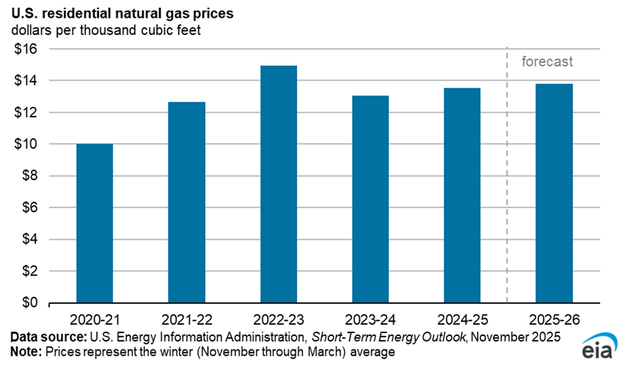
Natural gas prices for residential consumers are expected to rise only by 2% this winter to $13.80/MCF.
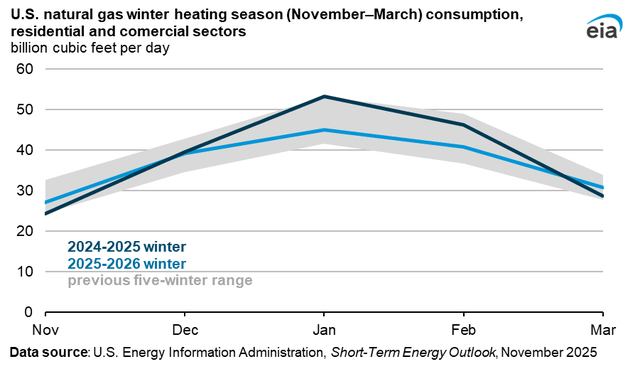
A warmer winter is expected in 2025/2026, leading to lower consumption of natural gas compared to last winter.
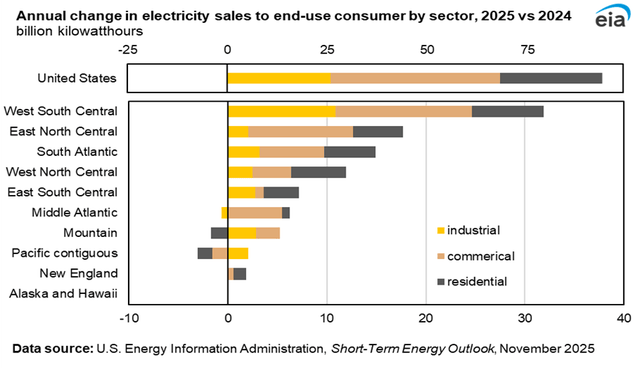
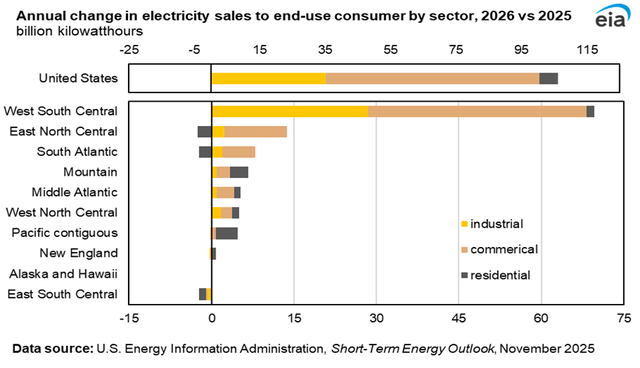
Growth in electric power consumption is concentrated in the West South Central Region (Texas, Oklahoma, Louisiana, and Arkansas), with 34% of all US growth coming from this region in 2025 and 66% in 2026. For the US as a whole, electricity sales increase by 2.4% in 2025 and by 2.6% in 2026.
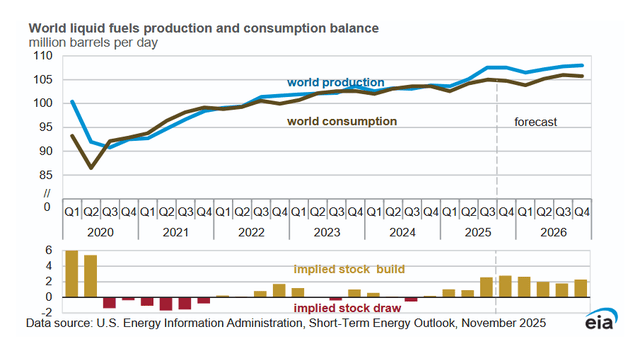
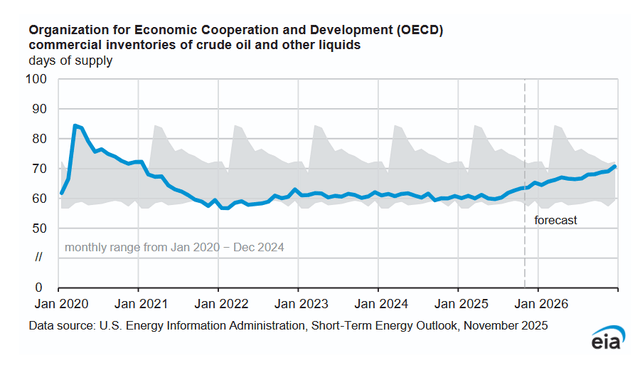
OECD stocks rise to the early 2021 level by the end of 2026.
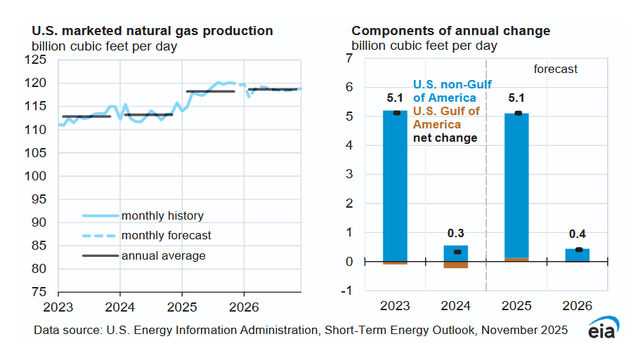
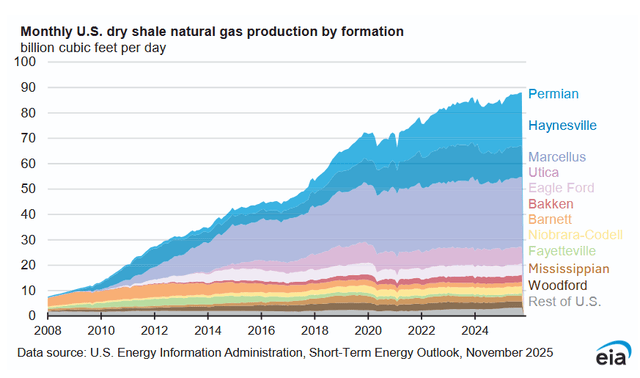
US natural gas output jumps by 5.1 BCF/d in 2025 (4.4%).
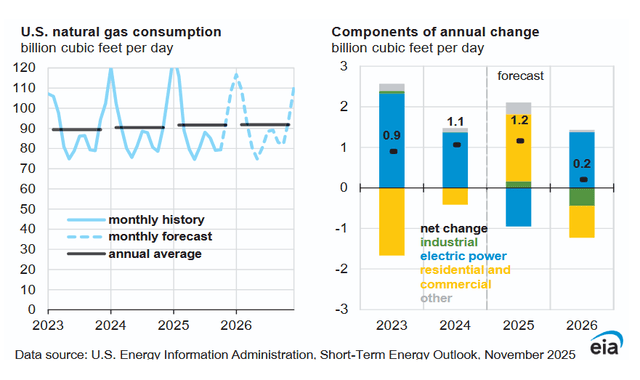
Consumption of natural gas rises by 1.3% in 2025 and is roughly flat in 2026.
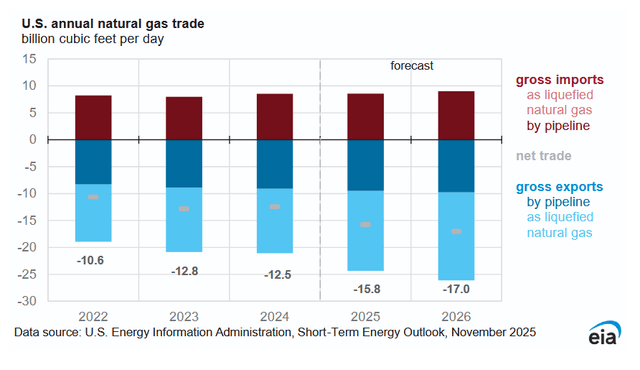
Most of the increased natural gas output is exported, with exports increasing by 4.5 BCF/d from 2024 to 2026, an increase of 36% over 2 years (a 26.4% increase in 2025 and a 7.6% increase in 2026 natural gas exports).
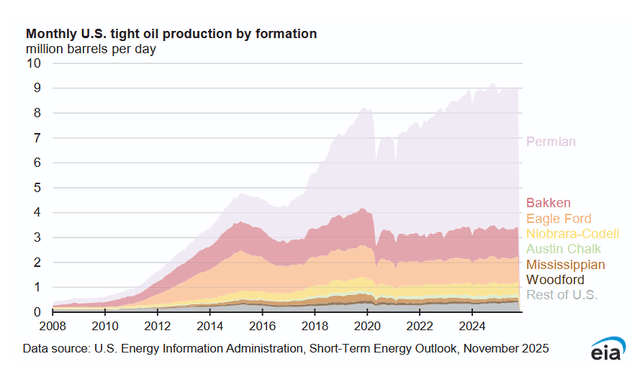
For the past 12 months, tight oil output has been pretty flat.
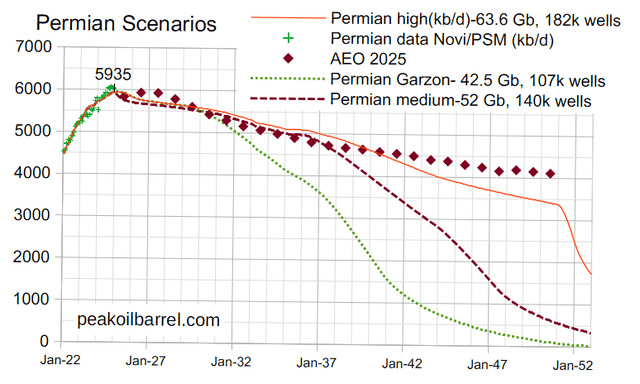
In the Permian scenarios above, I try to match the AEO 2025 reference case for the Southwest region with non-Permian C+C and Permian conventional oil deducted (about 800 kb/d for 2024 to 2050). The Permian Garzon case uses analysis by Jorge Garzon from Novi Labs on Tier 1 and Tier 2 remaining locations in the Permian Basin to arrive at a total of 107 thousand wells. For that scenario, low oil prices are assumed (under $70/b in 2025$) so that lower tier locations are not profitable to drill and complete. The medium scenario assumes higher oil prices, up to $85/b in 2025$ so that some tier 3 and lower wells are completed (about 33 thousand of them). The high scenario assumes even higher prices (perhaps up to $120/b in 2025$) with another 42 thousand wells more than the medium scenario completed. Note that about 55 thousand wells had been completed by June 30, 2025.
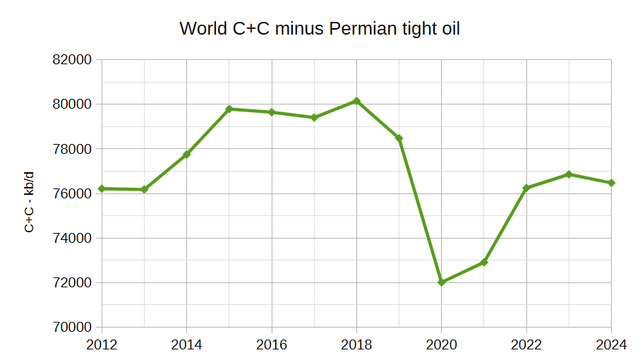
In the grand scheme, there are about 1500 Gb of remaining C+C global resources, so the difference of 21 Gb between the low and high Permian scenarios is small, less than 1.5% of remaining crude oil resources. Note that from 2012 to 2024, about 95% of the increase in World C+C came from Permian Basin tight oil (5080 of 5341 kb/d of the World C+C increase from 2012 to 2024). The chart below shows World C+C minus Permian tight oil from 2012 to 2024, which increased by 261 kb/d over that period, or an annual average rate of 22 kb/d.
Enjoyed this article? Sign up for our newsletter to receive regular insights and stay connected.