
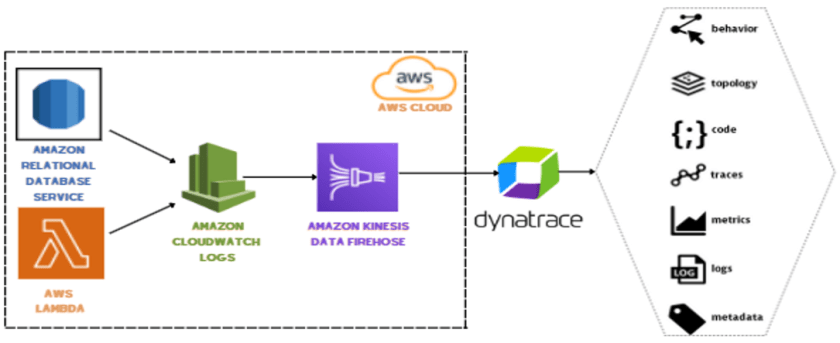
The practical value here is not novelty in log analysis but a lower-friction delivery path from AWS telemetry into a monitoring system that can act on it quickly. Kinesis Data Firehose functions as the managed transport layer, auto-scaling throughput and using an HTTP endpoint destination to hand off CloudWatch logs and metrics without custom ingestion code. That matters to practitioners because it reduces integration overhead, shortens time to visibility, and keeps the operational model aligned with existing AWS logging workflows rather than introducing a separate pipeline.
The mechanism is straightforward: create a Firehose delivery stream with direct PUT, point it at the vendor HTTP endpoint, supply the tenant URL and token, and optionally back up payloads to S3. Once configured, the destination can begin processing data within minutes of CloudWatch generation, while the observability platform exposes the stream under AWS supporting services and lets operators select which metrics to surface. The practical implication is centralized correlation of logs, metrics, events, and traces without stitching together multiple collectors or exporters.
The limitations are operational, not conceptual. The setup depends on correct endpoint selection, valid token scope, and an updated IAM policy, and the post explicitly notes that misconfiguration shows up as empty data or destination errors. That means the integration is only as reliable as its permissions and routing hygiene, and the promised simplicity can mask real troubleshooting work when data fails to arrive. For practitioners, the significance is clear: this is an integration efficiency play, not a substitute for disciplined access control and validation.
Prerequisites
For this walkthrough, you should have the following prerequisites:- AWS account.
- Access to the CloudWatch and Kinesis Data Firehose with permissions to manage HTTP endpoints.
- Dynatrace Intelligent Observability Platform account, or get a free 15 day trial here.
- Dynatrace version 1.182+.
- An updated AWS monitoring policy to include the additional AWS services.
To update the AWS Identity and Access Management (IAM) policy, use the JSON in the link above, containing the monitoring policy (permissions) for all supporting services. - Dynatrace API token: create token with the following permission and keep readily available in a notepad.
 Figure 1 – Dynatrace API Token
How it works
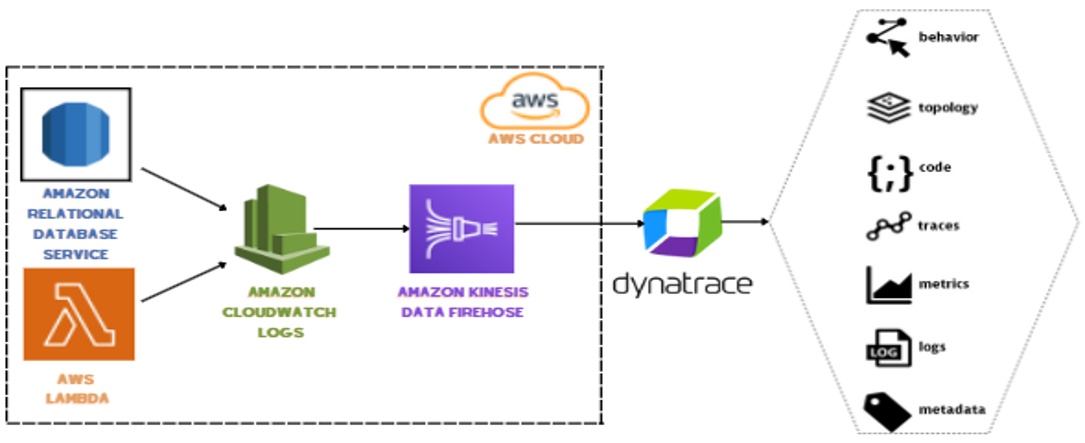 Figure 2 – Amazon Kinesis Data Firehose HTTP endpoint delivery
Setup instructions
To add a service to monitoring, follow these steps:- In the Dynatrace menu, go to Settings > Cloud and virtualization, and select AWS.
- On the AWS overview page, scroll down and select the desired AWS instance. Select the Edit button.
- Scroll down and select Add service. Choose the service name from the drop-down, and select Add service.
- Select Save changes.
- Log in to the AWS console and type “Kinesis” in the text search bar. Select Kinesis
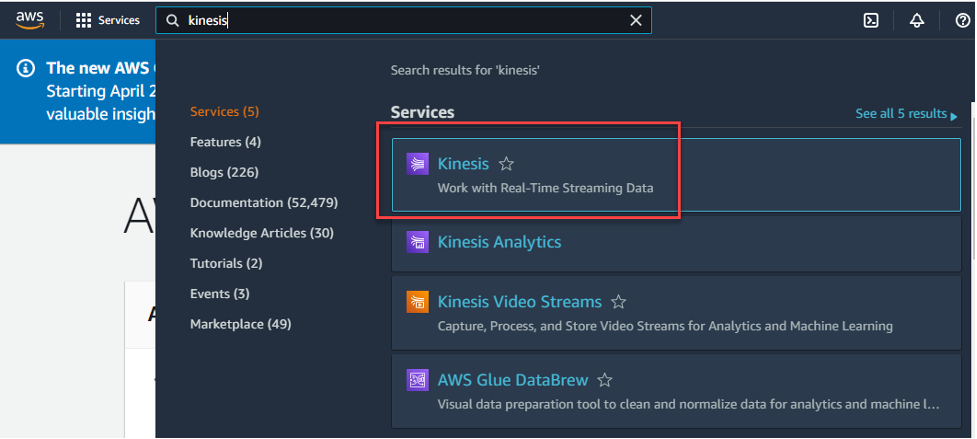
Figure 3 – AWS Console
- On the Amazon Kinesis services page, select the radio button for Kinesis Data Firehose and select the Create delivery stream button.
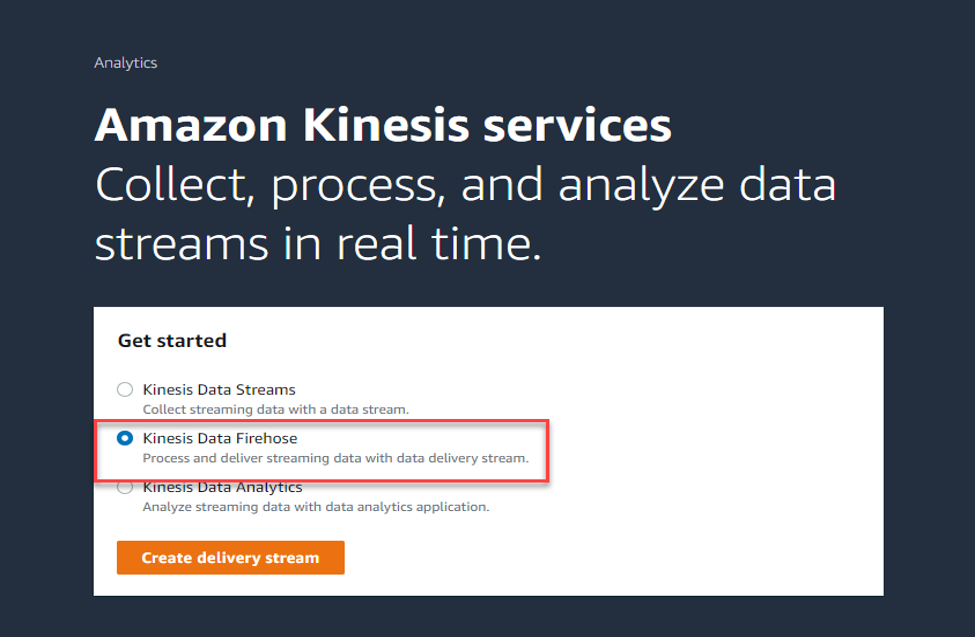
Figure 4 – Amazon Kinesis
- Choose the “Direct PUT” from the drop down, and from Destination drop down, choose “Dynatrace”.
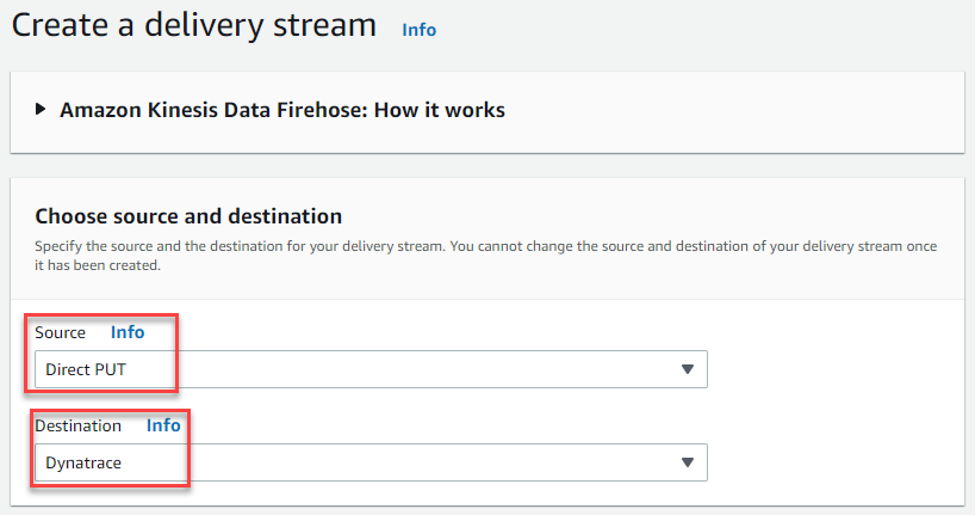
Figure 5 – Amazon Kinesis Data Firehose
- Delivery stream name – Give your stream a new name, for example: – “KFH-StreamToDynatrace”
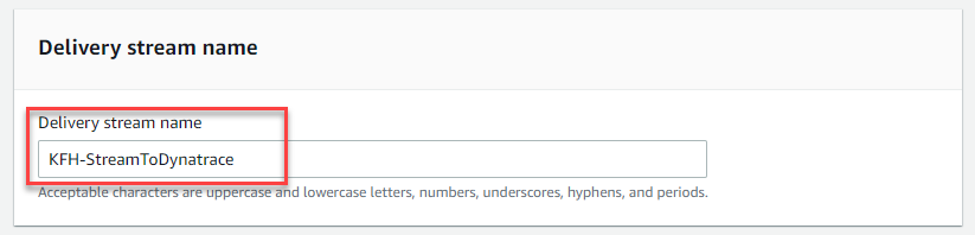
Figure 6 – Delivery stream name
- In the section “Destination settings”:
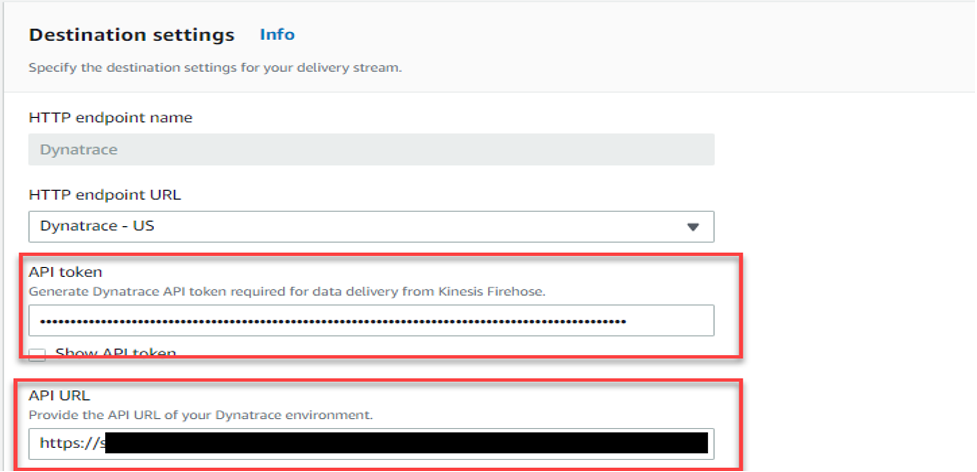
Figure 7 – Destination settings
- HTTP endpoint name – “Dynatrace”.
- HTTP endpoint URL – From the drop down, select “Dynatrace – US”.
- API token – Enter Dynatrace API TOKEN created in the prerequisite section.
- API URL – enter the Dynatrace URL for your tenant, for example: https://xxxxx.live.dynatrace.com
- Back Up Settings – Either select an existing S3 bucket or create a new one and add details and select the Create delivery stream button.
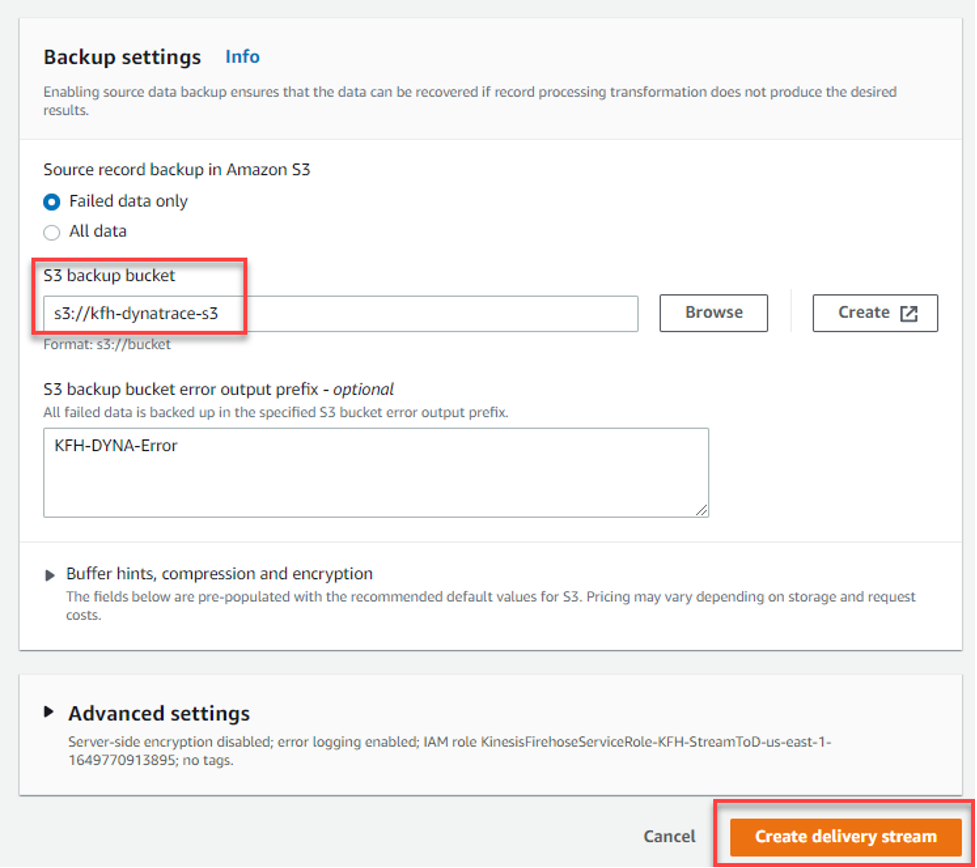
Figure 8 – Backup settings
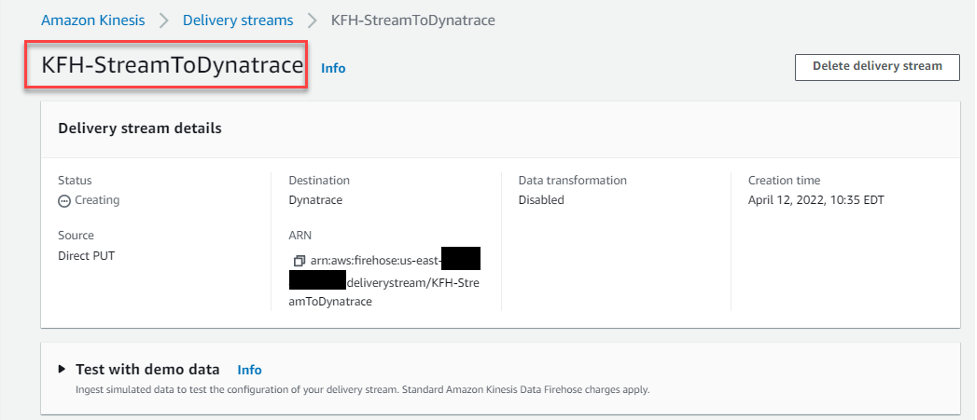
Figure 9 – Amazon Kinesis Data Firehose
The Dynatrace Experience
Once the initial setups are completed in both Dynatrace and the AWS Console, follow these steps to visualize your new KHF stream data in the Dynatrace console.- Log in to the Dynatrace Console, and on the left side menu expand the “infrastructure” section, and select “AWS”
- From the screen, select the AWS account that you want to add the KFH stream to.
- Next, you’ll see a virtualization of your AWS assets for the account selected. Select the box marked “Supporting Services”.
- Next, press the “Configure services” button.
- Next, select “Add service”.
- From the drop down, select “Kinesis Data Firehose”.
- Next, select the “Add metric” button, and select the metrics that you want to see for this stream. Dynatrace has a comprehensive list of metrics that can be selected from the UI. The list can be found in this link.
Troubleshooting
- After configuration, load to the new KFH stream no data in the Dynatrace Console.
- Check the Error Logs tab check to make sure that the Destination URL is correct for the Dynatrace Tenant.
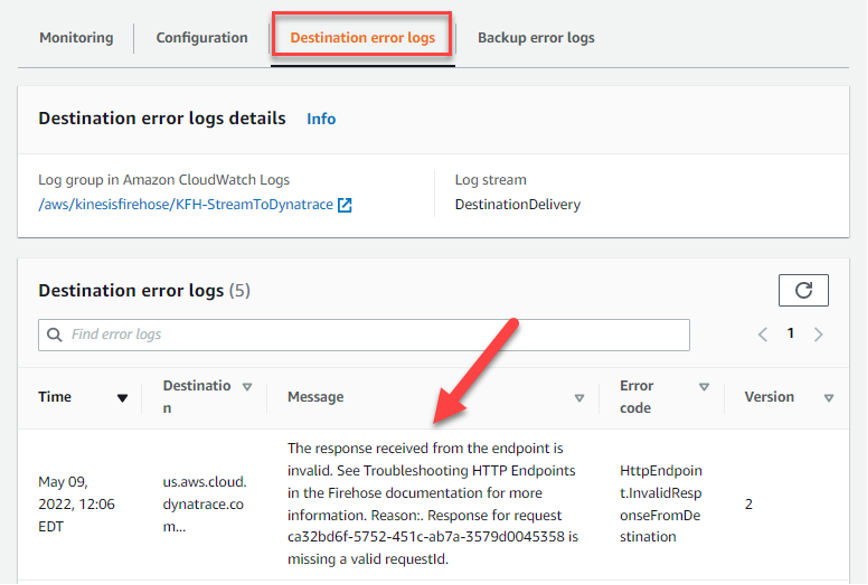
Figure 10 – Destination error logs
- Invalid or misconfigured Dynatrace API token or scope isn’t properly set.
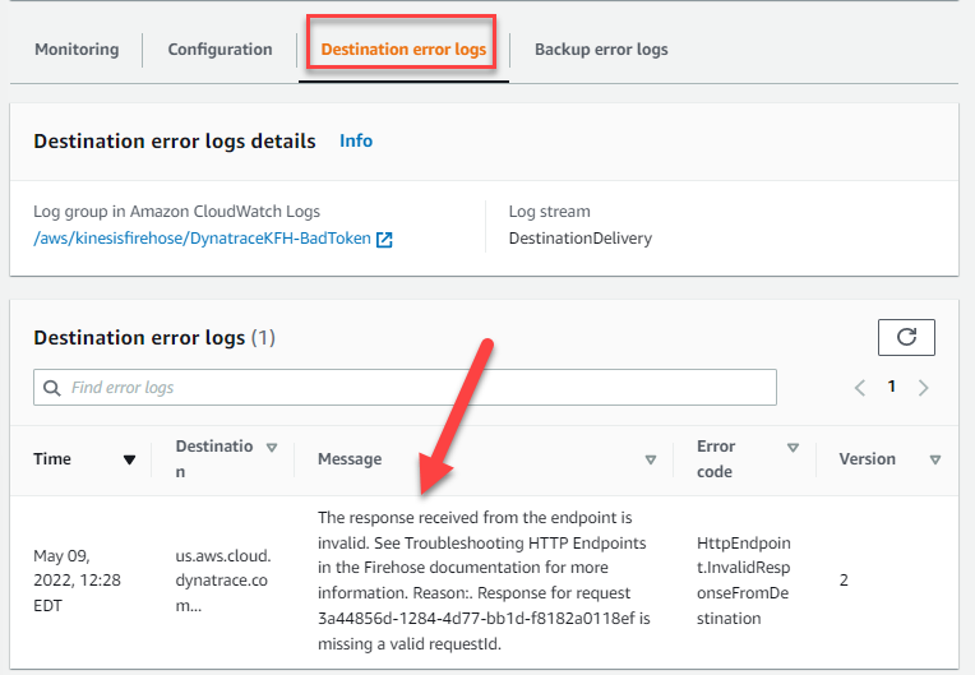
Figure 11 – Destination error logs
Conclusion
In this post, we demonstrate the Kinesis Data Firehose and related Dynatrace integration. In addition, engineers can use CloudWatch Metrics to explore their production systems alongside events in Dynatrace. This provides a seamless, current view of your system (from logs to events and traces) in a single data store. To learn more about CloudWatch Service, see the Amazon CloudWatch home page. If you have any questions, post them on the AWS CloudWatch service forum. If you haven’t yet signed up for Dynatrace, then you can try out Kinesis Data Firehose with Dynatrace with a free Dynatrace trial.About the Authors
Erick Leon is a Technical Alliances Sr. Manager at Dynatrace, Observability Practice Architect, and Customer Advocate. He promotes strong technical integrations with a focus on AWS. With over 15 years as a Dynatrace customer, his real-world experiences and lessons learned bring valuable insights into the Dynatrace Intelligent Observability Platform. Shashiraj Jeripotula (Raj) is a San Francisco-based Sr. Partner Solutions Architect at AWS. He works with various independent software vendors (ISVs), and partners who specialize in cloud management tools and DevOps to develop joint solutions and accelerate cloud adoption on AWS.Enjoyed this article? Sign up for our newsletter to receive regular insights and stay connected.