
The meaningful shift is that Azure Firewall is moving from coarse observability to diagnostics that can isolate whether the firewall, the route path, or the traffic profile is responsible for user-facing degradation. Latency Probe, Flow Trace, and Top Flows are not feature flourishes; they are operational instruments for administrators who need to separate service health from application behavior. In practice, that matters because misattribution wastes time, and firewall teams need evidence before changing rules or routing.
Latency Probe focuses on the firewall’s own average delay, using Pingmesh-based measurement to indicate whether the service itself is under pressure from CPU, throughput, or network conditions. Flow Trace extends packet history beyond the initial SYN, adding handshake-state visibility such as SYN-ACK, FIN, RST, and INVALID so administrators can spot drops or asymmetric return paths. Top Flows highlights bandwidth-heavy connections, helping teams identify unexpected traffic that may crowd out other flows and affect performance.
The limits are as important as the gains. Latency Probe does not reveal end-to-end application latency or packet-level delay, so it cannot replace broader network tracing. Flow Trace and Top Flows are preview capabilities, which means operational maturity and long-term behavior still need scrutiny before they become the basis for strict process changes. Even so, the practical value is clear: better triage, faster fault isolation, and fewer speculative changes when network performance problems appear.
IT security administrators are often called on to troubleshoot network issues. For instance, a critical application may exhibit latency or disconnections, frustrating end users. These issues may be caused by a recent routing update or changes in security. In some cases, the cause may be due to a sudden burst in network traffic—overwhelming the network resources.
Microsoft Azure Firewall now offers new logging and metric enhancements designed to increase visibility and provide more insights into traffic processed by the firewall. IT security administrators may use a combination of the following to root cause application performance issues:
o Latency Probe metric is now in preview.
o Flow Trace Log is now in preview.
o Top Flows Log is now in preview.
Azure Firewall is a cloud-native firewall as a service offering that enables customers to centrally govern and log all their traffic flows using a DevOps approach. The service supports both application and network-level filtering rules and is integrated with the Microsoft Defender Threat Intelligence feed to filter known malicious IP addresses and domains. Azure Firewall is highly available with built-in auto-scaling.
Latency Probe metric—now in preview
In a network infrastructure, one may observe increases in latency depending on various factors. The ability to monitor the latency of the firewall is essential for proactively engaging in any potential issues with traffic or services in the infrastructure.
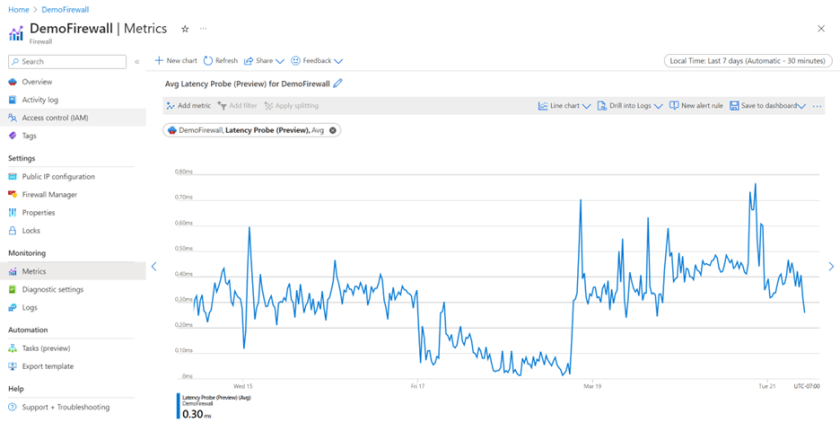
The Latency Probe metric is designed to measure the overall latency of Azure Firewall and provide insight into the health of the service. IT administrators can use the metric for monitoring and alerting if there is observable latency and diagnosing if the Azure Firewall is the cause of latency in a network.
In the case that Azure Firewall is experiencing latency, this can be due to various reasons, such as high CPU utilization, traffic throughput, or networking issues. As an important note, this tool is powered by Pingmesh technology, which means that the metric measures the average latency of the firewall itself. The metric does not measure end-to-end latency or the latency of individual packets.

Figure 1: Dashboard view of healthy firewall latency measured by the Latency Probe (Preview) metric.
Flow Trace logs—now in preview
Azure Firewall logging provides logs for various traffic—such as network, application, and threat intelligence traffic. Today, these logs show traffic through the firewall in the first attempt at a Transmission Control Protocol (TCP) connection, also known as the SYN packet. However, this fails to show the full journey of the packet in the TCP handshake. The ability to monitor and track every packet through the firewall is paramount for identifying packet drops or asymmetric routes.
To dive further into an asymmetric routing example, Azure Firewall—as a stateful firewall—maintains state connections and automatically and dynamically allows traffic to successfully come back to the firewall. However, asymmetric routing can occur when a packet takes one path to the destination through the firewall and takes a different path when attempting to return to the source. This can be due to user misconfiguration, such as adding an unnecessary route in the path of the firewall.
As a result, one can verify if a packet has successfully flowed through the firewall or if there is asymmetric routing by viewing the additional TCP handshake logs in Flow Trace.
To do so, you can monitor network logs to view the first SYN packet and click “enable Flow Trace” to see the additional flags for verification:
o SYN-ACK
o FIN
o FIN-ACK
o RST
o INVALID
By adding these additional flags in Flow Trace logs, IT administrators can now see the return packet, if there was a failed connection, or an unrecognized packet. To enable these logs, please read the documentation linked below.

Figure 2: Flow Trace logs displaying SYN-ACK and FIN packets.
Top Flows—now in preview
Today, Microsoft Azure Firewall Standard can support up to 30 Gbps and Azure Firewall Premium can support up to 100 Gbps of traffic processing. However, in any case, sometimes traffic flows can either be unintentionally or intentionally “heavy” depending on the size, duration, and other factors of the packets. Since these flows can potentially impact other flows and the processing of the firewall, it’s important to monitor these traffic flows, to ensure that the firewall can perform optimally.
The Top Flows log—or industry-known as Fat Flows—log shows the top connections that are contributing to the highest bandwidth in a given time frame through the firewall.
This visibility provides the following benefits for IT administrators:
o Identifying the top traffic flows traversing through the firewall.
o Identifying any unexpected or anomaly traffic.
o Deciding what traffic should be allowed or denied, based on results and goals.
To enable these logs, please read the documentation linked below.

Figure 3: Top Flow logs displaying traffic with the top flow rates.
Next steps
For more information on Azure Firewall and everything we covered in this blog post, see the following resources:
· Azure Firewall documentation.
· Azure Firewall Manager documentation.
Enjoyed this article? Sign up for our newsletter to receive regular insights and stay connected.