
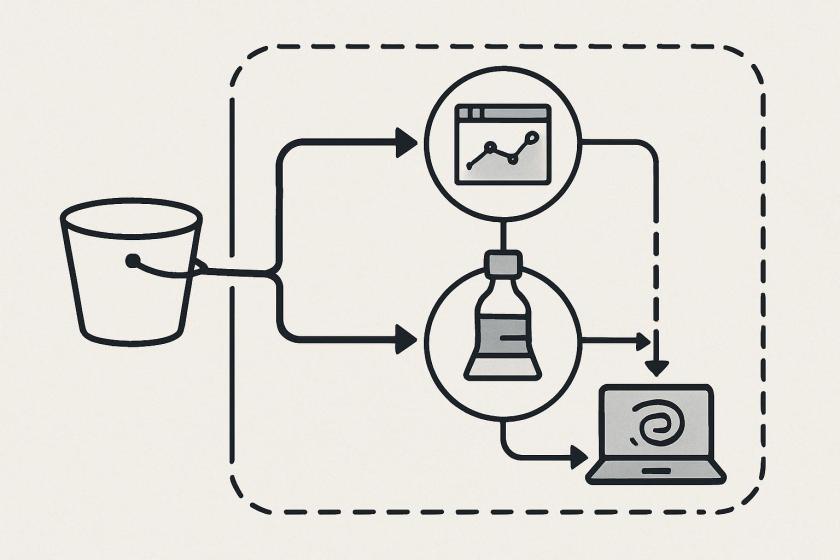
For teams already using SageMaker Unified Studio, the important shift here is not the visual canvas itself, but the orchestration boundary it creates. A workflow that combines S3 events, a Glue-backed transformation job, and a notebook step turns a formerly hand-wired sequence into a managed DAG. That reduces custom orchestration code, but it also means the pipeline now depends on how well those three execution contexts stay aligned over time.
The main architectural trade-off is between speed of assembly and control of the runtime model. Visual ETL is well suited to deterministic cleansing and column-level shaping, while the notebook layer is better for logic that is exploratory or model-oriented. That separation helps teams assign the right tool to each task, but it also introduces a governance question: where does validation live, and how do you keep notebook logic from becoming the least repeatable part of the pipeline?
Because the workflow is backed by serverless orchestration, operational responsibility shifts rather than disappears. You still need to think about task boundaries, idempotency, retries, and data handoff between steps. The S3 sensor, ETL output, catalog update, and notebook input are all coupling points; if one contract changes, the DAG can fail even when each component still works in isolation. That makes schema discipline and folder hygiene as important as the visual design.
For enterprise teams, the practical benefit is faster path-to-production with a smaller integration surface. Using a managed orchestration layer can simplify permissions, scheduling, and run visibility across analytics and ML tasks, especially when the same project must serve engineers, analysts, and data scientists. The durable value comes when the workflow is treated as an operational asset: versioned, monitored, and reviewed like any other production dependency.
Example use case
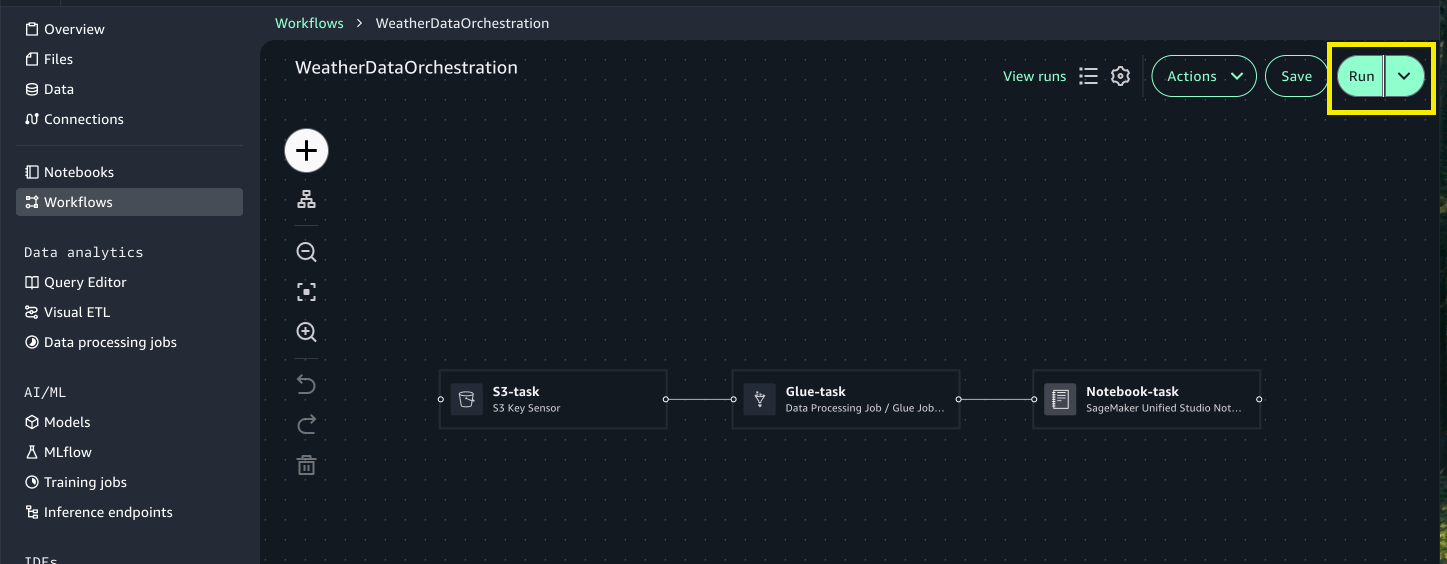
To demonstrate how SageMaker Unified Studio simplifies end-to-end workflow orchestration, let’s walk through a real-world scenario from agricultural analytics. The following diagram shows a weather data processing workflow that we will orchestrate using the visual workflow experience in SageMaker Unified Studio.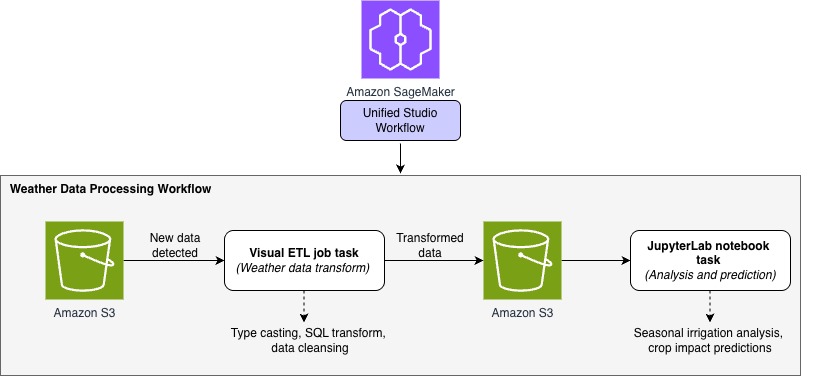 A regional agricultural extension office collects hourly weather data from multiple stations across farming communities. Their goal is to analyze this data and provide farmers with actionable insights into weather patterns and their impact on crop conditions. To achieve this, the team built a ML–powered analytics workflow using SageMaker Unified Studio to automate the processing of incoming weather data and predict irrigation needs.
In this walkthrough, we demonstrate how the visual workflow experience in Unified Studio can orchestrate an end-to-end data pipeline that:
A regional agricultural extension office collects hourly weather data from multiple stations across farming communities. Their goal is to analyze this data and provide farmers with actionable insights into weather patterns and their impact on crop conditions. To achieve this, the team built a ML–powered analytics workflow using SageMaker Unified Studio to automate the processing of incoming weather data and predict irrigation needs.
In this walkthrough, we demonstrate how the visual workflow experience in Unified Studio can orchestrate an end-to-end data pipeline that:
- Monitors and ingests hourly weather data from Amazon Simple Storage Service (Amazon S3)
- Transforms raw weather measurements using Visual ETL jobs (type casting, SQL operations, and data cleansing)
- Generates seasonal irrigation predictions and crop impact insights using JupyterLab notebooks
Prerequisites
Before you begin, complete the following steps:- Signup for an AWS account and create a user with administrative access using the setup guide.
- Setup your SageMaker Unified Studio IAM-based domain:
- Navigate to the Amazon SageMaker console and use the Region selector in the top navigation bar to choose the appropriate AWS Region.
- On the Amazon SageMaker home page, choose Get started.
- For Project data access, choose to Auto-create a new role with admin permissions.
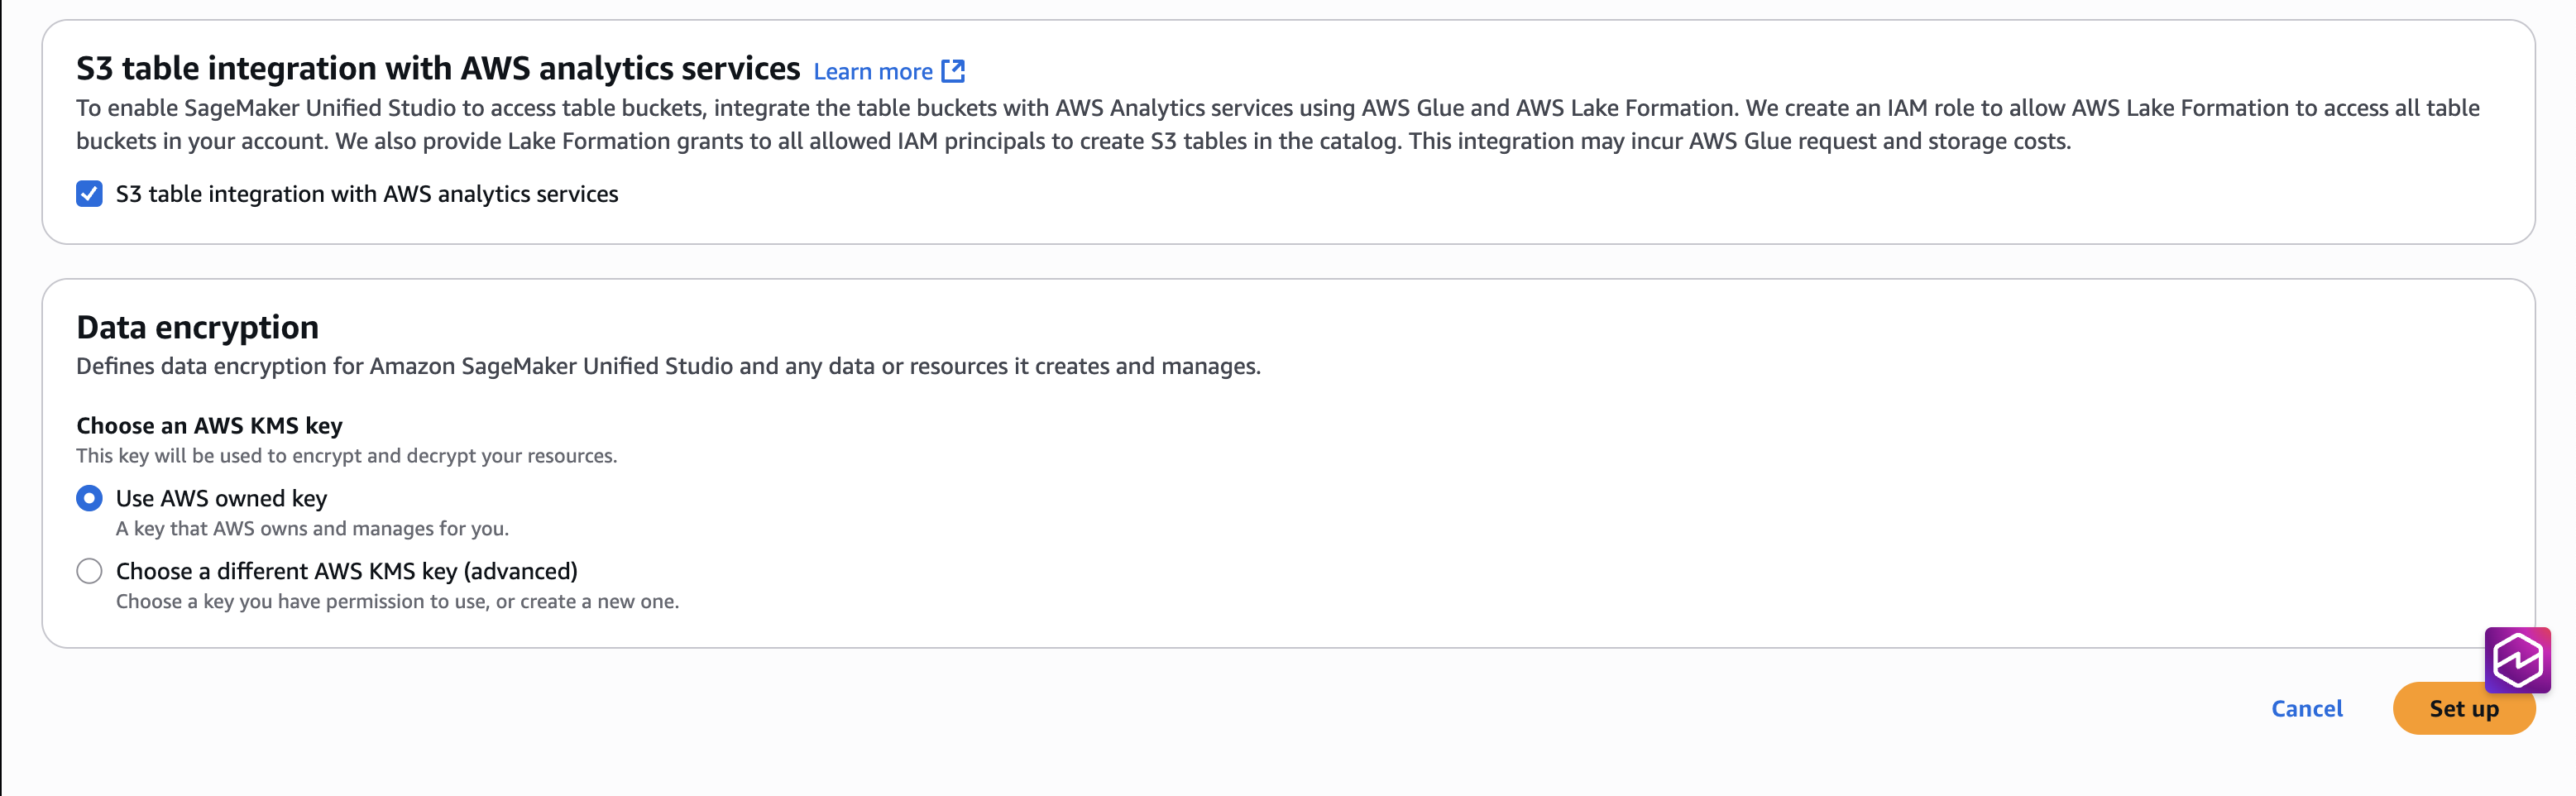
- Select the checkbox for S3 table integration with AWS Analytics services, for Data encryption choose Use AWS owned key, and then Set up.
- Go back to the Amazon SageMaker home page and choose Open to access the SageMaker Unified Studio experience.

- From the SageMaker Studio UI you can access the project in the SageMaker Unified Studio IAM-based domain. This project curates all assets accessible through the designated Execution IAM role.
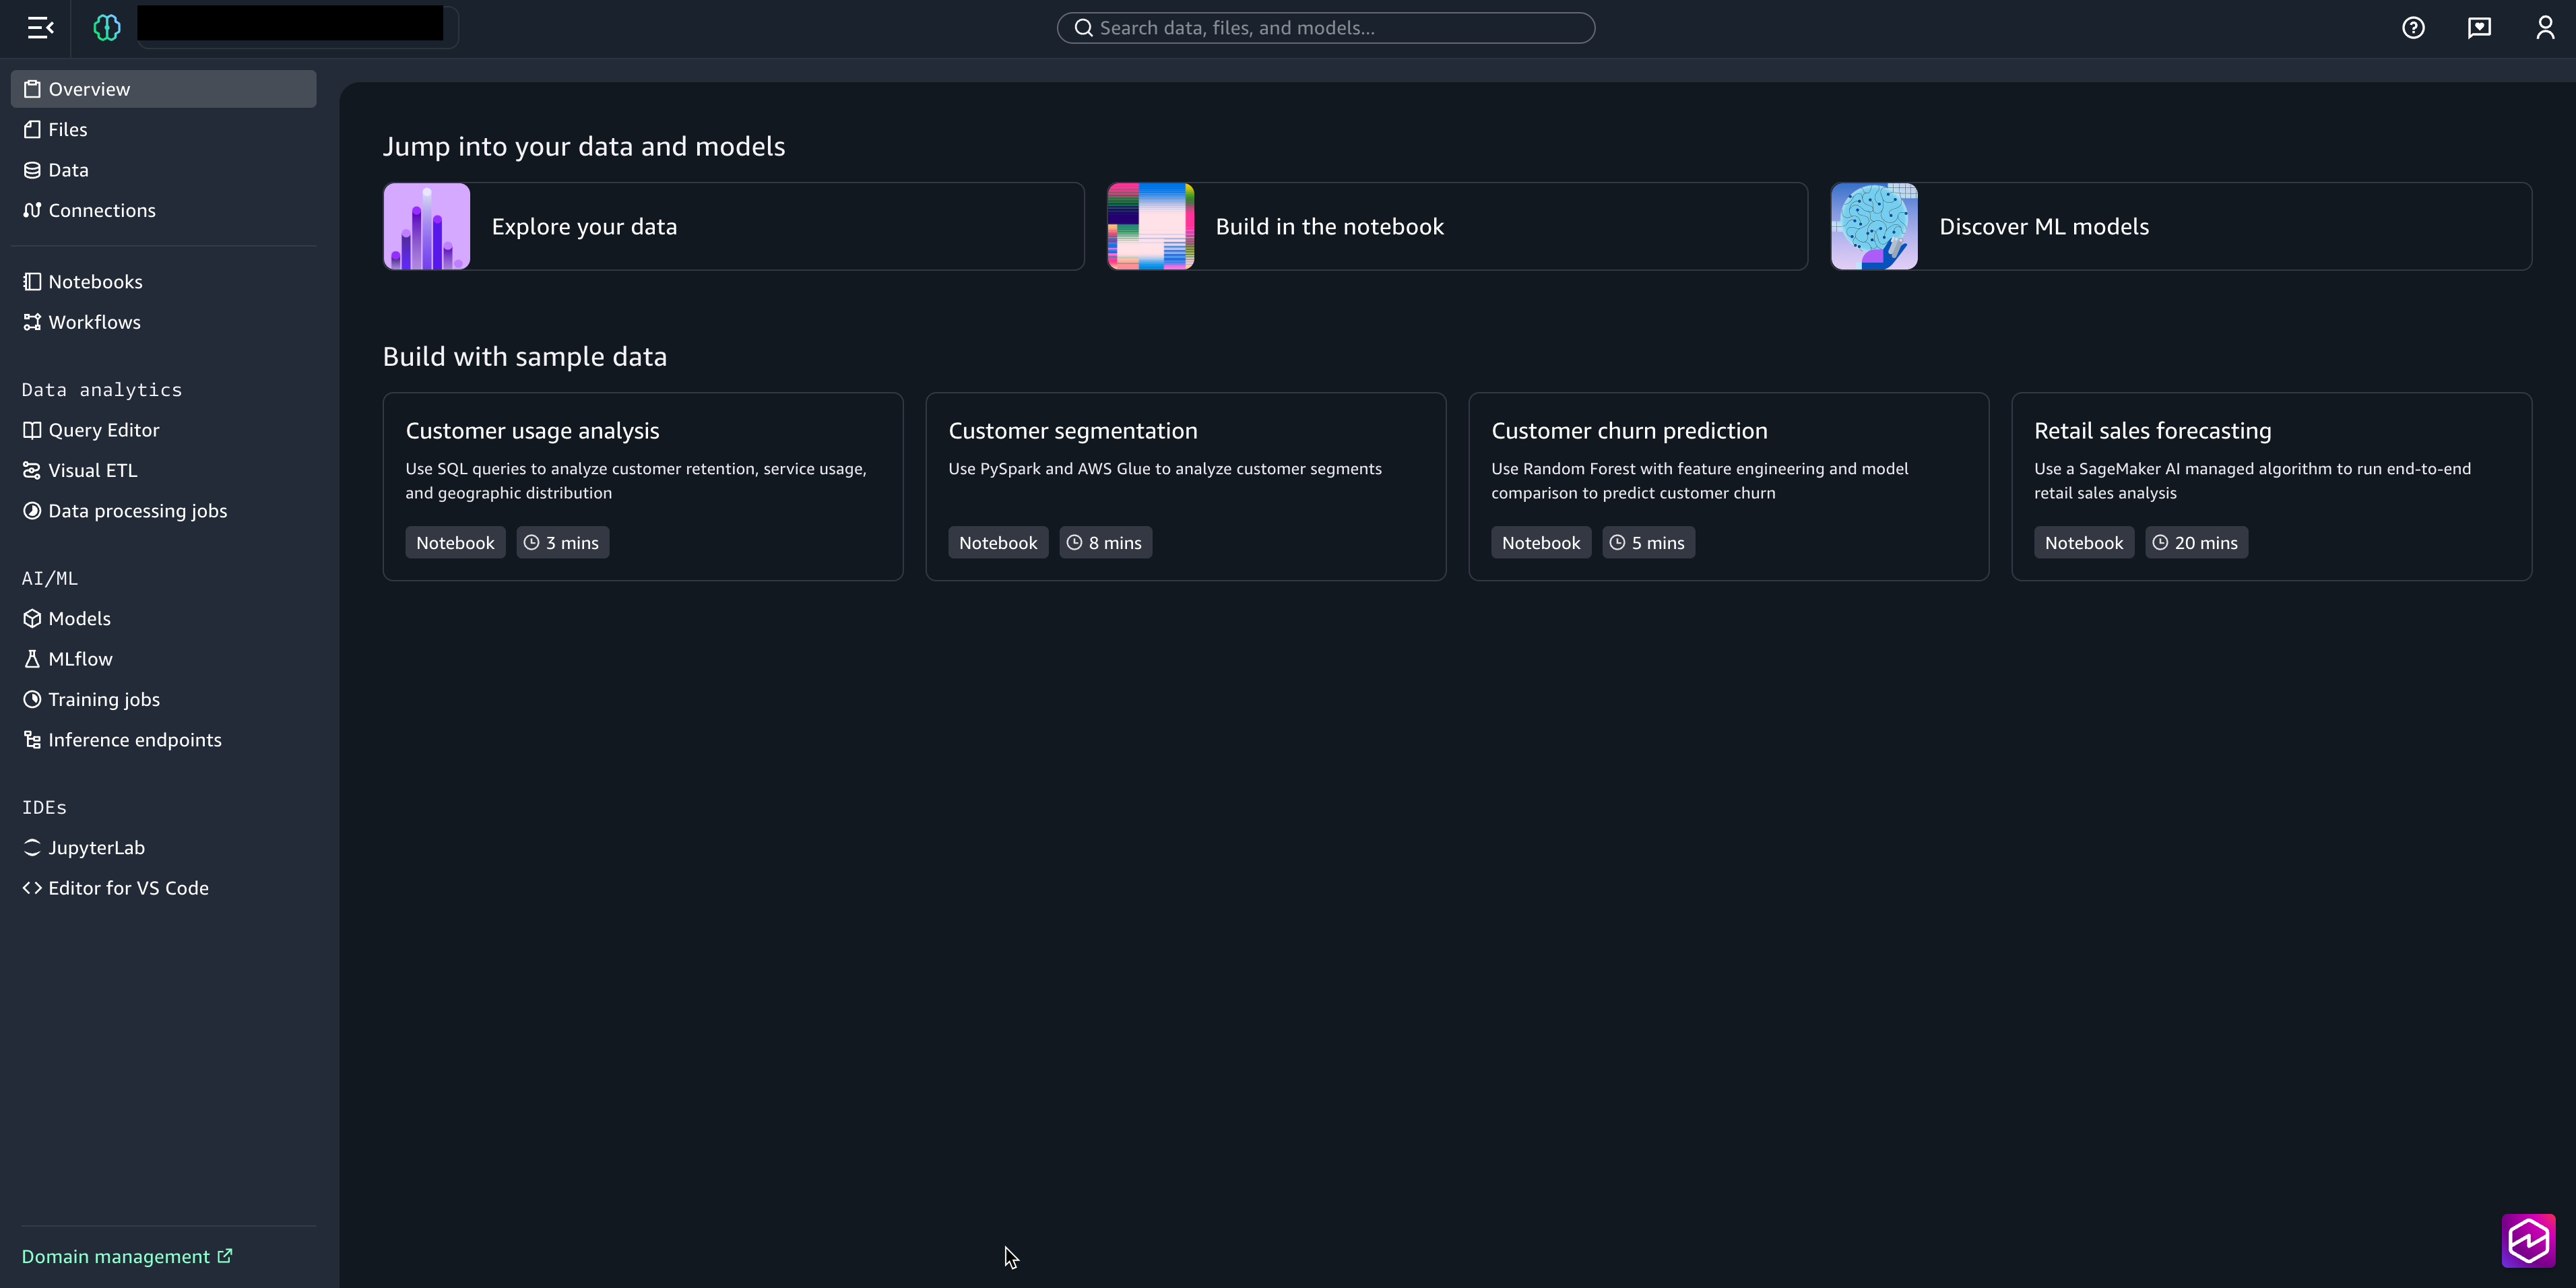
Workflow implementation steps
In this section, we use Amazon SageMaker Studio to create an end-to-end visual workflow in IAM-based domain.Step 1: Set up data storage and import weather dataset
First, we’ll prepare the Amazon S3 storage locations for raw and processed data:- Download this weather dataset file to your local environment.
- From the left menu of the project, choose Files. Under Shared, create two new folders raw_data and processed_data.
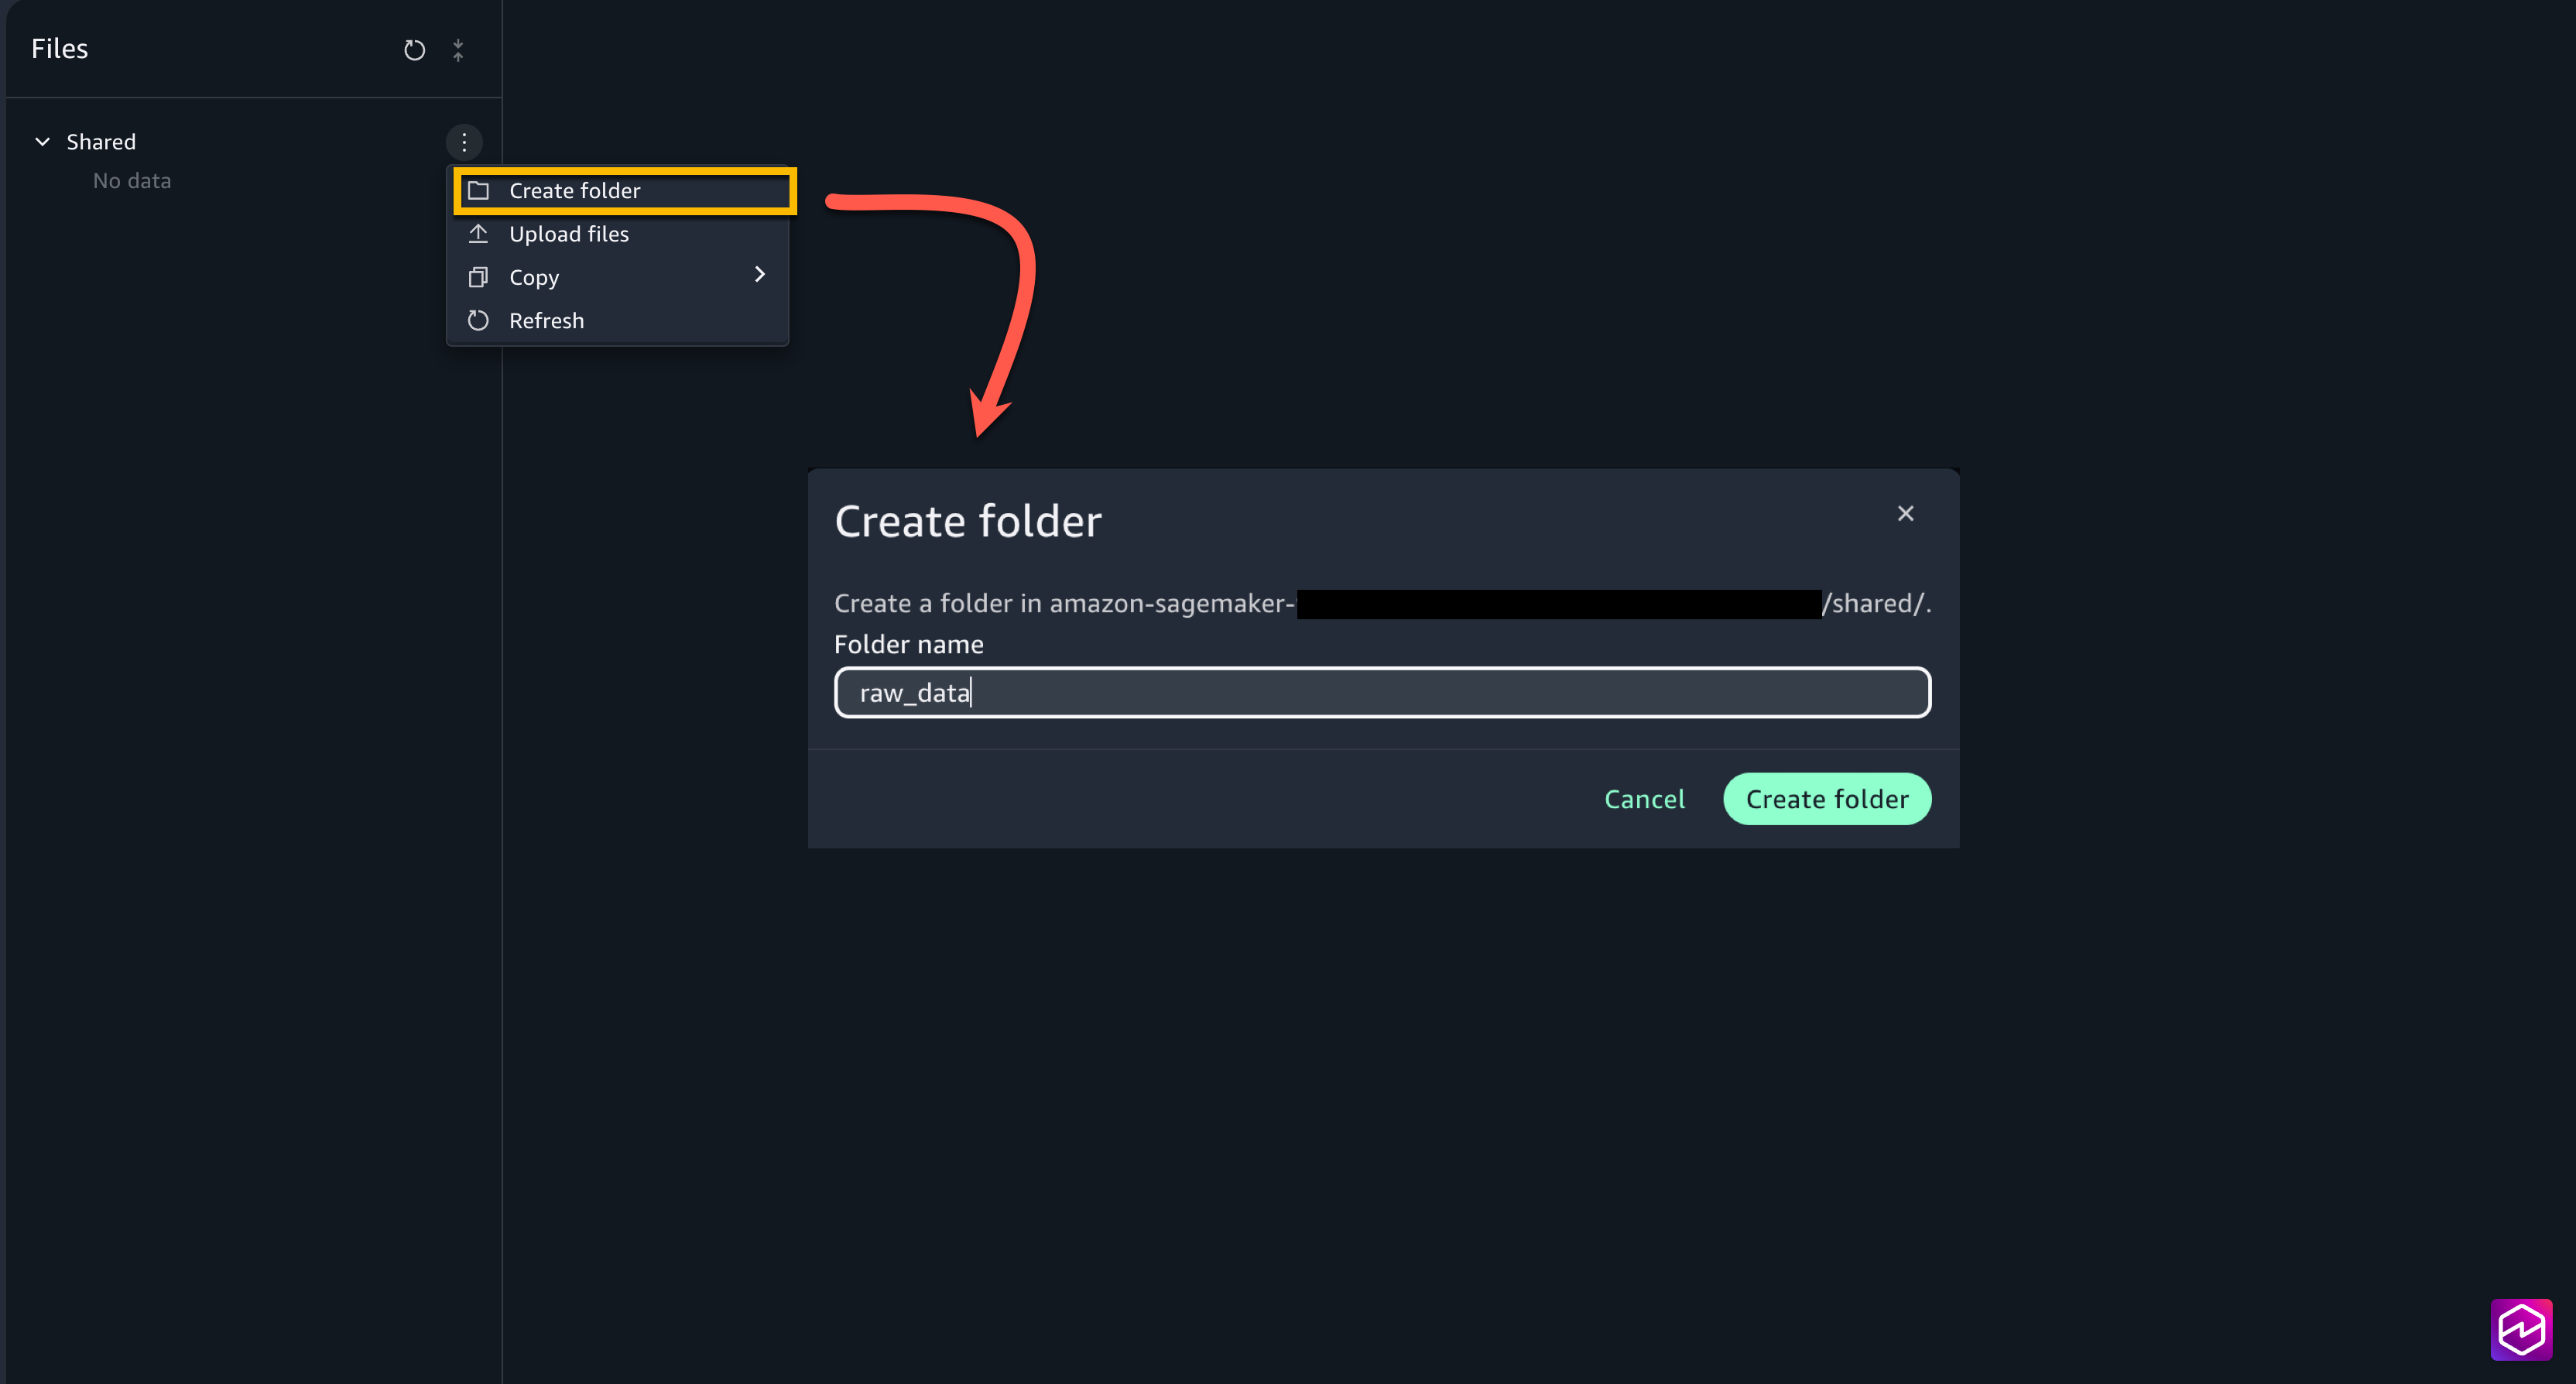
- Upload the weather dataset file downloaded locally into
raw_datafolder.
Step 2: Create the weather data transformation job using Visual ETL
Next, create a Visual ETL job to transform the raw weather data through type casting, SQL transformations, and data cleansing:- From the left menu, under Data Analytics, choose Visual ETL and Create Visual Job.
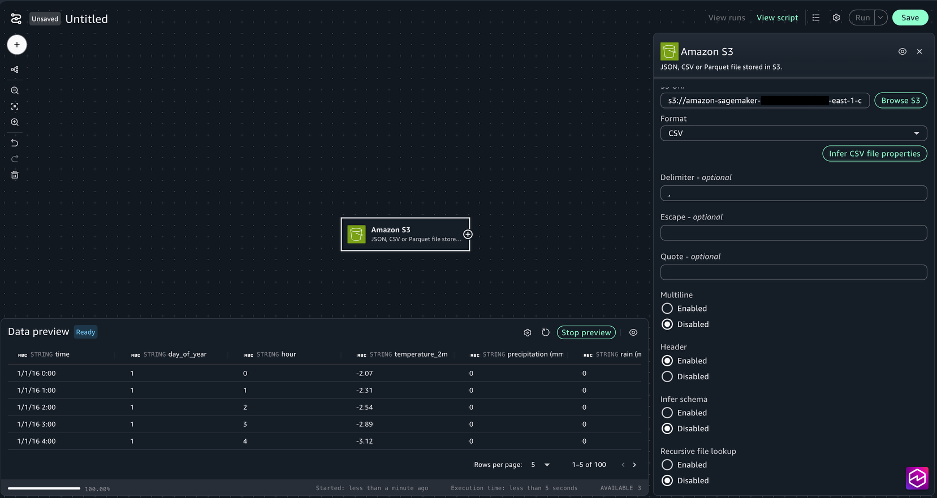
- Choose the + sign, and under Data sources, choose Amazon S3.
- For the Amazon S3 node settings, choose the following:
- S3 URI: Choose Browse S3 and Select
- Delimiter: ,
- Multiline: Disabled
- Header: Enabled
- Infer schema: Disabled
- Recursive file lookup: Disabled
- Choose the + sign next to the Amazon S3 box to add another node, under Transforms select Change columns.
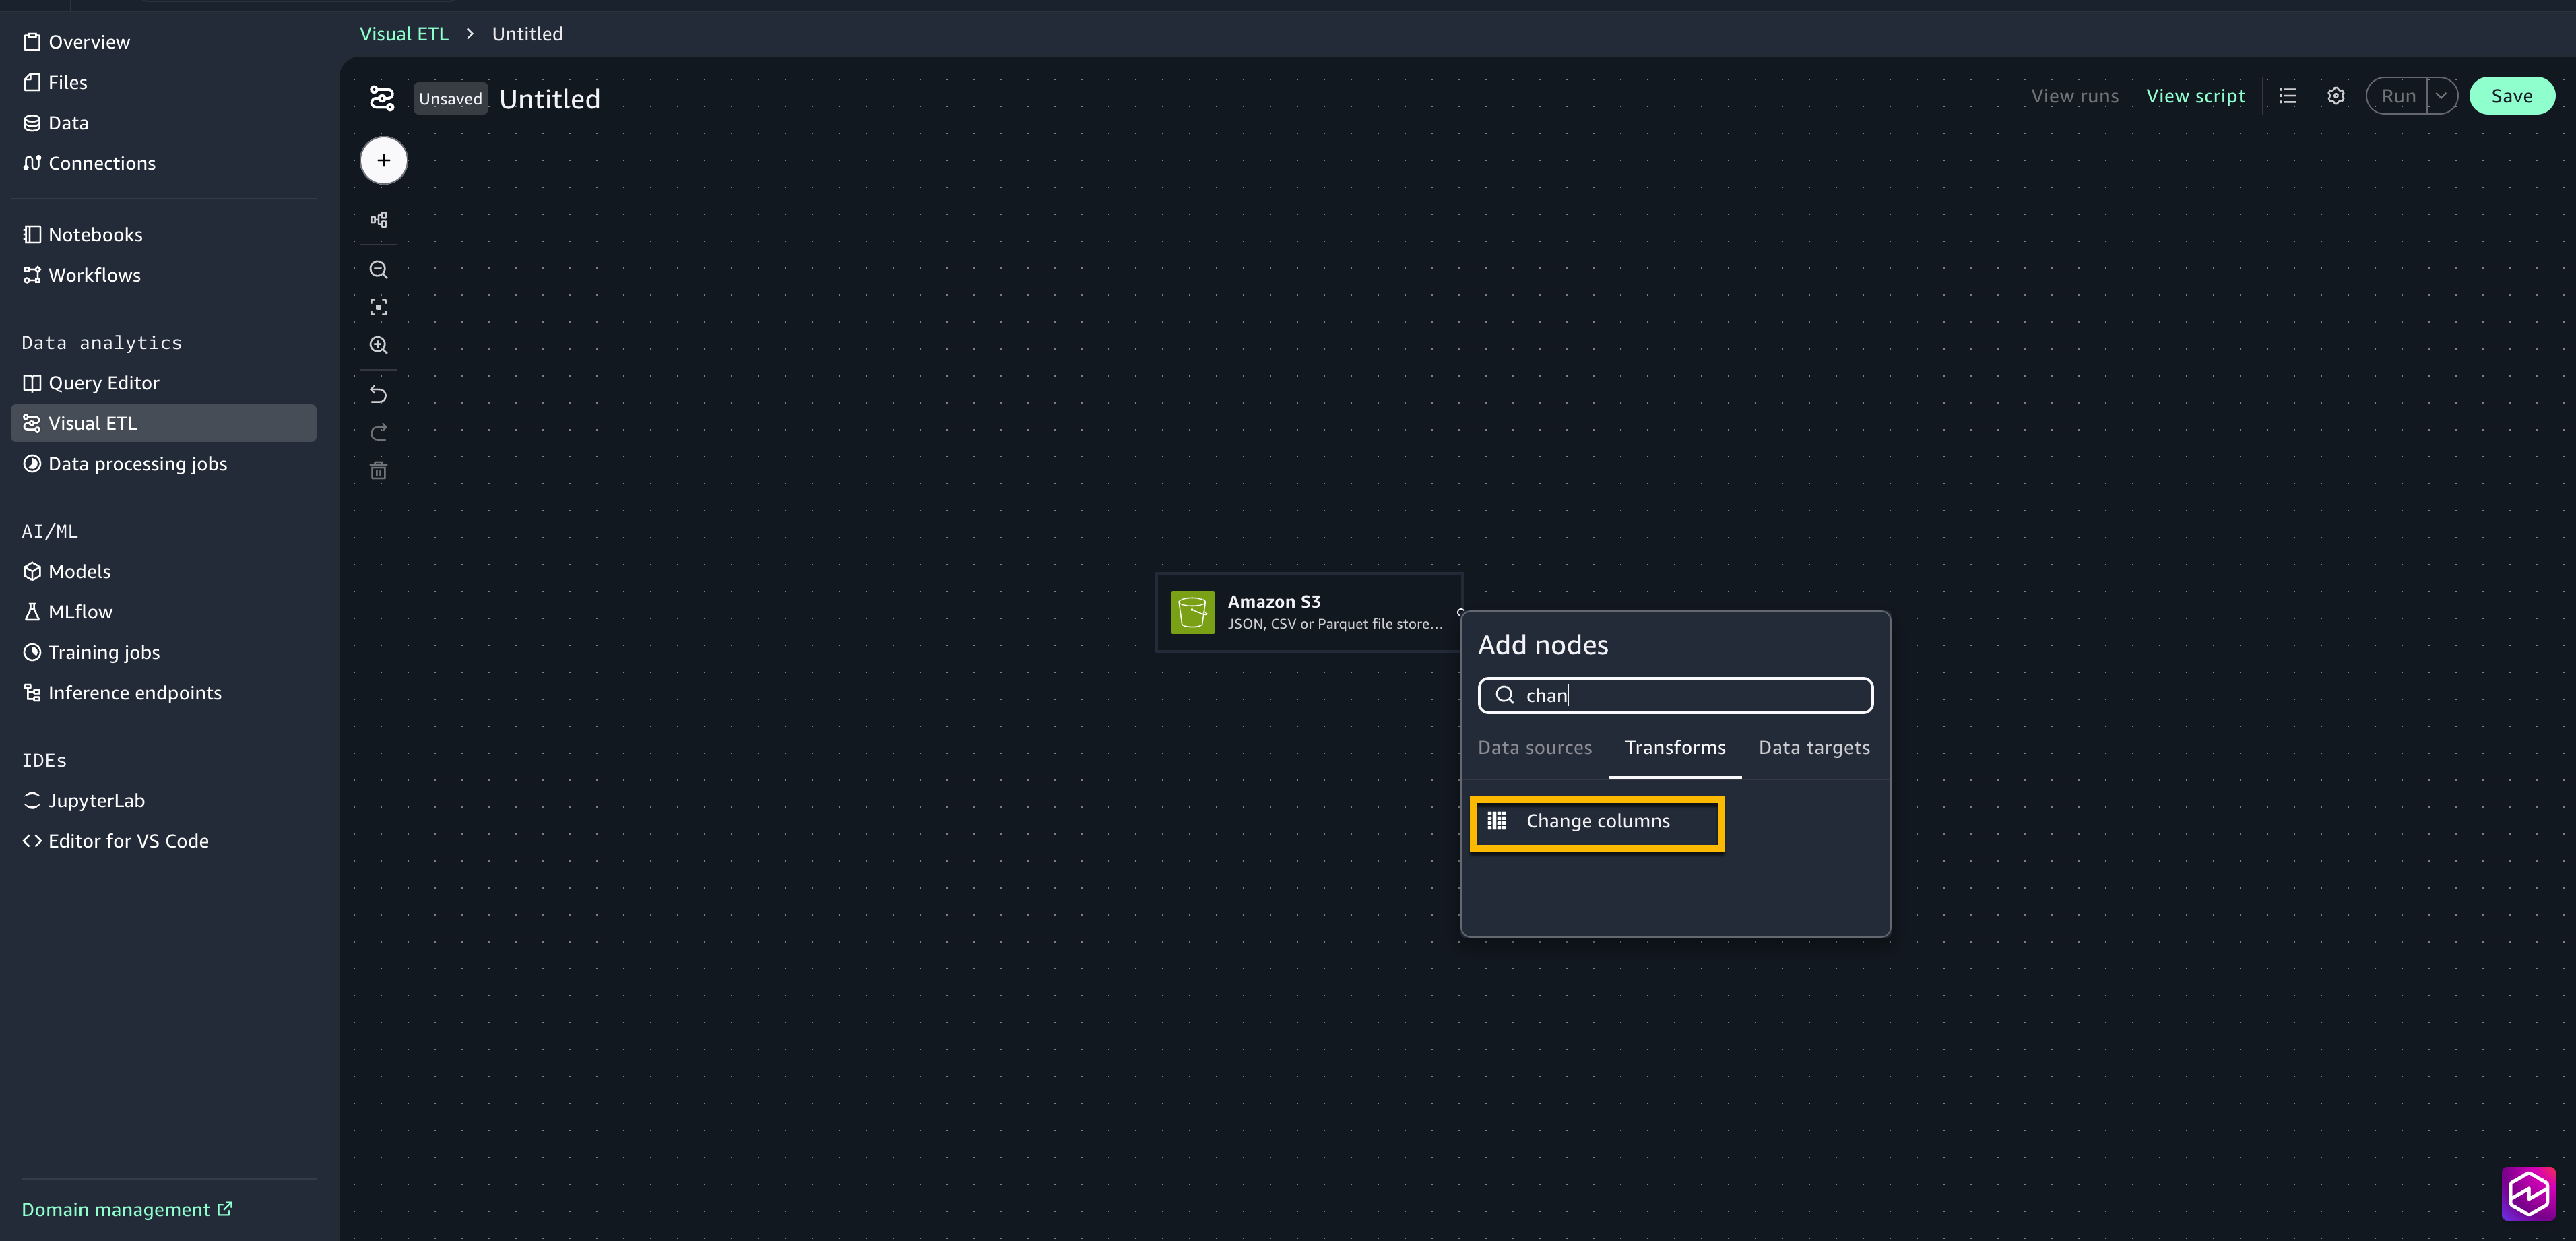
- Connect the Amazon S3 node to the change columns node.
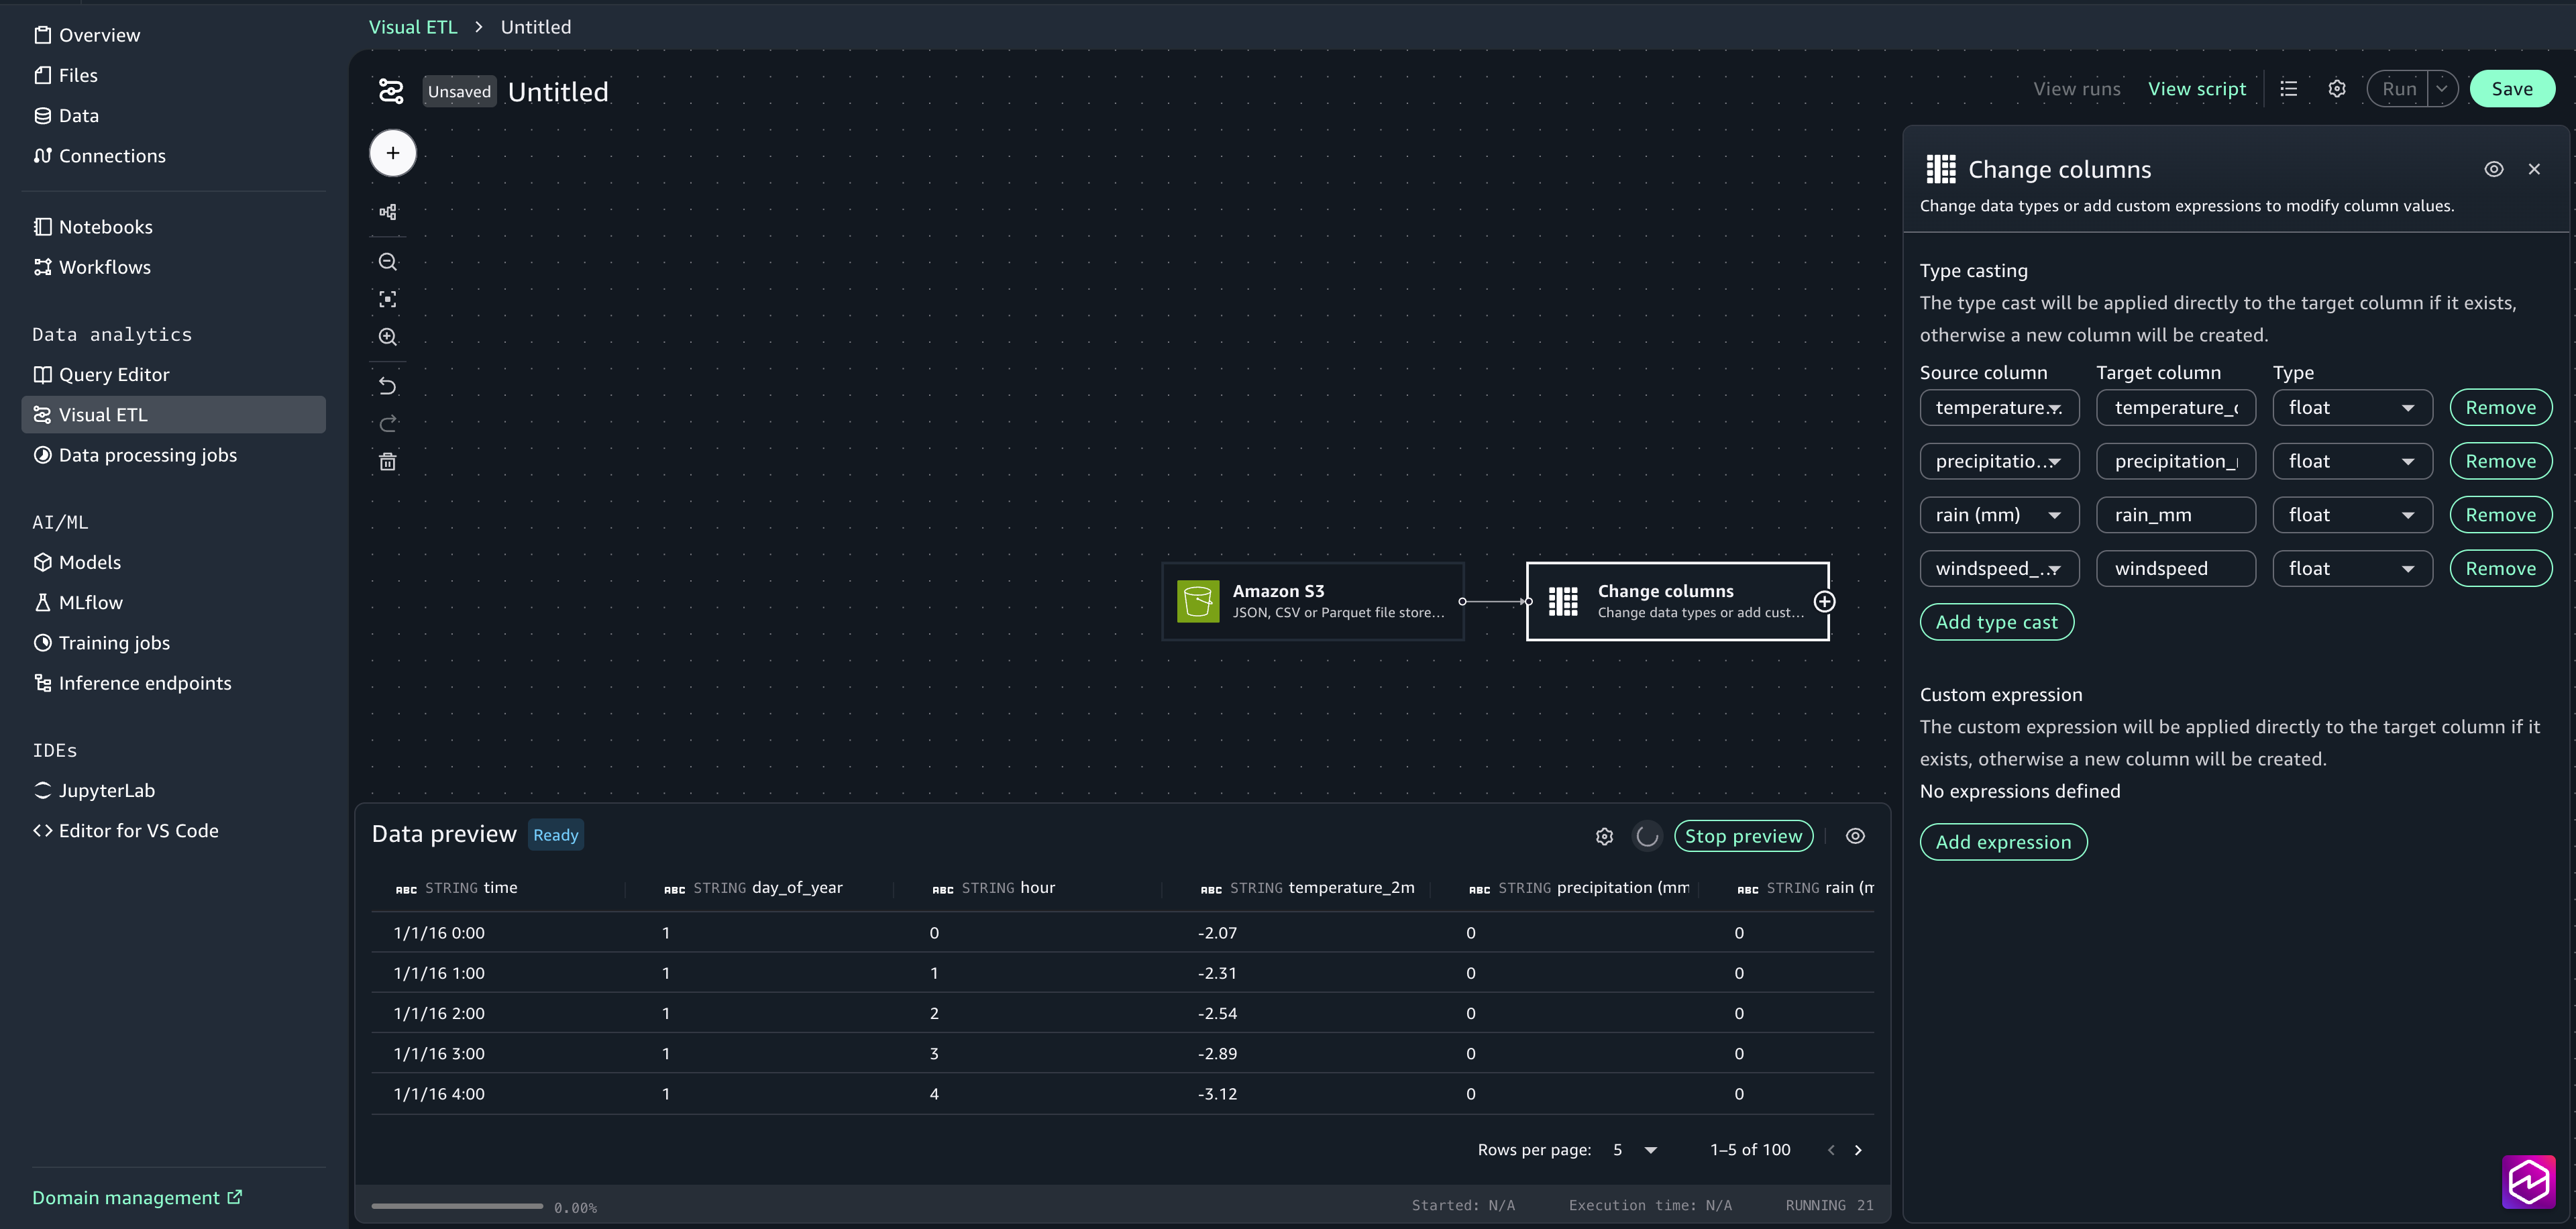
- Select the Change columns node to open the configuration window.
- Choose Add type cast. Select temperature_2m (°C) as the source column and add temperature_celsius as the target column. Select float as the Type.
- Select precipitation (mm) as the source column and add Precipitation_mm as the target column. Select float as the Type.
- Select rain (mm) as the source column and add Rain_mm as the target column. Select float as the Type.
- Select windspeed_10m (km/h) as the source column and add windspeed as the target column. Select float as the Type.
- Close the configuration window.
- Choose the + sign to add another node, under Transforms select SQL query . In the configuration window, paste in the following SQL statement:
SELECT
    MAKE_TIMESTAMP(2016, 1, day_of_year, hour, 0, 0) as timestamp,
    (temperature_celsius * 9 / 5) + 32 as temp_f,
    rain_mm * 25.4 as rain_inches,
    windspeed
FROM {myDataSource}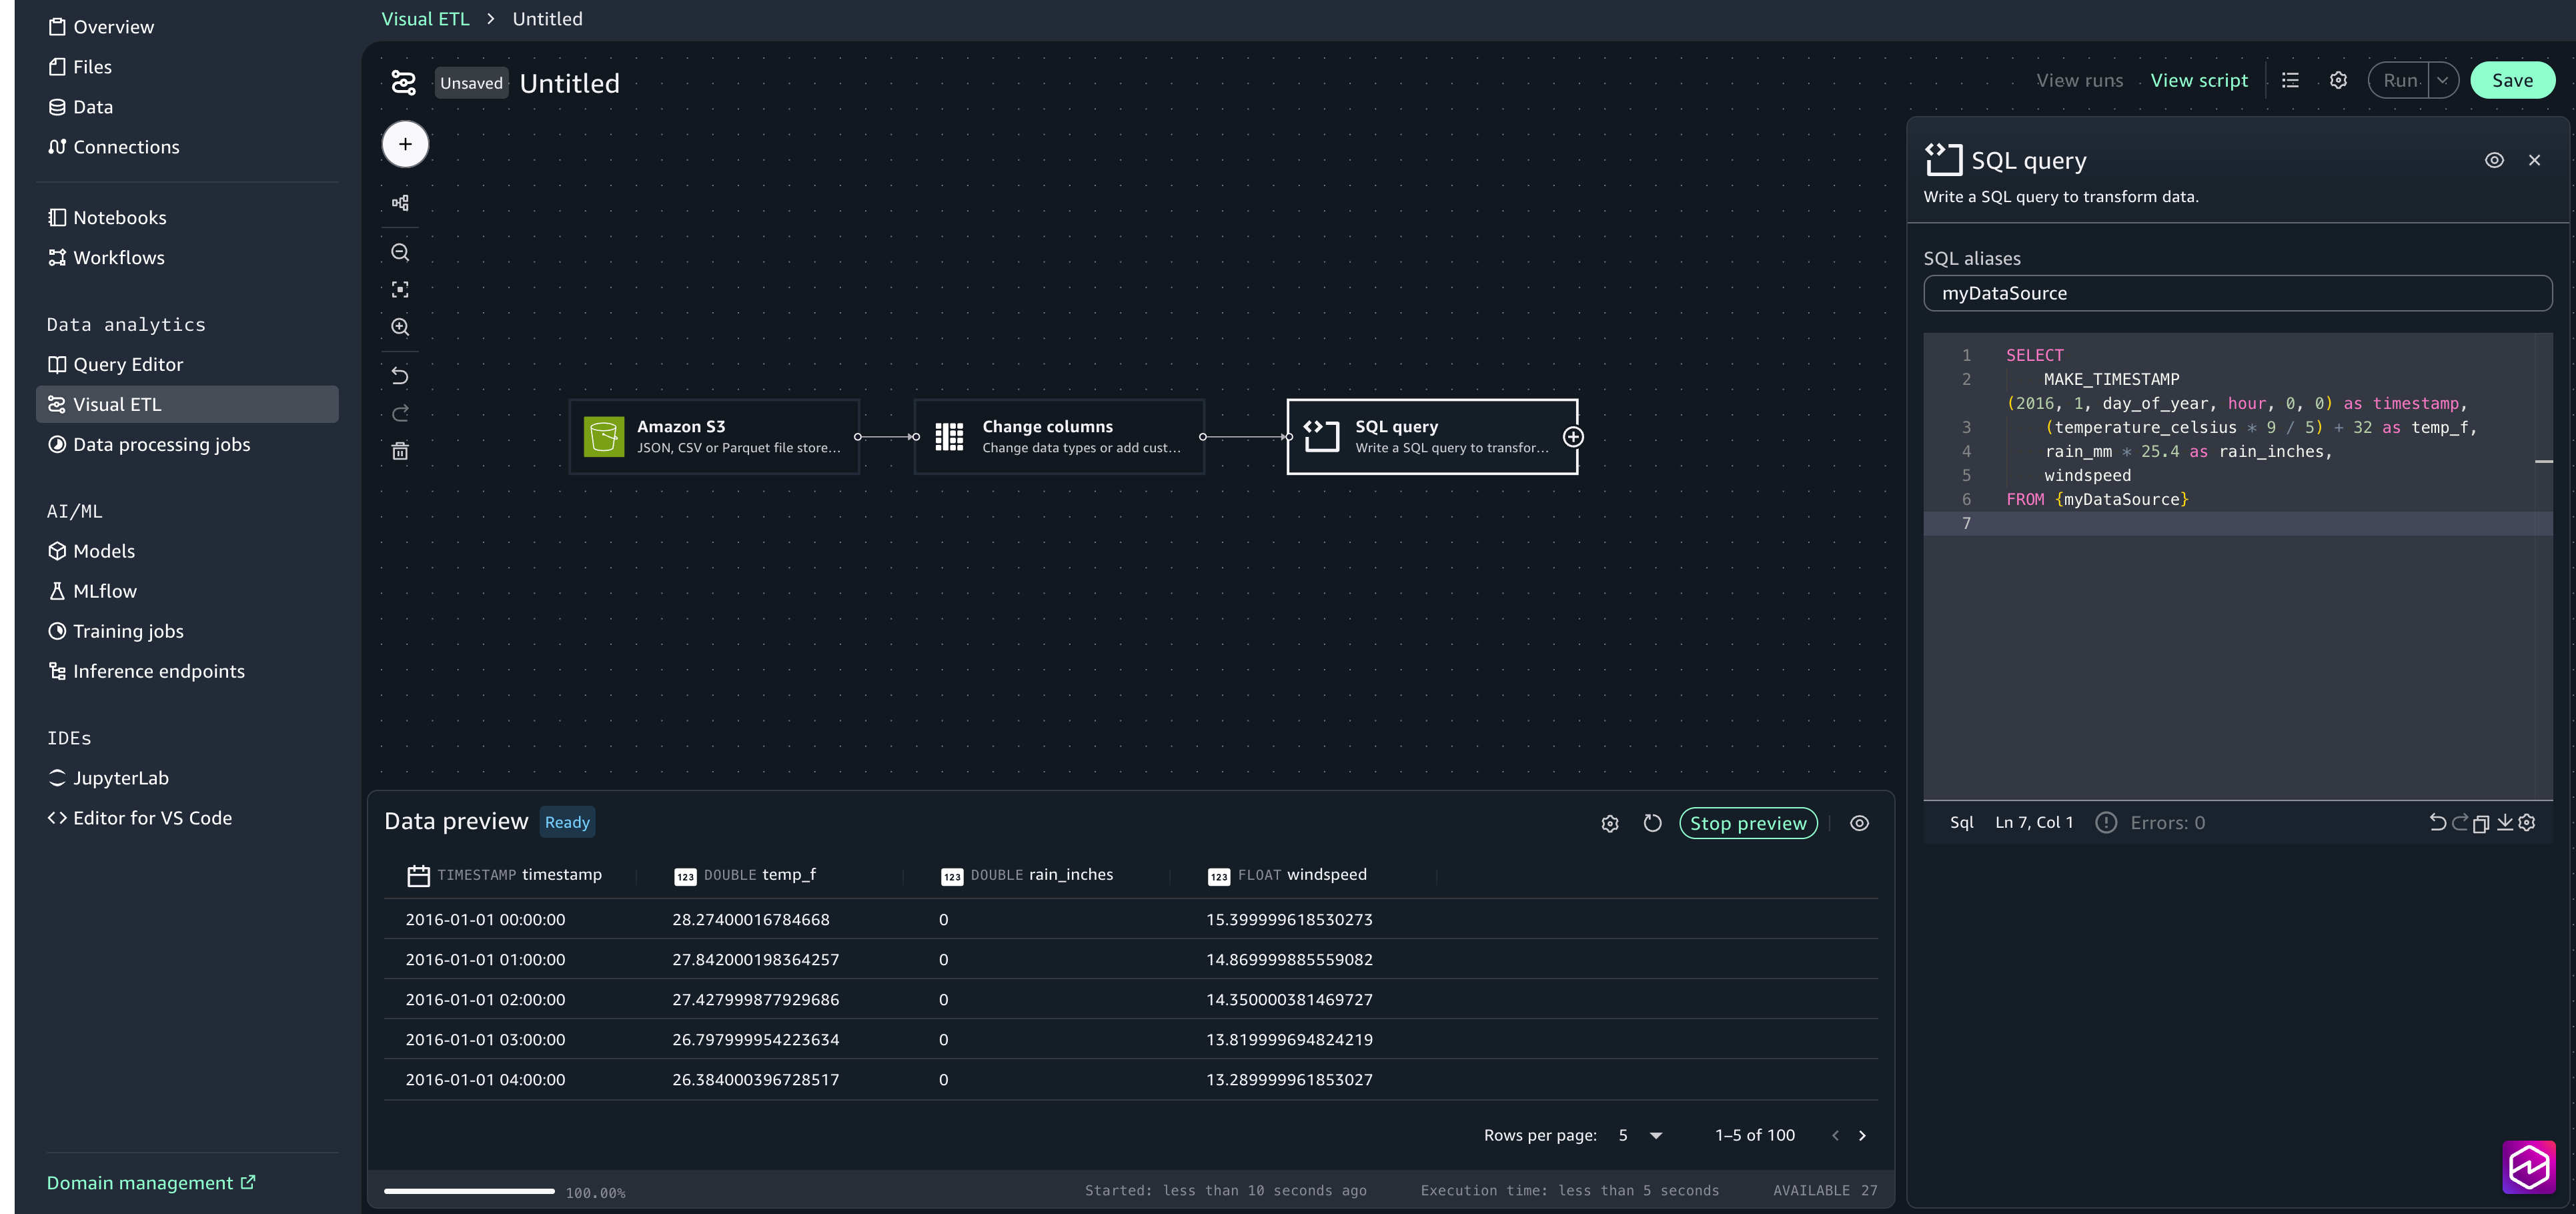
- Choose the + sign to add another node, under Data targets, choose Amazon S3 and provide the following options:
- S3 URI: Choose Browse S3 and select the processed_data folder created in Step 1.
- Format: CSV
- Update catalog: true
- Database: sagemaker_sample_db
- Table: weather_data
- Include header: true
- Ouput to a single file: false
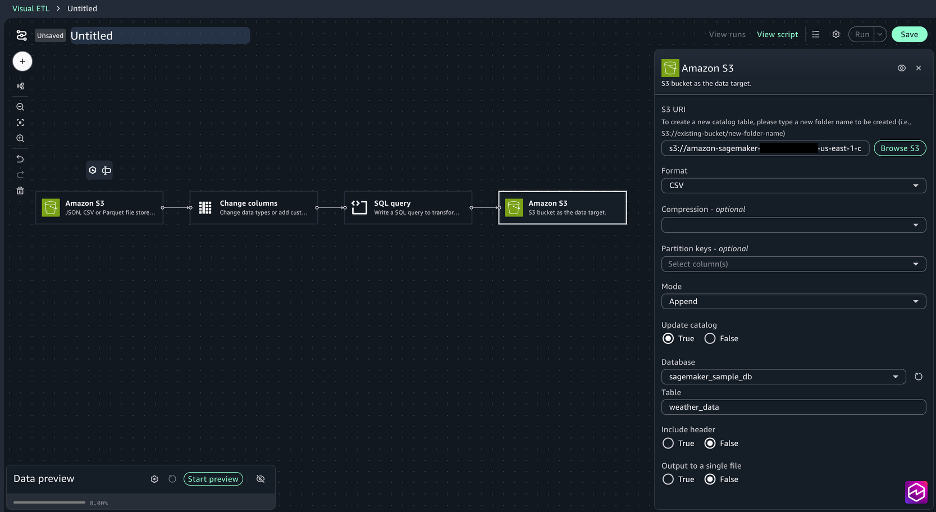
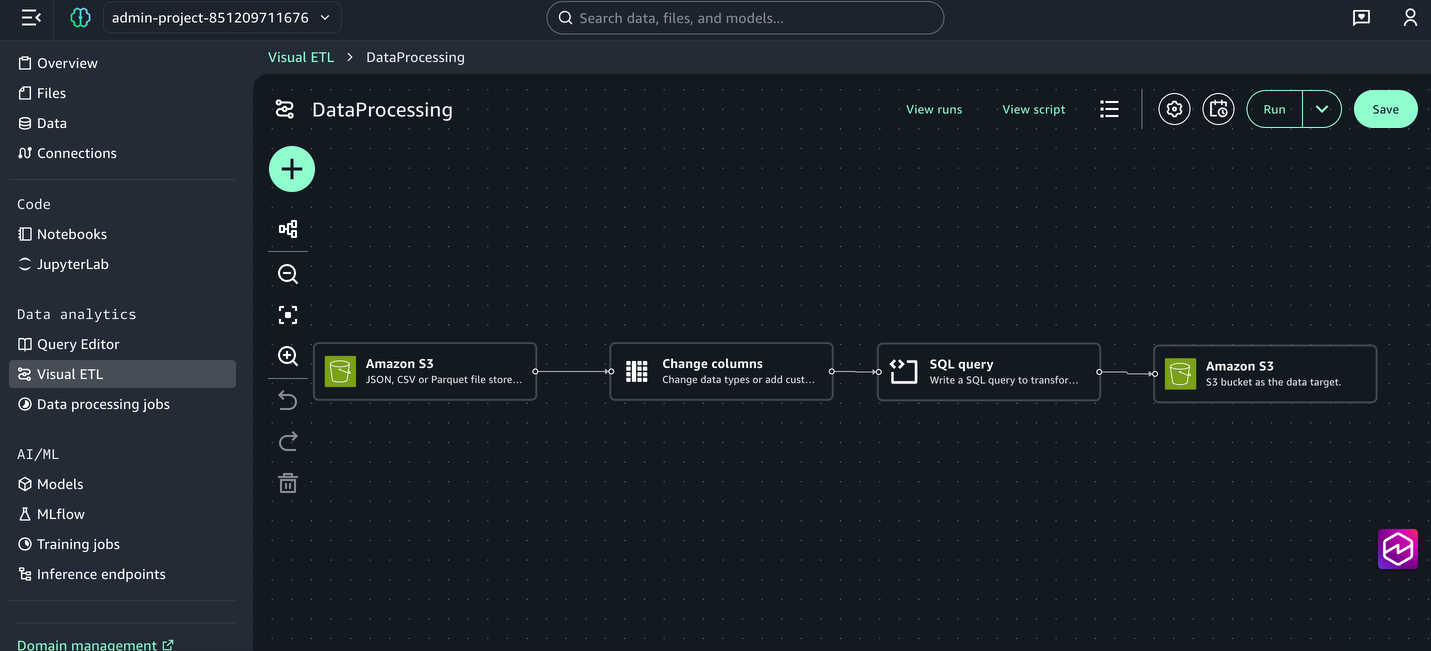
- Connect the nodes to create a complete job.
- Save the Visual ETL and name it DataProcessing.
Step 3: Create the analysis and prediction notebook using JupyterLab
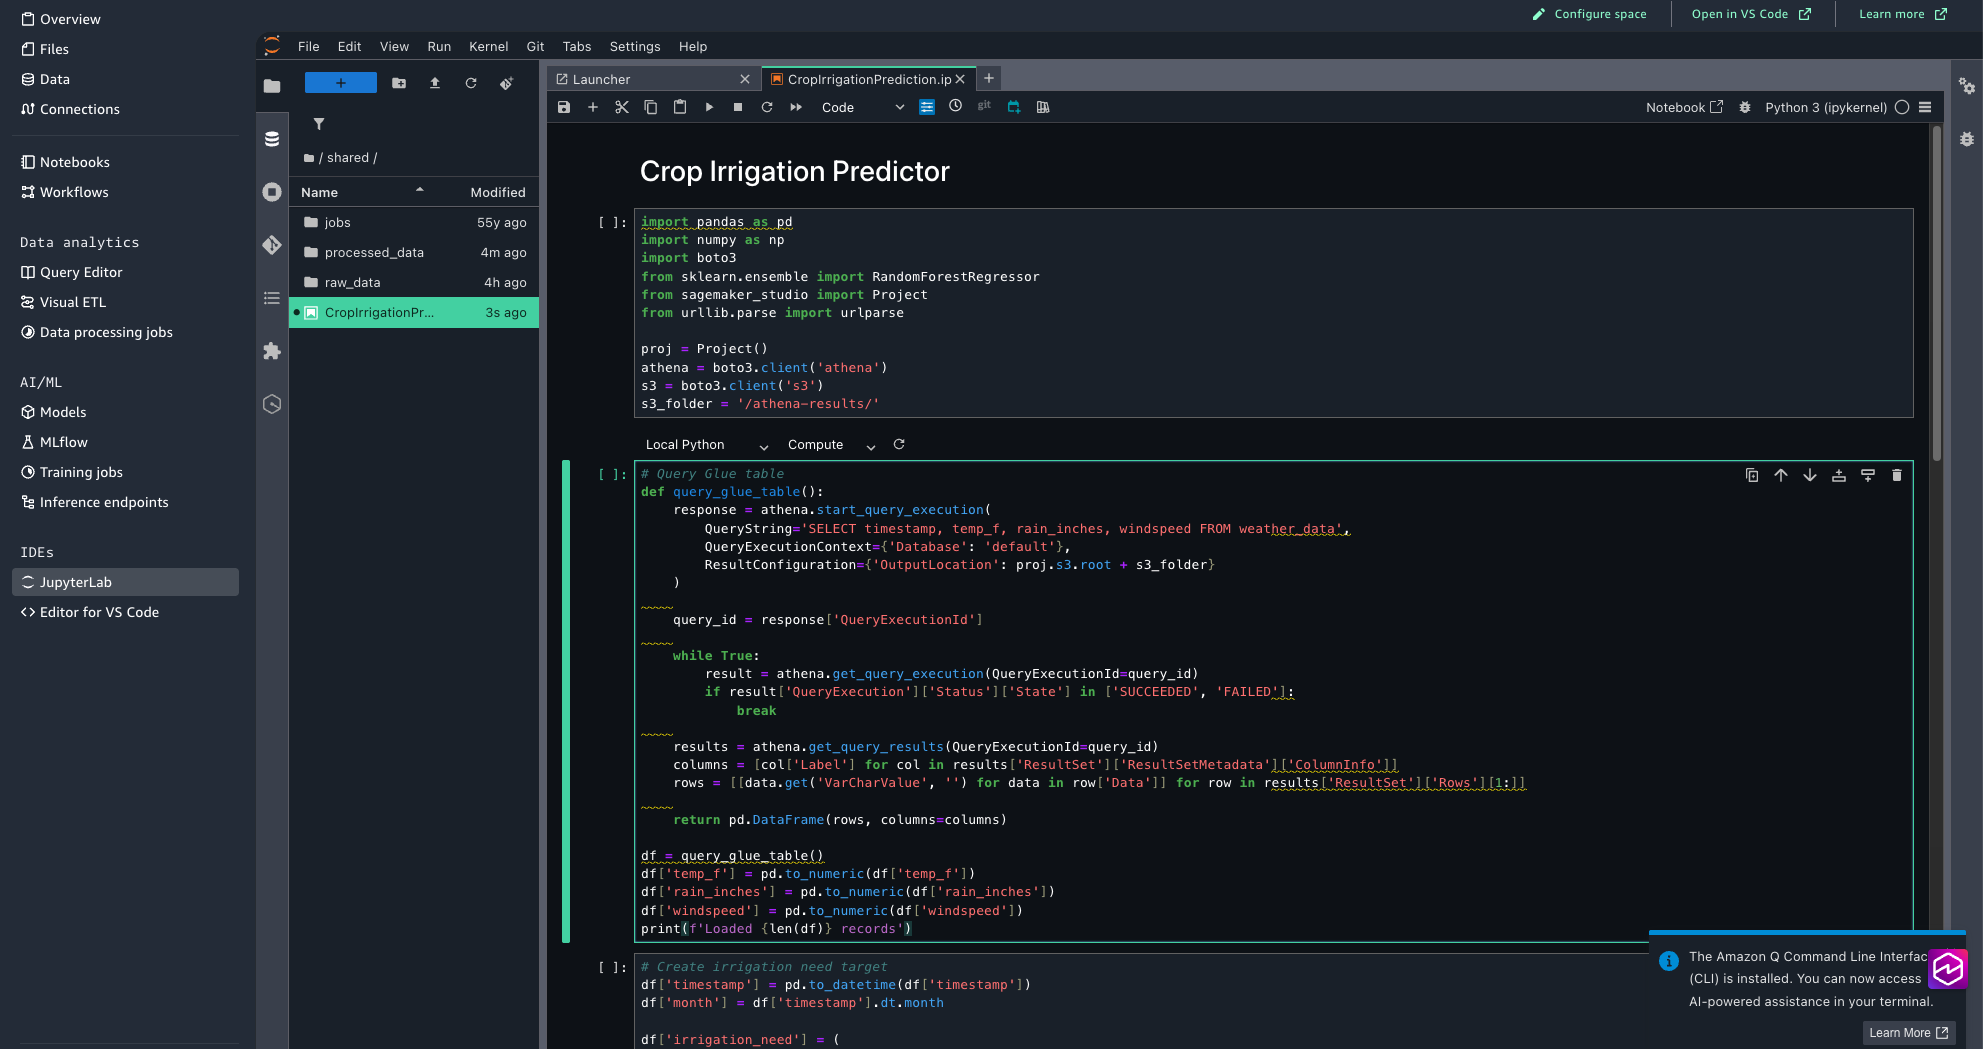
Now, we’ll set up the JupyterLab notebook that performs seasonal irrigation analysis and crop impact predictions based on temperature, rainfall, and wind speed patterns.Complete the following steps:- Download the Crop Irrigation Prediction Python notebook to your local environment.
- In the SageMaker Unified Studio, from the left menu, choose JupyterLab. Wait for a few seconds for JupyterLab to be set up if you are trying for the first time.
- Upload CropIrrigationPrediction.ipynb using the upload files option.

- Review the notebook code to understand how it processes the weather data and generates irrigation predictions.
Step 4: Orchestrate the workflow
Finally, we will use the visual workflow to orchestrate tasks. With visual workflows, you can define a collection of tasks organized as a directed acyclic graph (DAG) that can run on a user-defined schedule.- Choose Workflows from the left menu.
- Choose Create new Workflow.
- Rename the workflow to WeatherDataProcessingOrchestration.
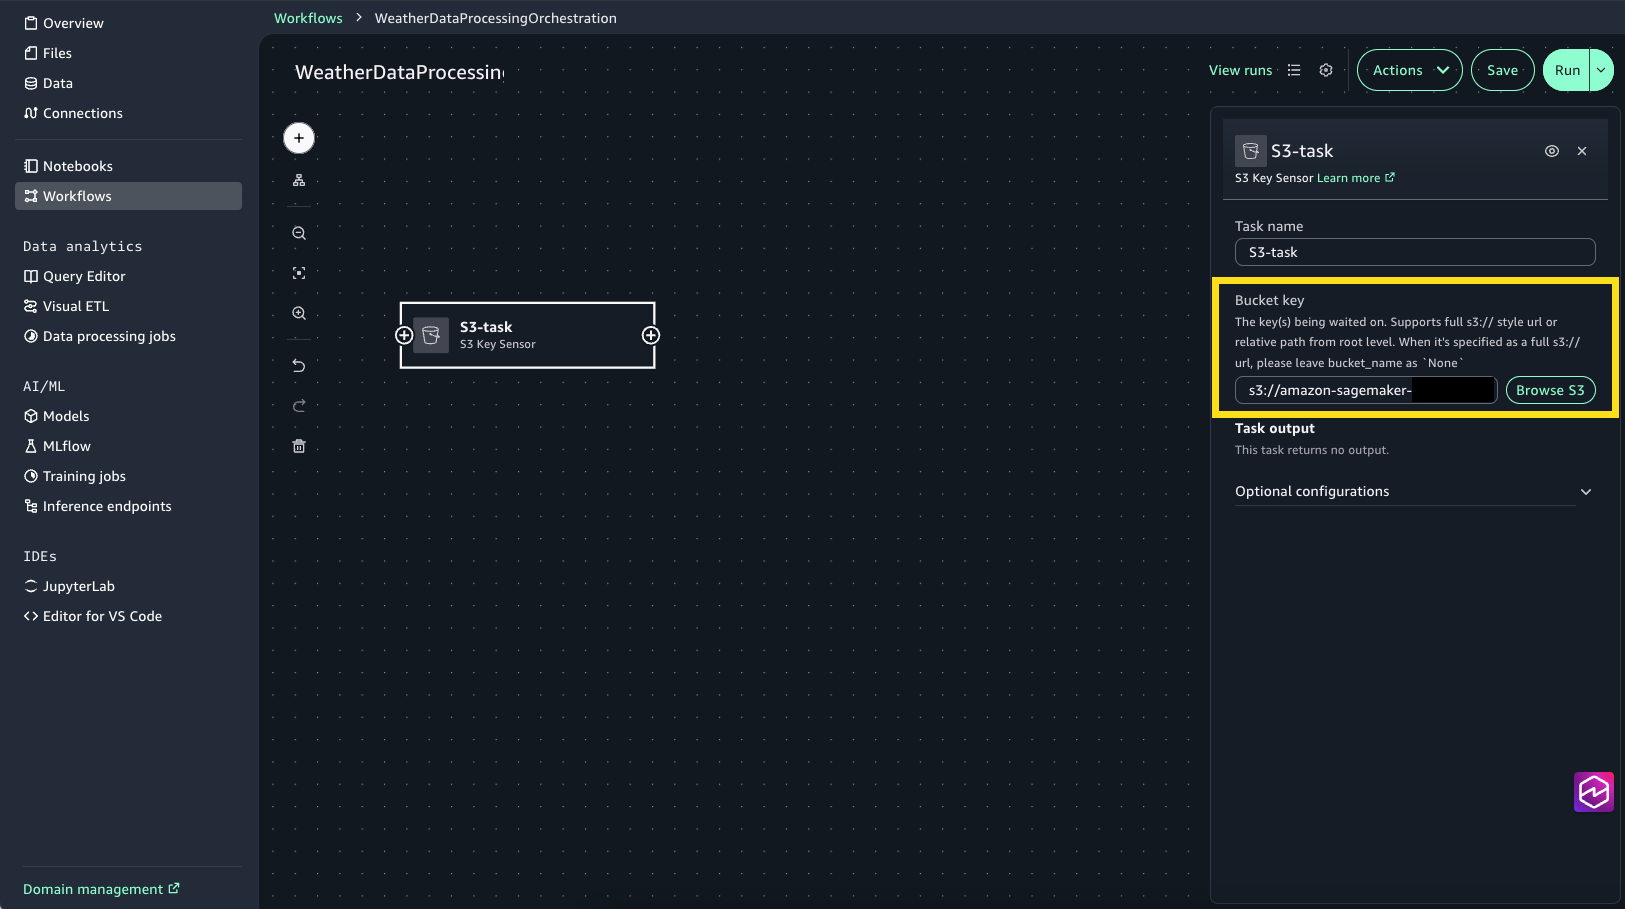
- Create S3 task for monitoring and ingesting raw weather data:
- Choose the + sign, then choose S3 Key Sensor.
- Select S3-task to open the configuration window.
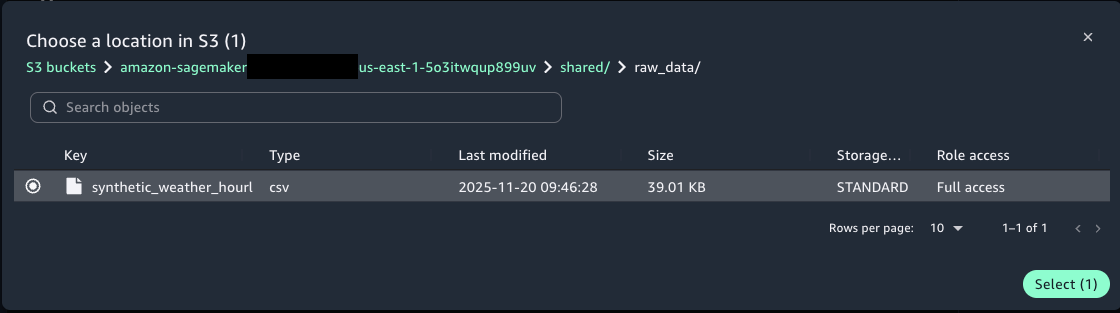
- For Bucket key choose Browse S3 and choose the synthetic_weather_hourly_data.csv file from the shared/raw_data S3 folder.

- Create a Glue task to transform the weather data:
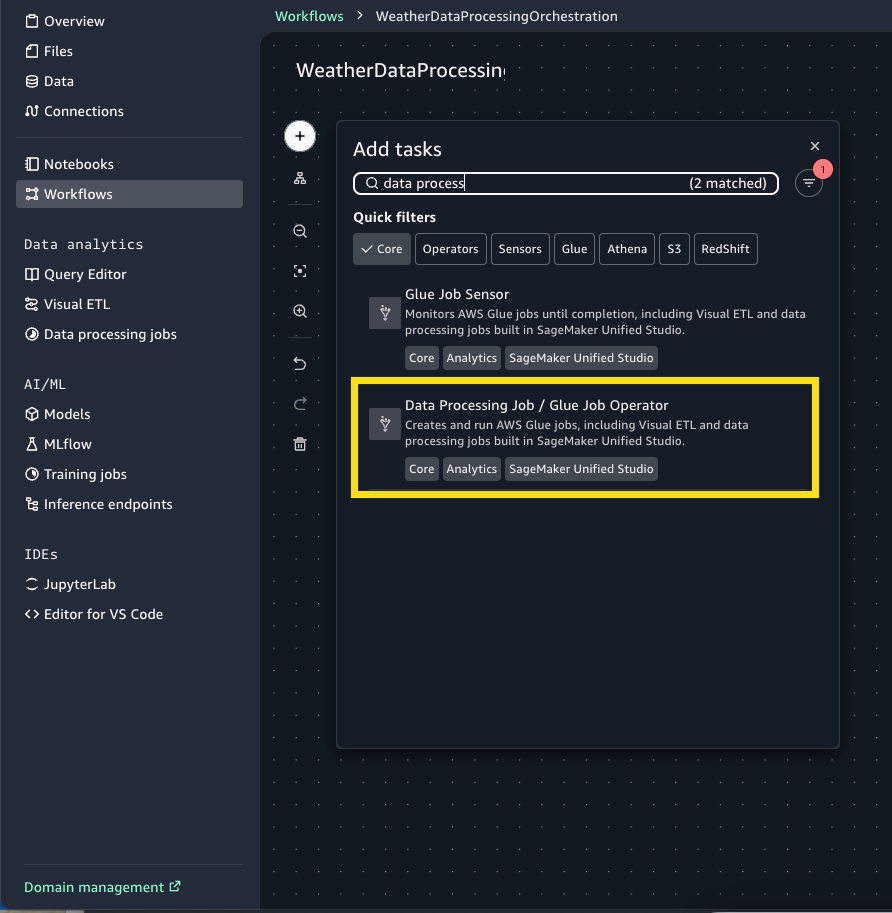
- Choose the + Sign and add Data Processing Job / Glue Job Operator.
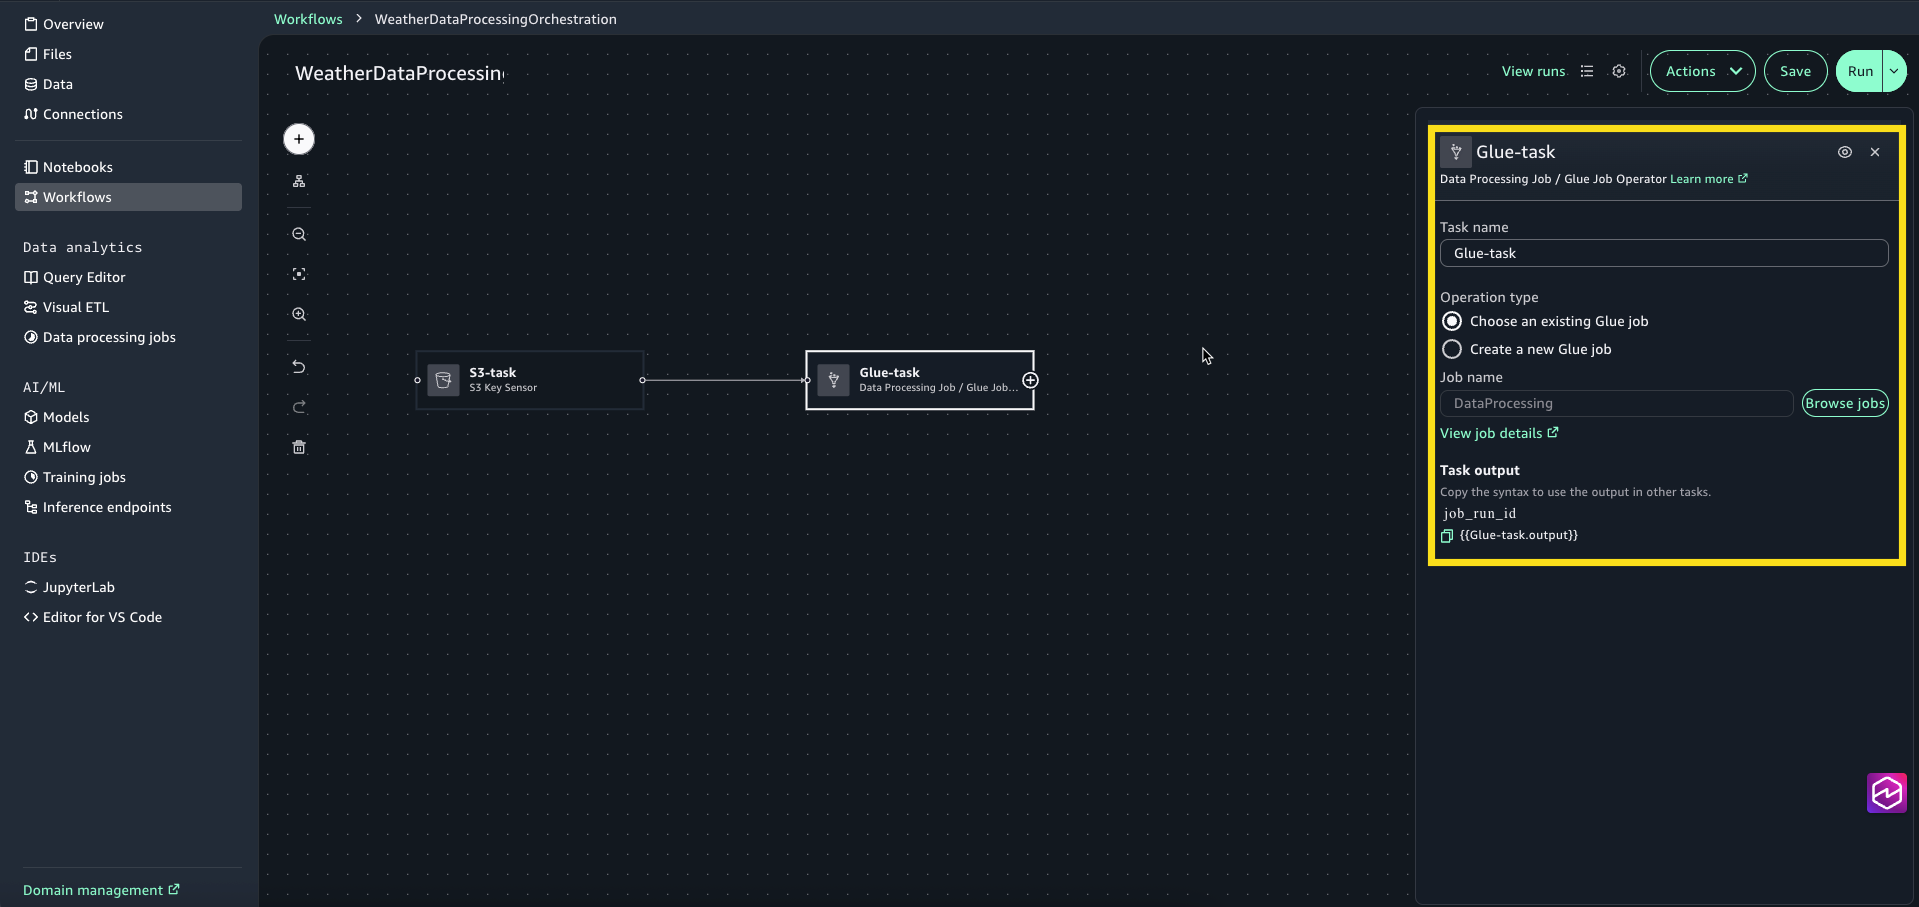
- Select Glue-task node to open the configuration window. For Operation type select Choose an existing Glue job.
- For Job name, choose Browse Jobs and select DataProcessing (this is the visual ETL job we created in the previous step.
- Choose the + sign and add SageMaker Unified Studio Jupyter Notebook Operator.
- Select the Notebook-task to open the configuration window. For Source, choose Browse Files and choose CropIrrigationPrediction.ipynb.

- Connect the tasks to create the complete workflow.
- Review the Workflow settings and choose Save.
- Provide a workflow description, “Workflow for Weather Data Processing”
- For Trigger, choose Manual only, because in this example you will trigger the workflow manually. You can also configure the workflow to trigger automatically on a schedule or disable it from running

Step 5: Execute and monitor the workflow
To run your workflow, complete the following steps:- Choose Run to trigger workflow execution.
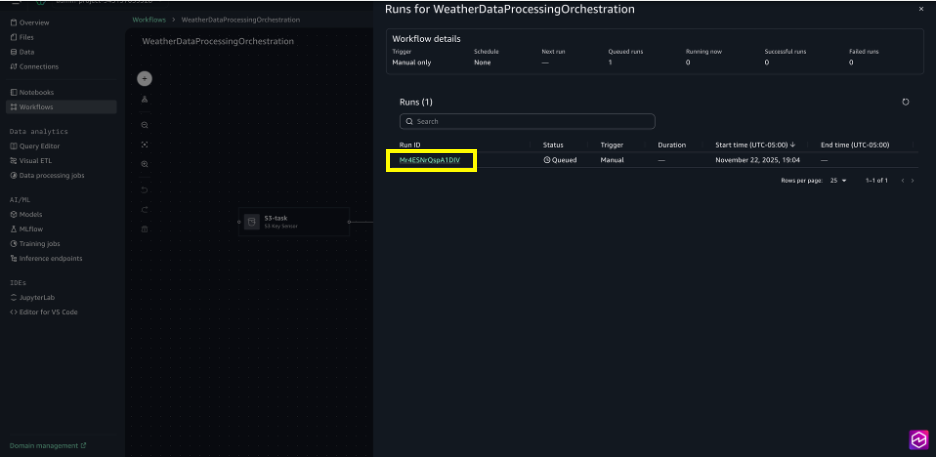
- Choose View runs to see the running workflow.

- Choose the Run ID for detailed logs on the execution.
- When the run is complete, you can review the task logs by choosing the Task ID.

Clean up
To avoid incurring future charges, clean up the resources you created during this walkthrough. Leaving these resources running may result in ongoing costs for storage and compute.To clean up your resources:- On the workflows page, select your workflow, and under Actions, choose Delete workflow.
- In Visual ETL, select your weather data transformation flow, and under Actions, choose Delete job.
- In Query Editor, use the three dots next to the name of the table weather_data and choose Drop table.
- In JupyterLab, in the File Browser sidebar, choose (right-click) your notebook and choose Delete.
- In Files, choose the folder raw_data and under Actions, choose Delete. Repeat the steps for the folders processed_data and output.
Conclusion
In this post, you learned how you can use the visual workflow experience in Amazon SageMaker Unified Studio to build end-to-end data processing pipelines through an intuitive, no-code interface. This experience removes the need to write orchestration logic manually while still offering production-grade reliability and scalability powered by Amazon MWAA Serverless. Whether you’re processing weather data for agricultural insights or building more complex machine learning pipelines, the visual workflow experience accelerates development and makes workflow automation accessible to data engineers, analysts, and data scientists alike.As organizations increasingly rely on automated data pipelines to drive business decisions, the visual workflow experience provides the perfect balance of simplicity and power. We encourage you to explore this new capability in Amazon SageMaker Unified Studio and discover how it can transform your data processing workflows. To learn more, visit the Amazon SageMaker Unified Studio page.About the authors
Suba Palanisamy
Suba is an Enterprise Support Lead, helping customers achieve operational excellence on AWS. Suba is passionate about all things data and analytics. She enjoys traveling with her family and playing board games.Vinod Jayendra
Vinod is an Enterprise Support Lead in ISV accounts at Amazon Web Services, where he helps customers in solving their architectural, operational, and cost optimization challenges. With a particular focus on Serverless & Analytics technologies, he draws from his extensive background in application development to deliver top-tier solutions. Beyond work, he finds joy in quality family time, embarking on biking adventures, and coaching youth sports team.Kamen Sharlandjiev
Kamen is a Senior Worldwide Specialist SA, Big Data expert. He’s on a mission to make life easier for customers who are facing complex data integration and orchestration challenges. His secret weapon? Fully managed AWS services that can get the job done with minimal effort. Follow Kamen on LinkedIn to keep up to date with the latest MWAA and AWS Glue features and news!Yuhang Huang
Yuhang is a Software Development Manager on the Amazon SageMaker Unified Studio team. He leads the engineering team to design, build, and operate scheduling and orchestration capabilities in SageMaker Unified Studio. In his free time, he enjoys playing tennis.Vasudevan Venkataramanan
Vasudevan is a Senior Software Engineer on the Amazon SageMaker Unified Studio team. He is responsible for technical direction of scheduling and orchestration within SageMaker Unified Studio. Outside of his professional work, he enjoys spending time with his kid and playing pickleball and cricket.Gal Heyne
Gal is a Senior Technical Product Manager for AWS Analytics services with a strong focus on AI/ML and data engineering. She is passionate about developing a deep understanding of customers’ business needs and collaborating with engineers to design simple-to-use data products.Enjoyed this article? Sign up for our newsletter to receive regular insights and stay connected.