
February 2021 Macroeconomic growth and macroeconomic growth expectations play an important role in equity investing. When macroeconomic growth or macroeconomic growth expectations increase, we would expect that equity markets perform better than when macroeconomic growth or macroeconomic growth expectations are falling.
Source: Global Growth Expectations: What Do They Mean For Your Stock Portfolio?
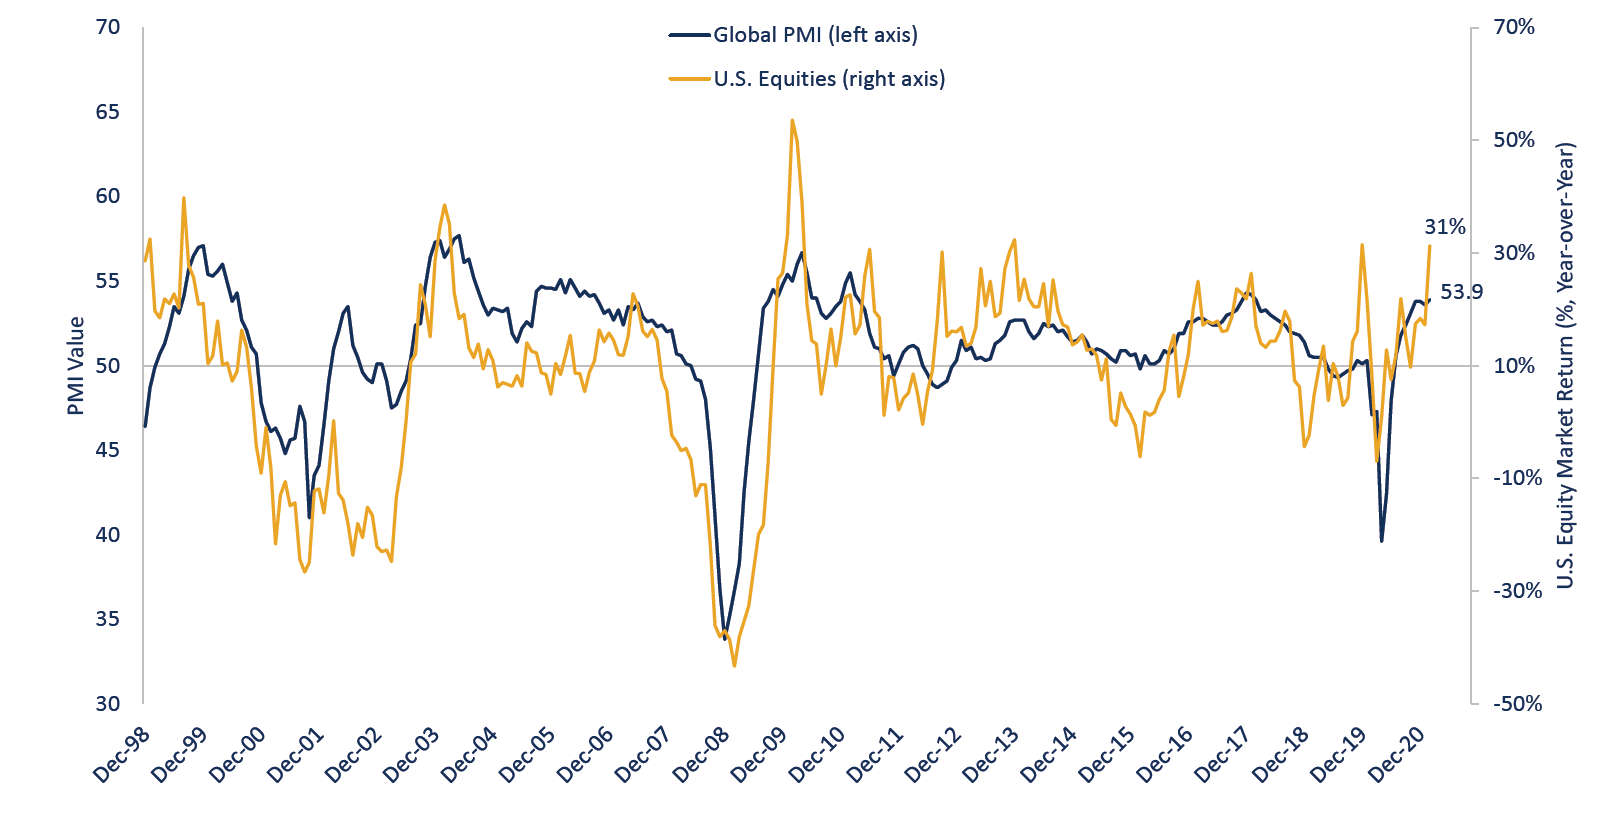
Based on the historical relationship between U.S. equity market growth and global growth expectations (Figure 1), we do not currently see any significant disconnect, but can growth expectations be used to provide insight into future equity market returns?
Content continues below advertisement
Figure 1. Relationship between global growth expectations and U.S. equity market returns
Source: Innealta Capital. Time frame 12/31/1998 to 02/28/2021. Frequency monthly. “Global PMI” refers to the JP Morgan Global Purchasing Managers Index. “U.S. Equities” refers to the S&P 500 Total Return Index. Past performance is not indicative of future returns.
CONNECTING TENDENCIES IN GROWTH EXPECTATIONS WITH EQUITY MARKETS
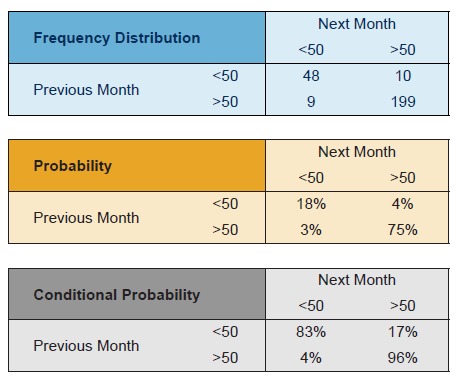
Purchasing Manager Indices (“PMI”) data are a useful tool in macroeconomic analysis. They represent corporate purchasing managers’ expectations, and the surveys, which are used to calculate the PMI value, are conducted monthly. The data is organized such that a PMI value greater than 50 suggests growth, while any PMI value less than 50 indicates contraction. Figure 1 shows that the PMI data, which references the JP Morgan Global PMI index, exhibits extended periods where the value is either above or below 50. Additionally, the figure shows that when PMI is greater than 50 in a given month, it is likely to be greater than 50 the following month. The data suggests the same behavior when PMI is less than 50 in a given month. Figure 2 shows the frequency distribution, probability distribution, and conditional probability distribution for the JP Morgan Global PMI and highlights this trending behavior. Assuming that history is likely to repeat, we can use this trending behavior in conjunction with asset prices to help guide investment decisions.
Figure 2. Historical Distribution of JP Morgan Global PMI
Source: Innealta Capital and Bloomberg. Time frame 12/31/1998 to 02/28/2021. Frequency monthly. Frequency Distribution refers to the number of occurrences of each event. Probability refers to the number of occurrences of each event divided by the total number of occurrences. Conditional Probabilities refers to the number of occurrences of an event divided by the sum of all occurrences with the same starting state. Past performance is not indicative of future returns.
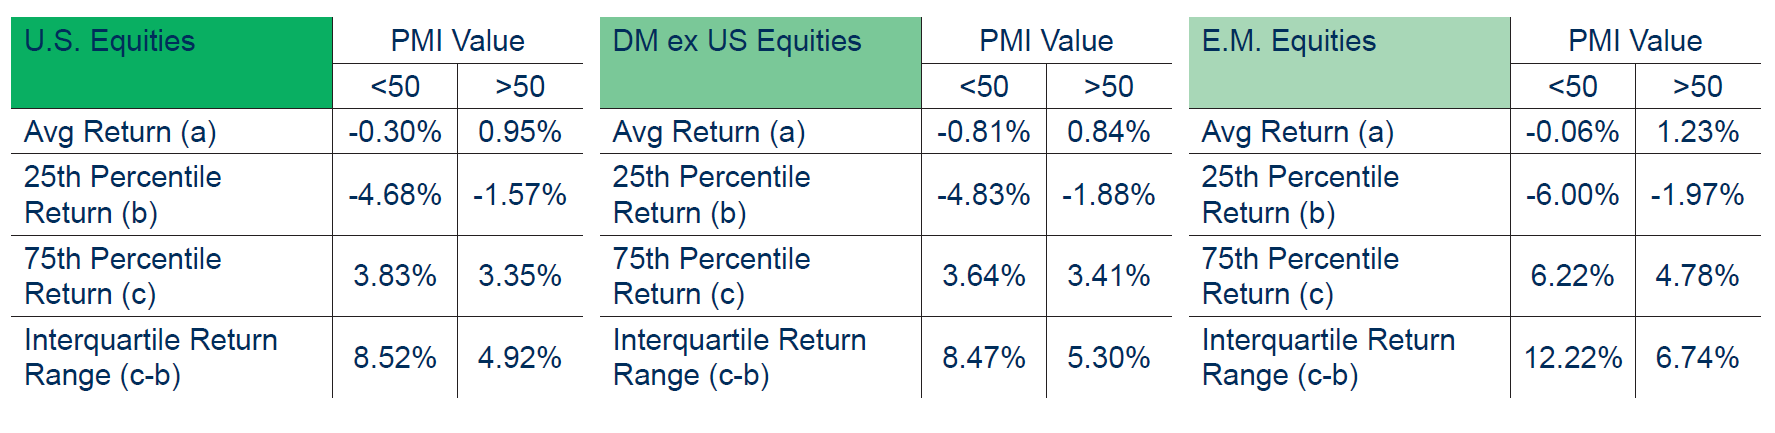
As theorized, we would expect equity markets to produce positive performance during periods of macroeconomic growth. To measure our assumptions, we compared the observed returns of U.S. equities, Developed Market ex-U.S. equities, and Emerging Market equities against the JP Morgan Global PMI data from December 1998 to February 2021. Figure 3 provides the performance and risk summary for each equity market.
Figure 3. Performance & Risk summary
Source: Innealta Capital. Time frame: 12/31/1998 to 02/28/2021. Past performance is not indicative of future returns. “PMI” refers to the JP Morgan Global PMI value. “U.S. Equities” refers to the S&P 500 Total Return Index. “D.M. ex U.S. Equities” refers to the MSCI EAFE Net Total Return Index. “E.M. Equities” refers to the MSCI Emerging Market Net Total Return Index.
SUMMARY
After observing the relationship between the JP Morgan Global PMI and the monthly returns of various broad-based equity markets, we found three key takeaways:
- We observe that equity markets tend to produce positive monthly performance across each equity market when PMI values are greater than 50 and produce negative monthly performance when PMI values are less than 50.
- We see that the return distribution is much larger when PMI values are less than 50 than when PMI values are greater than 50. A larger return distribution is indicative of more risk.
- Finally, we also observe that the equity market returns when PMI values are greater than 50 are more positively skewed than the equity market returns when PMI values are less than 50.
Using this historic relationship between PMI and market returns, one can expect a greater chance of positive equity returns in the near-term future if the PMI value is greater than 50, holding all else equal.
In our simplistic approach to analyzing equity markets, we see that as macroeconomic growth expectations increase, equity market returns tend to exhibit higher returns than when macroeconomic growth expectations decrease. Given the inherently complicated nature of financial markets, we would not suggest using PMI in isolation to drive portfolio decisions. Instead, we believe that PMI is one of many variables investors have in their toolkit which can better inform their investment decisions.
IMPORTANT NOTES
The MSCI Emerging Market Index is a free floated market capitalization weighted equity index that covers large and middle capitalization corporations across 27 countries categorized by MSCI as emerging market countries. The MSCI EAFE Index is a free float market capitalization weighted equity index that covers large and middle capitalization corporations in 21 of the 23 developing market countries excluding the United States and Canada. The S&P 500 Total Return Index is a market capitalization weighted equity index of the top 500 corporations in the United States.
This material is for informational purposes and is intended to be used for educational and illustrative purposes only. It is not designed to cover every aspect of the relevant markets and is not intended to be used as a general guide to investing or as a source of any specific investment recommendation. It is not intended as an offer or solicitation for the purchase or sale of any financial instrument, investment product or service. This material does not constitute investment advice, nor is it a substitute for such professional advice or services, nor should it be used as a basis for any decision or action that may affect your business. Before making any decision or taking any action that may affect your business, you should consult a qualified professional adviser. In preparing this material we have relied upon data supplied to us by third parties. The information has been compiled from sources believed to be reliable, but no representation or warranty, express or implied, is made by Innealta Capital, LLC as to its accuracy, completeness or correctness. Innealta Capital, LLC does not guarantee that the information supplied is accurate, complete, or timely, or make any warranties with regard to the results obtained from its use. Innealta Capital, LLC has no obligations to update any such information.
For more publications, please visit our website www.innealtacapital.com/insights
The colorful steel containers by Potato Tomato/Shutterstock.com
732-INN-03/17/2021
Enjoyed this article? Sign up for our newsletter to receive regular insights and stay connected.