
Amplify ETFs just launched a new ETF called the Amplify Natural Resources Dividend Income ETF (NDIV) which owns a portfolio of global dividend-paying companies in natural resources commodity-related industries. Thanks to rising energy and commodity prices, many companies in these industries are generating excessive amounts of free cash flow that will be returned to shareholders. The ETF is also a play on the energy transition and commodity supercycle, expected to offer inflation-resistant high yields for many years to come.
New ETF NDIV Offers High, Inflation-Resistant Yield (NYSEARCA:NDIV)
Are we in an Early-Stage Commodity Supercycle?
A commodity price supercycle is an extended period of time during which commodity prices are above historical norms. There have been two occasions in the past 50 years coined “commodity supercycles” – the end of the Bretton Woods system in the early 1970s, which ended in the collapse of oil prices in 1986; and the period from 2001 to 2014 fueled by rapid growth in demand from China, the U.S. shale boom, and post global financial crisis stimulus.
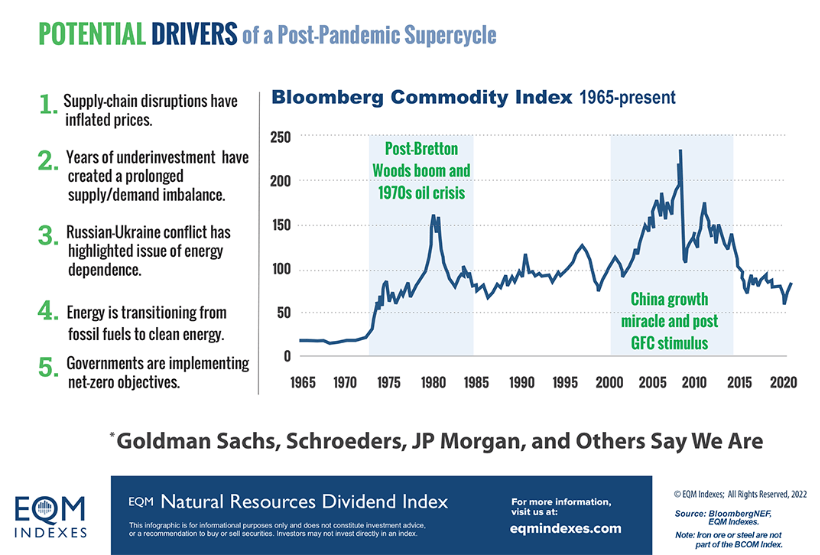
In October of 2020, Goldman Sachs came out with a prediction that commodities, spurred in part by pandemic-related supply chain constraints, were entering a supercycle that could last years and possibly a decade. Other asset management firms such as JP Morgan, Citi, and Schroders also share that viewpoint. At the core of its thesis is not only a structural decline of supply across the entire commodity complex, but also a structural rise in demand, creating the conditions for a commodity supercycle with multi-year potential.
The energy and metals markets have been boosted by an upturn in demand aligned with the energy transition from “old energy” to forms of “new energy” which are more environmentally, carbon friendly. In November 2021, Jeff Currie, Global Head of Commodities Research at Goldman Sachs, reiterated we are just in the “first inning of a multi-year potentially decade-long commodities supercycle.”
Years of Underinvestment, Prolonged by ESG
Further bolstering the commodity supercycle thesis is the redirection of capital over the last five years, in part due to poor past returns, from old economy exploits such as energy and mining, towards clean and renewable energy endeavors.
Big oil spending is half that of 2013, the last time when crude oil prices topped $100. And with the writing on the wall regarding the future potential for fossil fuels, energy companies are increasingly reluctant to allocate capital toward new exploration and production. This explains why, even in a rising commodity price environment, energy and mining companies are reluctant to commit capital.
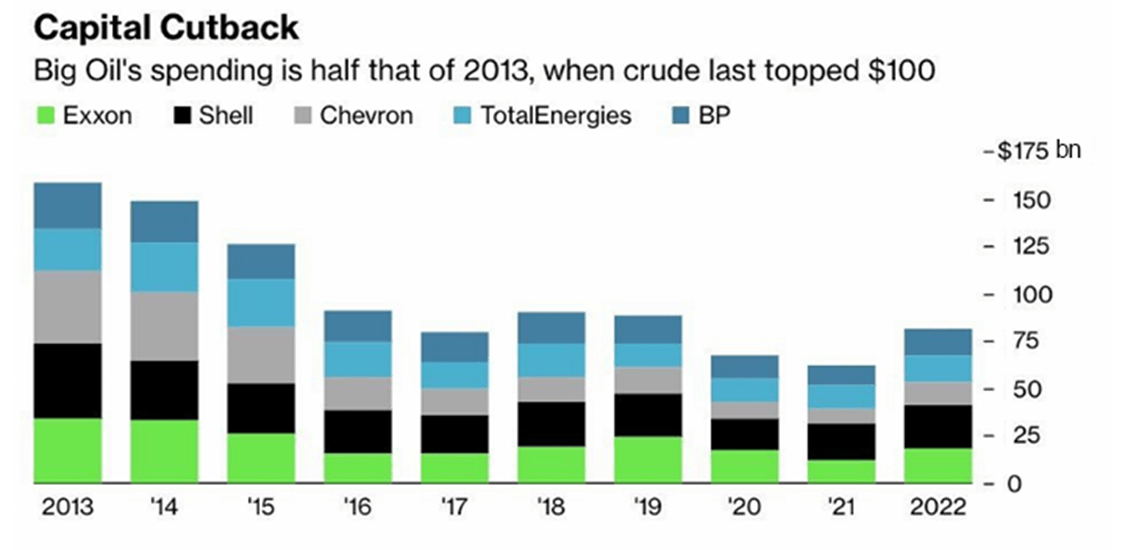
dataNote: Full-year 2022 figures are companies’ guidance.
As Schroder’s fund manager James Luke explains:
“Commodity investments, particularly in the energy and the metal space, are very long-cycle, essentially involve an investment of 15 to 20 years. Most observers and government officials are telling you that oil demand is going to collapse in five years as the world transitions to clean energy. Why would you want to make multi-billion-dollar investments into something which could well be a stranded asset less than halfway through the life of the asset?”
Green Infrastructure Boom
Bloomberg New Energy Finance estimates that $800 billion out of over $12 trillion in post-pandemic fiscal stimulus is specifically targeted toward “greener” forms of energy. World governments are phasing out the sale of internal combustion engine aka ICE vehicles in order to meet their net-zero carbon emission goals.
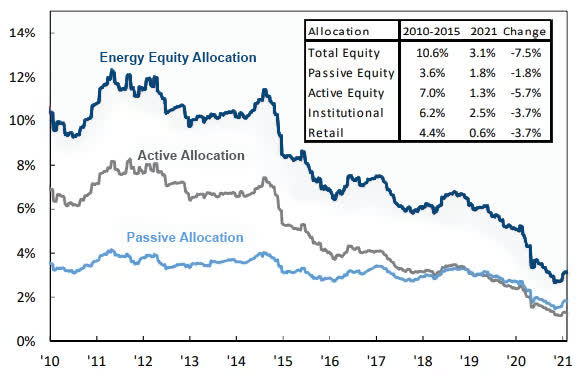
Oil companies see the writing on the wall and are reluctant to invest back in themselves. And, up until recently, external fund allocations to the energy sector have also been in prolonged decline. In the period between 2010-2015, the average allocation to energy was 10.6%. That has now dropped to 3.1% as seen in the chart below.
Fund Allocations to Energy Have Steadily Declined in Recent Years[1]
Similar to what has happened in energy, the mining industry has also been starved of investment, both inside and out. There has been a lack of investment from outside as ESG guidelines prevent outside capital from being allocated to the mining sector. Ironically, a decarbonized future requires metals like copper, tin, silver, lithium, cobalt, palladium, platinum, nickel, manganese, and rare earths.
And, also similar to energy, the industry is still wary of investment itself. It still has memories of 2013-2014, when mining had, as metals analyst, Nicholas Snowden of Goldman Sachs puts it, a “near-death experience.” This near-death experience followed the boom of the 2000s, aka the last commodity supercycle, when it seemed that metals and energy prices could only go higher, driven by insatiable demand from China for natural resources and the money printing post-2008 global financial crisis period, which boosted asset inflation.
Implications of the Invasion of Ukraine
The invasion of Ukraine by Russia in March of 2022 has further accelerated the supercycle in commodities, creating the biggest upheaval for commodity markets since 1973. While the 1973 crisis was created by a Middle East oil embargo, the current situation is not just a shock to oil prices, but includes almost every single commodity from grains, oil, gas, and metals to minerals. The war in Ukraine is likely to have longer-term consequences for global commodity markets as well. Numerous countries, including EU members, are undertaking measures to reduce their reliance on imports.
Return of Inflation, Fear of Recession
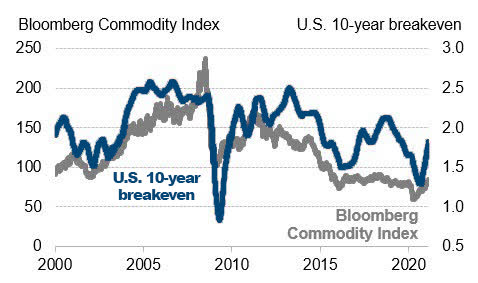
Another factor spurring commodity prices has been rising inflation. Inflation and commodity prices are highly correlated, broadly moving in lock step with each other as seen below, comparing the Bloomberg Commodity Index and the 10-year breakeven – the difference in yield between the 10-year treasury and an inflation-protected 10-year treasury. The chart below contrasts the daily closing values for the commodity index versus the 200-day moving average for the breakeven rate.
Central bank policies to curb inflation, COVID lockdowns and negative growth in China, and the fear of recession are all risks to the commodity supercycle thesis. Many commodity prices for items such as oil, wheat, and copper have declined recently on recessionary fears. A weaker economy, in theory, would curb demand, but as previously mentioned, the longer-term supply-demand dynamics continue to support the commodity supercycle thesis.
Compelling Case for Owning the NDIV ETF
Cash Flow Monsters
Thanks to higher commodity prices associated with the post-pandemic recovery and the Russian invasion of Ukraine, companies in the energy and materials sectors have raised their commodity price assumptions. For example, UK supermajor Shell recently announced it was reversing $3.5-$4.5 billion in writedowns due to higher price assumptions for oil and gas. Coming into the year, its price assumption for Brent crude oil was $60 per barrel from 2023, 2024, and 2025, and $65 per barrel over the longer term. As of the end of July, those assumptions have now been raised to $80 per barrel for 2023, $70 per barrel for 2024, and remain at $65 beyond that.[1] But the current price reality, is that Brent crude oil sits at $100 per barrel.
This is typical of companies in the energy and materials sectors right now, and natural resource and commodity-related producer companies are becoming “cash flow monsters.“
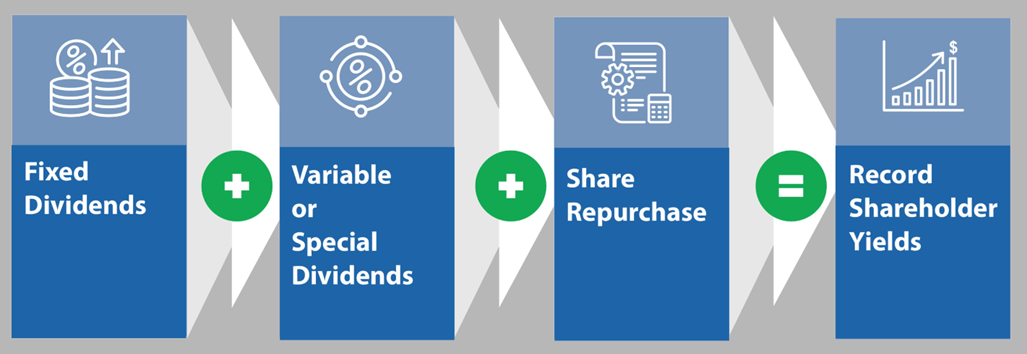
Facing the prospects of a long-term decline in demand for oil and gas, concerns about climate change, and the push to renewable energy, energy companies are taking their profits and rather than using that money to drill new wells are sending cash back to investors, doing one or a combination of three things:
1) paying down debt,
2) repurchasing shares, enhancing shareholder yield,
3) increasing their fixed dividends or paying special or variable dividends.
Declining Debt Levels
Record profits have provided companies the opportunity to pay down debt, with global corporate debt declining -1.9% over the last 12 months according to Janus Henderson. This marks the first period of global corporate debt decline since 2015, and the trend is expected to continue.
Elevated energy prices and a strong year-over-year $412bn USD operating profit rebound saw the global energy sector deliver the largest net debt decline. The strong year allowed the sector to achieve a -$155bn USD debt decline, wiping out the additional borrowing taken on during FY20 and FY21. Global energy closed out last year with the sector’s lowest leverage level since 2014. Elevated cash flows also allowed the mining sector to reduce its global debt by almost 25% year-over-year.[2]
While both the energy and mining sectors were able to pay down debt in the year past, utilities reported a large increase in debt levels amid pressures in the energy market and necessary investment to support the energy transition.
Going forward, both the energy and mining sectors remain cash flow generative, which should support continued debt reduction and the return of capital to shareholders.
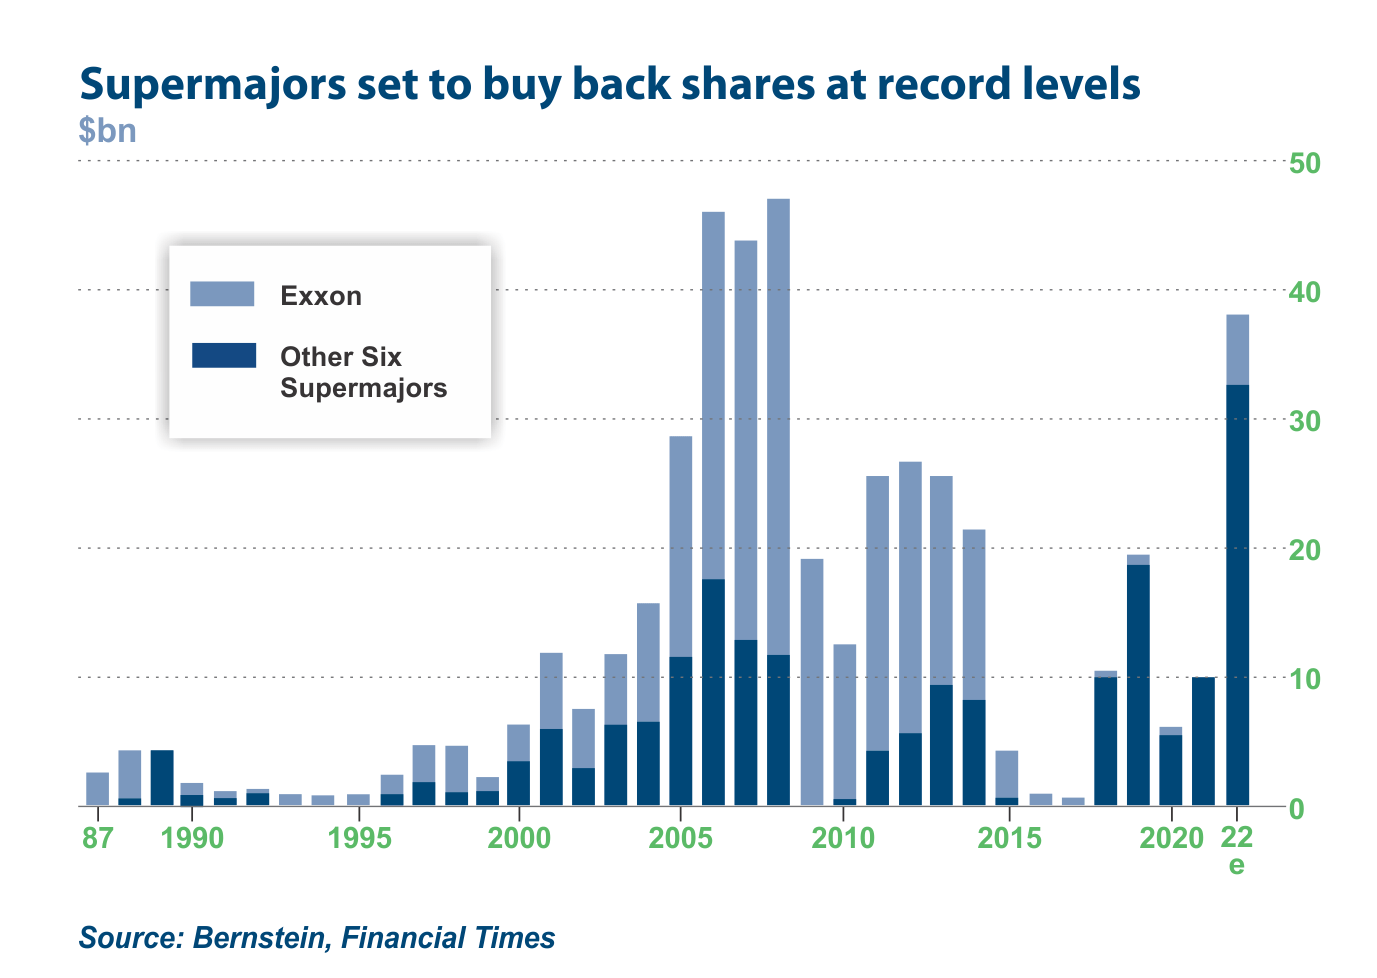
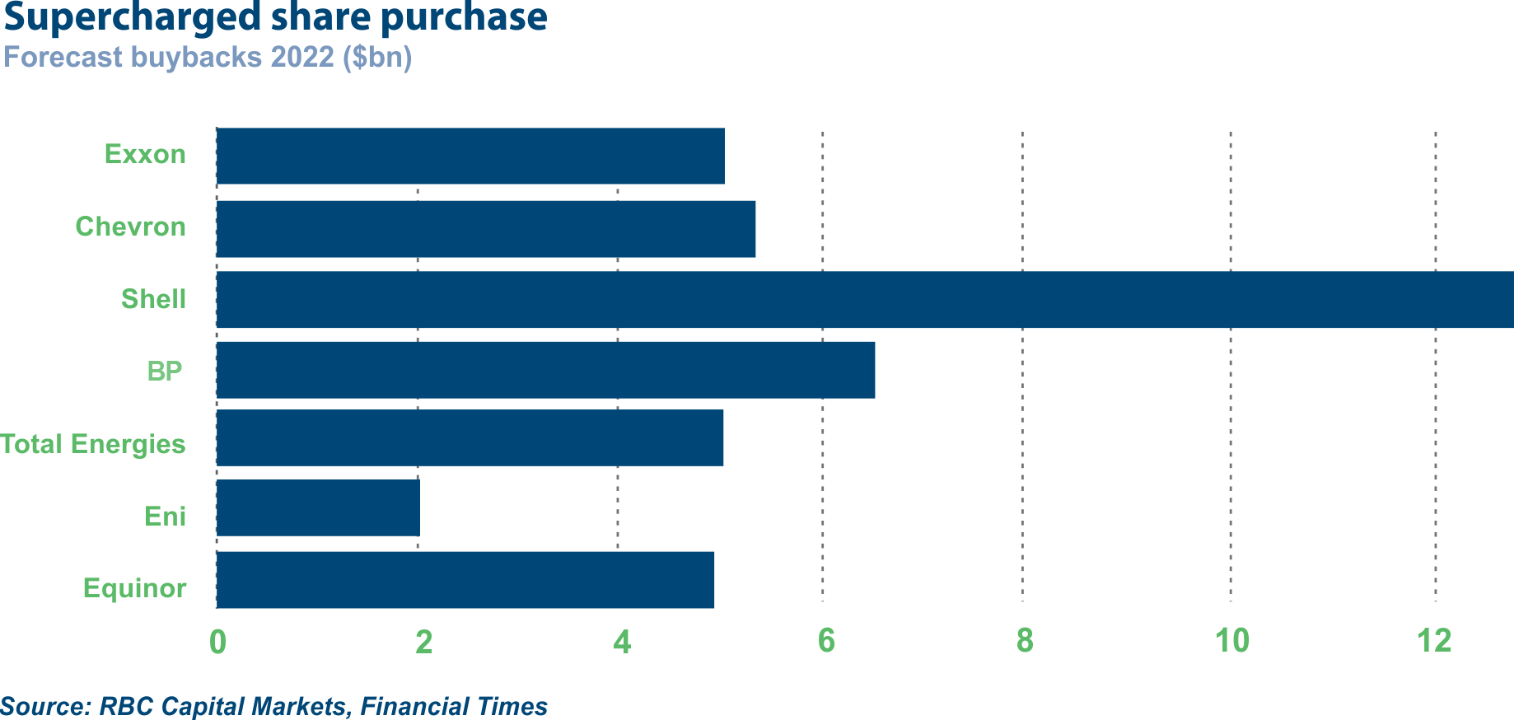
Share Repurchase
Share repurchase is another method of returning value to shareholders. Energy company majors have been buying back shares at record levels. Oil giants BP, Chevron, Exxon Mobil, Shell and TotalEnergies, are on track to spend $20 billion in buybacks in the first half of the year.[3]
Paying Dividends
According to Morningstar, energy sector dividends are the fastest growing dividend segment, growing faster than any other part of the U.S. equity market. Since 2018, the average dollar amount of dividends among energy companies has grown by over 50%. That’s up from just 5% growth for the prior three years. And since 2016, energy companies’ dividend amounts are up 80% for the five-year period.[5]
One of the new dividend options that energy companies are employing are variable dividends. For companies that are facing a host of uncertainty such as long-term demand, oversupply, and pleasing a shareholder base that wants both dividends AND plans for decarbonization, variable dividends have emerged as a nice compromise solution. Variable dividends allow companies to temporarily increase the size of their payments while cash flows are high without going into debt or cutting their dividends when cash flows are lower.
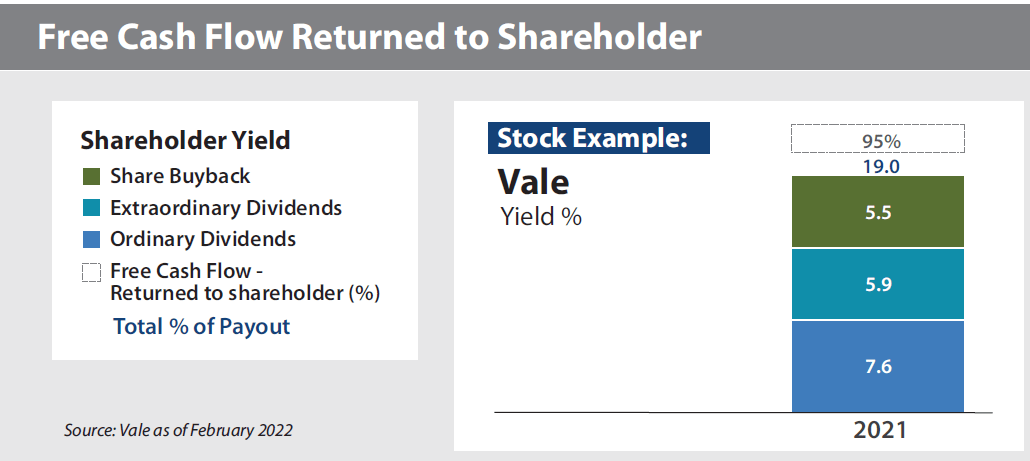
Looking at the company example below for Brazilian miner Vale, you can see how a combination of share buybacks, extraordinary dividends, and ordinary dividends resulted in a 95% payout of free cash flow returned to shareholders, equating to a shareholder yield of 19% in 2021.
Cheap Valuation
Despite the year-to-date run-up in commodity prices, valuation spreads remain quite reasonable on a historical basis. Looking at valuation spreads comparing the GSCI Commodity Index vs. the S&P 500 Index, the ratio of commodity prices to the market has ticked up but remains low.
Valuation Spreads – Commodity Prices in Context[6]
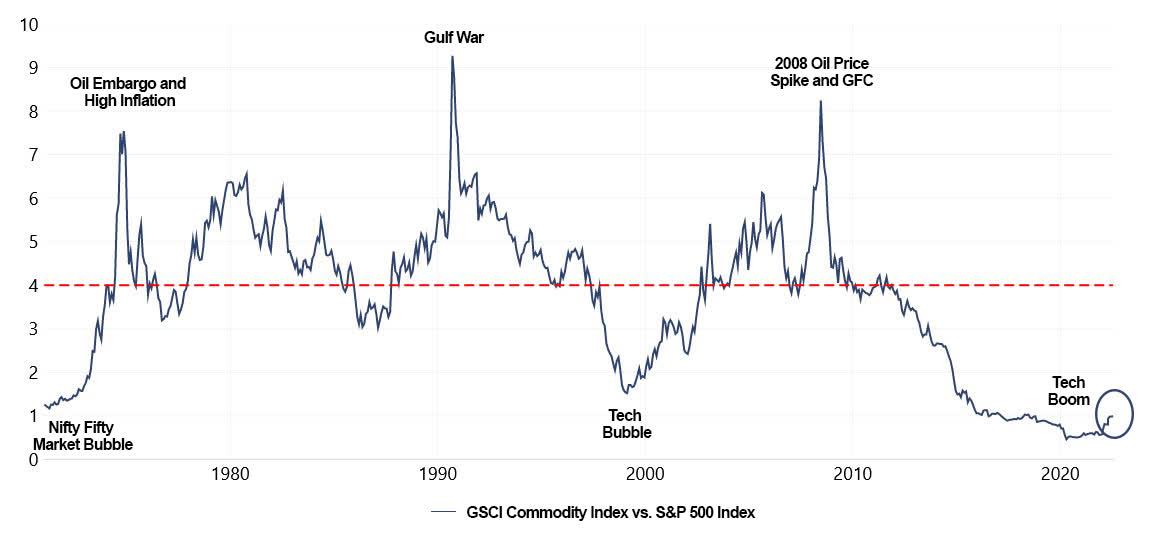
Down from record-high levels, natural resource and commodity producer stocks appear to be pricing in a recession. Current valuation levels for large cap energy stocks, for example, imply $60 oil and $3.50 natural gas, which is a significant discount from current pricing levels of around $100 for Brent Crude and $8 for U.S natural gas (as of 7/29/22).
Similarly, industrial metals like copper, aluminum, iron, and nickel are all trading off the record highs reached in March of 2022, off 20-30% from peak levels. China is the largest global consumer of commodities and parts of the country are still in COVID lockdown. Iron ore is the commodity with one of the largest exposures to China, which buys about two-thirds of all seaborne volumes.[7]
In the short-term, China’s imports of key commodities face severe headwinds in the second half of 2022, which could spell trouble for the commodity producers that rely on its economic engine to power demand for their energy, food, and materials. Copper, and copper ore, remain one bright spot among imports, and shipments of both continue to run ahead of last year.[8] But on a positive note, the China slowdown has brought down peak valuations. China’s problems appear finite in nature, brought on by its government’s COVID policies.
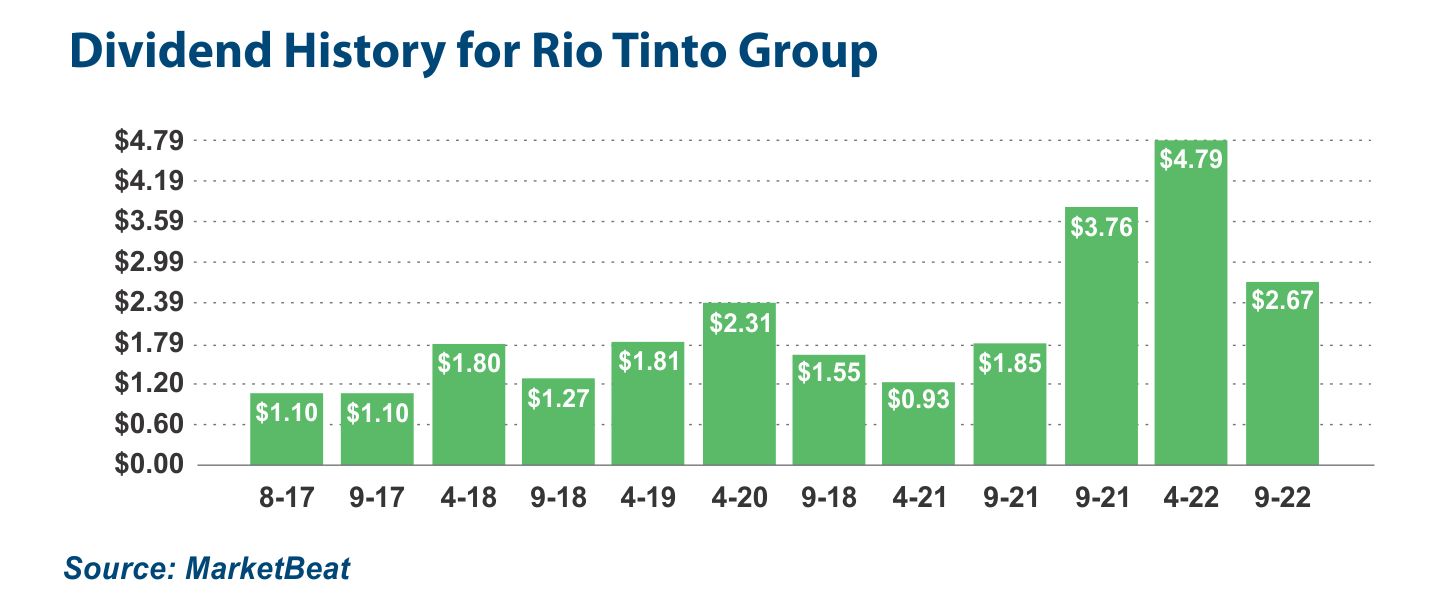
There have been a few metal companies like iron ore producer Rio Tinto (OTCPK:RTPPF, OTCPK:RTNTF) who have cut dividends on slowdown concerns, faced with lower prices and higher costs. In the era of climate change, many miners were also impacted by extreme weather conditions such as record high temperatures and flooding. Rio Tinto cut its dividend by 53%, but post the dividend cut the yield remains at 13.4%. The $4.3 billion USD half-year payout is still the second largest in the company’s history, and still well ahead of inflation.
China, which accounts for over two-thirds of global demand, is under less inflation pressure than the U.S. or Europe. That gives Beijing greater scope for stimulus, which in turn is cause for Rio investors to enjoy their large dividend yield with a degree of peace.[9]
The Unique Construction and Value Proposition of the Investment Approach
Investors are fighting multiple headwinds in the current market environment. Inflation is at 40-year high levels. To curb inflation, central banks are raising interest rates, which has spurred the worst bond market performance in 40 years. Income investors are in desperate need of investment solutions that provide a source of yield that will keep up with inflation.
Traditionally, real estate investment trusts (“REITs”) and real estate are a good source of income that keeps up with inflation. But higher mortgage rates and the pandemic’s disruption of many segments of the real estate market have made them a risky bet.
That leaves the Energy sector as a place to obtain inflation-aligned yield. Global Energy has delivered positive returns for the year AND above market yields. But the Global Energy market is being disrupted by climate change goals. While it looks attractive on a short-term basis, the long-term outlook is problematic.
At EQM, we had already developed several indexes focused on the mining and materials space that were a play on the energy transition theme from “old energy” to “new energy.” We saw the same trends in natural resources and commodity-related equities that we saw in energy, namely more demand than supply. There were many companies becoming “cash flow monsters.” Those cash flows were being paid to investors in the form of fixed dividends, variable and special dividends, and share buybacks.
While there are other products in the marketplace that provide equity exposure to natural resource and commodity-producer equities, none are specifically focused on generating the highest level of income. The components of the Index and ETF are weighted by the indicated dividend yield. As a result, we are able to achieve an income stream that will be among the highest for all exchange-traded fund (“ETF”) indexes, currently above 9%.
Methodology
The Amplify Natural Resources Dividend Income ETF (NYSEARCA:NDIV), is comprised of dividend-paying U.S. exchange-listed equities operating primarily in the following natural resource, commodity-related industries: energy (oil, gas and consumable fuels), chemicals; agriculture, precious and industrial metals and mining, paper products, and timber. As mentioned, each global company in the ETF is weighted according to their indicated dividend yield. To avoid undue concentration, the initial weights of all holdings are capped at a maximum weight of 5% at time of rebalance.
As mentioned, in the current inflationary environment of high energy and commodity prices, natural resource and commodity-related equity companies are in the “golden age” of free cash flow. Because these companies are not spending money on new capacity, balance sheets are becoming debt free, and free cash flow is being returned to shareholders in the form of: 1) increasing fixed dividends; 2) high variable or special dividends; and 3) share repurchases.
Many of the holdings are large global players in energy and materials, not based in the U.S. This can create the issue of foreign tax withholding. In order to avoid that issue, the index is composed only of companies trading on a major U.S. exchange or as an U.S. OTC-listed ADR.
To be included, companies must also meet the following additional criteria:
- Constituent business operations must derive more than 50% of their revenues from the following natural resource, commodity-related industries: energy (oil, gas and consumable fuels), chemicals; agriculture, precious and industrial metals and mining, paper products, and timber.
- Constituents must be at least $5 billion USD in market capitalization.
- Constituents must have an average daily traded value of at least $2 million USD over the last six months.
- Constituents must have an indicated dividend yield of at least 3% annually.
- Country of domicile not Russia and/or the security must be eligible for investment without restriction as determined by the index provider.
Source: EQM Indexes
Backtested Index Performance
What performance and income level has this approach generated during the backtested period since its April 27, 2020 inception to July 31, 2022? The Index has generated a cumulative return of 120.8% versus the Morningstar Global Upstream Natural Resources Index at 78.6%.
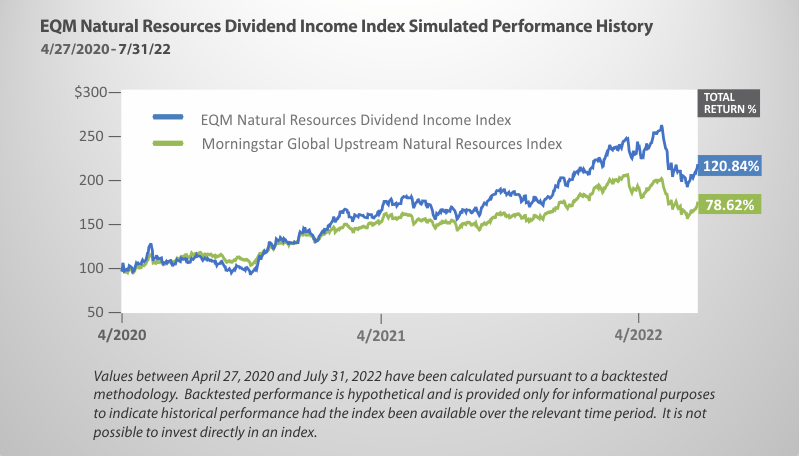
In addition, the indicated dividend for the Index as of 7/31/22 was 9.17% versus 4.66% for the Morningstar Global Upstream Natural Resources Index. The ETF should pay a monthly dividend in line with that of the indicated dividend yield of the index.
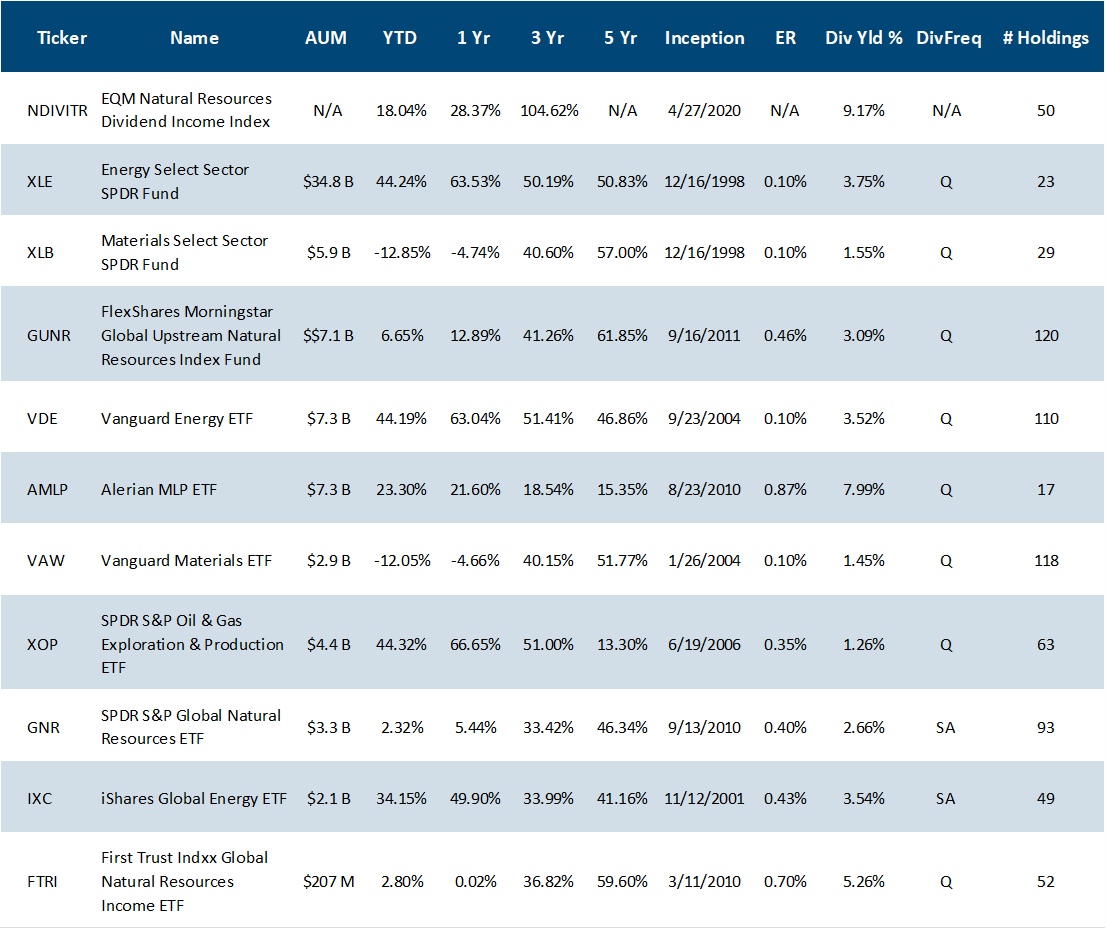
Competitive Analysis
Here is how the hypothetical Index compares to other similarly exposed products available as ETFs in the marketplace:
The Index, licensed by Amplify ETFs, is tracked as the Amplify Natural Resources Dividend Income ETF. Here are the ETF’s current top 10 holdings and corresponding weights:
NDIV ETF Top 10 Holdings
Data as of: August 29th, 2022; Amplify ETFs.
| TOP 10 HOLDINGS | |
|---|---|
| PETROLEO BRASILEIRO SA PETROBR SPONSORED ADR5.41%CHINA PETROLEUM & CHEMICAL CRP SPON ADR H SHS4.89%ECOPETROL S A4.52%PIONEER NAT RES CO4.38%RIO TINTO PLC4.05% | BHP GROUP LTD3.64%ICL GROUP LTD3.40%DIAMONDBACK ENERGY INC3.19%DEVON ENERGY CORP NEW3.09%SOUTHERN COPPER CORP3.01% |
Fund holdings are subject to change at any time and should not be considered recommendations to buy or sell any security.
Key Takeaways
- In the current market environment, investors are starved for reliable forms of inflation-proof dividend yield.
- Many large firms believe we are in a commodity supercycle spurred in the near-term by pandemic-related supply chain issues, but supported in the long-term by supply-demand imbalances and the energy transition.
- The index provides exposure to both legacy “old energy” players AND the “new energy” materials and natural resources required for a greener future.
- Due to years of underinvestment and ESG headwinds, the companies in the index are generating huge amounts of cash flow that is expected to be returned to shareholders in the form of rising dividends, special and variable dividends, and share repurchases.
- The product’s dividend weighting methodology is designed to maximize income. Additionally, investors can gain exposure to these global “cash flow monster” dividends on U.S. exchanges, thus eliminating foreign tax withholding.
[1] Rob Watts, Shell reverses up to $4.5 billion in writedowns on stronger oil price outlook, Upstream Online, July 7, 2022.
[2] Danielle Austin, Global Corporate Debt is Shrinking, FNArena, July 13, 2022.
[3] Isabella Simonetti, Oil giants are pumping billions of dollars into buying their own shares, New York Times, July 29, 2022.
[4] Charts from Bernstein and RBC Capital Markets as reported by the Financial Times in The Daily Shot, May 4, 2022.
[5] Lauren Solberg, Why Energy Stocks Are Gushing High Dividends, Morningstar, February 9, 2022.
[6] Incrementum, In Gold We Trust report, SPX GSCI Ratio Chart – In Gold We Trust
[7] Clyde Russell, China-Exposed commodities take a COVID-control tumble, Reuters, April 26, 2022.
[8] Bloomberg News, China’s Hunger for Commodities Is Wavering After Years of Growth, July 26, 2022.
[9] Ed Cropley, Rio’s dividend is not yet a cause for concern, Reuters, July 27, 2022.
Enjoyed this article? Sign up for our newsletter to receive regular insights and stay connected.