
RPV tracks the S&P 500 Pure Value Index, selecting 120 large-cap companies with the lowest price-book, price-earnings, and price-sales ratios. RPV is soundly beating ETFs that track the more broad S&P 500 Value Index this year, but its concentration risks are too high with a possible recession on the horizon. Besides poor diversification, there are other concerns involving low profitability, questionable earnings growth, and negative earnings trends.
RPV: Why I’m Downgrading The S&P 500 Pure Value ETF (NYSEARCA:RPV)
Investment Thesis
The Invesco S&P 500 Pure Value ETF (NYSEARCA:RPV) is one option for investors wanting a guaranteed low P/E portfolio, but it’s key to remember that such guarantees often come at a cost. Not only is RPV’s 0.35% expense ratio slightly elevated, but there are significant sacrifices on volatility, diversification, and quality that you should consider before purchasing. This article details those sacrifices using the SPDR S&P 500 Value ETF (SPYV) as its benchmark and argues that although near-term outperformance is possible, RPV is too risky now for the average investor.
ETF Overview
RPV tracks the S&P 500 Pure Value Index, selecting 120 S&P 500 companies with the most attractive value characteristics. The three ratios considered are book value to price, earnings to price, and sales to price. These are the same ratios used for the broader Value Index, but the key difference here is that there is no overlap with the Pure Growth Index. Therefore, it’s best for investors looking to deploy capital to value stocks in the most efficient way. The main caveat is that there will be significant diversification sacrifices, so I recommend it only as a complementary product to a well-balanced portfolio.
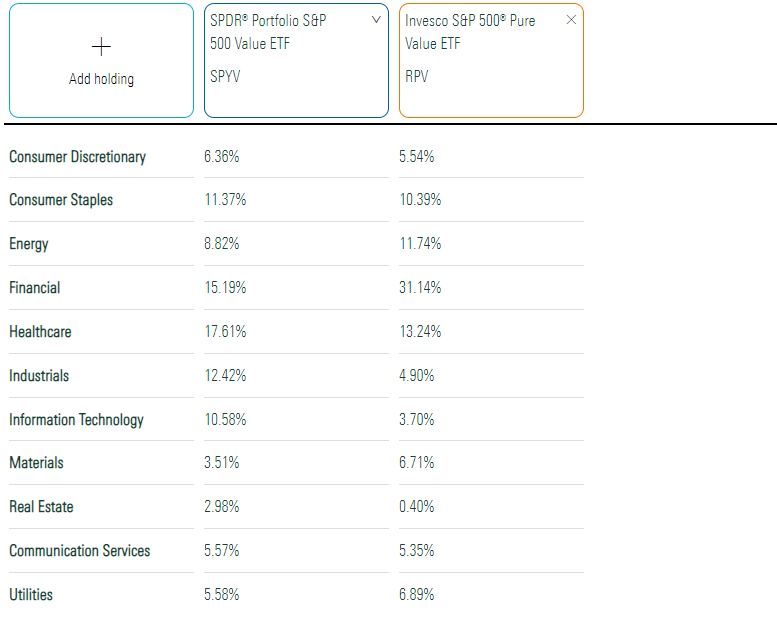
We can see those diversification sacrifices in the table below. RPV has 31.14% exposure to the Financials sector compared to 15.19% for SPYV. Health Care, Energy, and Consumer Staples stocks also have double-digit weightings; otherwise, it’s an undiversified portfolio.
The Financials sector, specifically the insurance industry, is favored by value investors because relatively low valuations are commonplace. Four examples are in RPV’s top ten holdings: MetLife (MET), Prudential (PRU), Allstate (ALL), and Everest Re Group (RE), which have low price-sales ratios (0.89, 0.60, 0.70, and 1.07). Overall, RPV’s weighted-average price-sales ratio is just 1.14, significantly different than SPYV’s 3.30 figure.
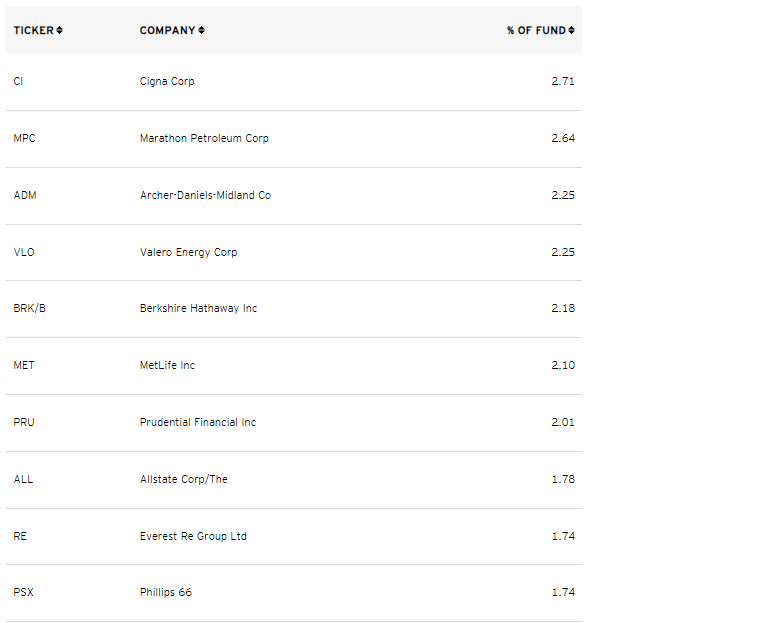
Finally, RPV is a factor-weighted ETF, while SPYV is free-float market-cap-weighted. RPV’s top two holdings, Cigna (CI) and Marathon Petroleum (MPC) are companies this weighting scheme impacts most. Their weights in SPYV are just 0.58% and 0.35%. In particular, most large-cap Energy stocks appear cheap today, and investors should closely monitor their exposures to this sector, given the unpredictability of oil prices. I’m comfortable with RPV’s exposure today, but valuation isn’t a factor I rely on much with Energy stocks.
Performance Analysis
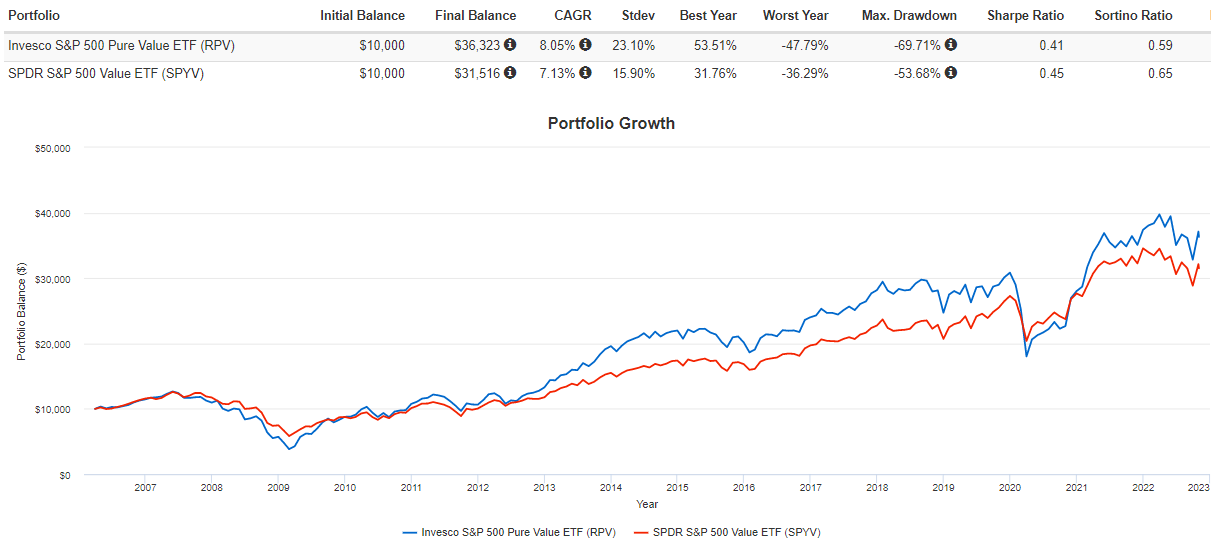
The extreme differences in the two portfolio’s composition translated into much higher risk but, ultimately, better total returns for RPV. Since March 2006, RPV is up an annualized 8.06% vs. 7.13% for SPYV, though its risk-adjusted returns (Sharpe and Sortino Ratios) were worse because of the higher volatility.
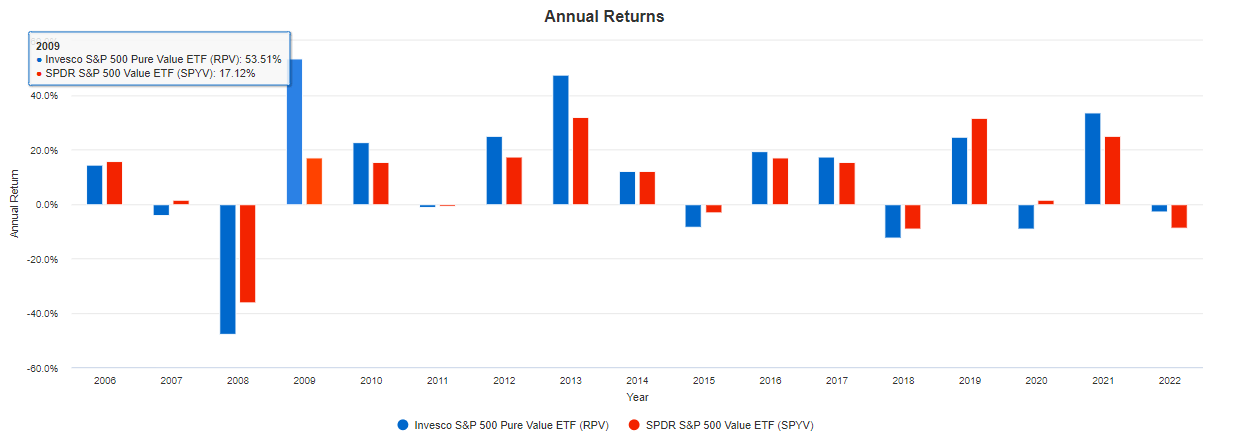
A look at the annual returns suggests timing is essential. RPV outperformed 53.51% to 17.12% in 2009, which I assume resulted from the extreme risk-on environment that year. In most years, RPV underperforms when the market is down and vice versa. However, it’s bucking the trend this year, down just 2.89% compared to SPYV’s 8.83% decline. One reason is that insurance companies benefit from higher interest rates, and there are 16 in RPV.
While higher interest rates are beneficial for now, a recession will likely reverse any recent outperformance. Investors can look to insurance ETFs for guidance on what could happen in such a scenario. During the subprime crisis from November 2007 to March 2009, the iShares U.S. Insurance ETF (IAK) lost 70.34%. The equal-weighted SPDR S&P Insurance ETF (KIE) didn’t fare much better, losing 67.75%.
Of course, no two recessions are the same, but the life insurance companies that RPV overweights tend to be more volatile than the broader market. So are its three Oil & Gas Refining & Marketing holdings: Marathon Petroleum, Valero Energy (VLO), and Phillips 66 (PSX). Earlier this month, the Conference Board Recession Probability Model spiked to 96%, so all investors may want to take steps to safeguard their assets.
Fundamental Analysis: RPV Vs. SPYV
When designing a portfolio, I aim for coverage across several areas, including volatility, growth, valuation, earnings momentum, and profitability, which I use to define quality. The following table highlights these metrics for RPV’s top 25 industries. Have a look, and I will offer my comments afterward.
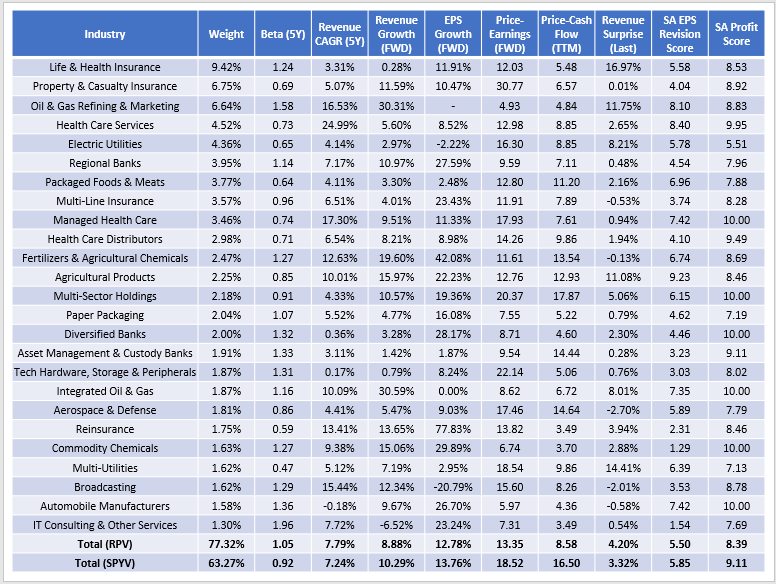
First, the higher volatility is reflected in RPV’s 1.05 five-year beta. SPYV’s 0.92 is about average for large-cap value ETFs, but it’s worth reiterating that “pure value” doesn’t equate to more safety. The Financials stocks in RPV aren’t necessarily more volatile than the ones in SPYV, it’s just that there are more of them. When deciding if RPV is appropriate, investors should ask themselves how important it is that they reduce their risk.
Second, I’m impressed with RPV’s overall growth profile, indicating its constituents are estimated to grow earnings by 12.78% over the next twelve months. Due to higher interest rates, RPV’s Regional Bank holdings have a 27.59% earnings growth rate, and Everest Re Group, representing the Reinsurance industry, has a 77.83% estimated growth. These figures are enormous compared to where we were in January. Since then, average estimated EPS growth has grown by 13% for RPV’s Financials sector holdings, and prices have only declined by 5%.
Third, overall profitability is somewhat low for a large-cap portfolio. Using Seeking Alpha’s Profitability Grades for each security, which consider standard metrics like return on equity, gross profit margins, and operating cash flow, I’ve calculated an 8.39/10 score for RPV compared to 9.11 for SPYV. The difference may seem minor, but it’s not, considering RPV’s score is near the bottom of the large-cap value category. SPYV’s score is only average, and both are well behind the 9.55 for the Vanguard Mega Cap Value ETF (MGV). Readers should accept that at least part is the valuation discount is attributed to inferior profitability, which makes sense in an efficient market.
Another shortcoming is a weaker Seeking Alpha EPS Revision Score of 5.50 vs. 5.85 for SPYV. If you ever want to keep tabs on Wall Street sentiment, this is an excellent and objective way. Based on current weightings, RPV’s score in January was 5.95, and the decline reflects the problematic environment. Part of it is higher interest rates and the fear that the Federal Reserve won’t achieve a soft landing, making a recession inevitable. Another part is just weaker earnings surprises. If Yardeni Research’s 2.9% earnings surprise figure holds, that will make this the “least surprising” quarter in over eight years.
Investment Recommendation
RPV has done well since I initially rated it a buy in March. The value factor overcame the higher volatility, and its Financials holdings have benefited tremendously from higher interest rates. Its selection method virtually guarantees it to trade at low valuations, and that’s a key selling point for those who want to allocate their capital to the cheapest stocks efficiently.
I’m cautiously optimistic about RPV, but I no longer recommend investors buy it. Owning a concentrated high-volatility ETF for too long is not prudent, especially given the real recession risks over the next year. Furthermore, I wonder if RPV’s holdings will achieve the projected earnings growth given the downward trend in analyst EPS Revisions. Market sentiment is negative, and I prefer less volatile and more diversified portfolios at the moment. Thank you for reading, and I look forward to answering any questions or comments you may have below.
Enjoyed this article? Sign up for our newsletter to receive regular insights and stay connected.