
“No man is better than a machine, and no machine is better than a man with a machine.” – Paul Tudor Jones
The idea came to legendary hedge fund manager Paul Tudor Jones when he and his data scientist son Jack were repeatedly unable to win in fantasy football. For those of you too young to remember, Tudor Jones made his bones as a hedge fund hotshot by predicting and shorting the 1987 Crash. It made him his first $100 million. which was real money in those days. You might think it was a random bit of luck except that he repeated it three years later by shorting the Japan Crash of 1990. A famous 1988 documentary profiling Tudor Jones (you can google Trader) focused on his obsessive attention to detail and incredible work ethic. Things got harder for his hedge fund during the decade of hyper-low rates and starting in 2017 he began to hire more mathematicians and statisticians in an effort to improve upon unaided human judgments. Both father and son began to ask whether the use of math and data might actually work for real NFL teams.
It wasn’t an altogether new idea. Pro Football Focus already published ratings employing a number of metrics which were used by NFL General Managers. The important one included making draft picks, trading players, and pursuing free agents. They had easily worked out the fact that the three most important factors in building a winning NFL team were controlling market cap, avoiding injuries, and putting together a talented 53-man roster.
In almost every respect the challenge in football is harder than in baseball. Ever since the publication of Money Ball and the eponymous Brad Pitt film the new baseball analytics, saber-metrics as they are sometimes called, have had a crossover impact in finance. It started with the fact that baseball, unlike football, had no hard salary cap so that the rich major market teams have a huge advantage. It’s no accident that the Yankees have won more often than most teams. They are happy to pay up for great players and pay the tax the league imposes. Small market teams with little money rarely win.
The premise of Money Ball was that you could assemble a great baseball team from statistical data without paying up for expensive star players. The first great result was produced by the Oakland A’s under GM Billy Beane who couldn’t afford superstars and instead worked with a data scientist to maximize the resources he had. It worked in Oakland well enough and long enough that most baseball teams copied it and hedge fund managers began trying to think like Billy Beane.
Baseball is easy because it is to a large degree an individual sport. The outcome is a summation of individual performances plus an element of chance. Individual performances are readily measured by such updated modern statistics as percentage of the time getting on base and on-base-plus-slugging (power hitting) while evaluation of pitchers starts with simple metrics such as the ratio of strikeouts to walks per nine innings. The various metrics sum to WAR – Wins Over Replacement. If you lose a superstar power hitter to a higher bidder you just replace him with two pretty good but less costly players who together have above average OPS and WAR. There’s a catch. Analytics works best with the benefit of the Law of Large Numbers. Billy Beane’s A’s did well in the 162 game regular season but less well in a short playoff series. In post season play superstars seem to matter more and randomness has greater impact. Billy Beane’s Oakland A’s never won a World Series.
What makes football hard comes down to the big three: market cap, injuries, and the challenge of building an outstanding 53-man roster. The market cap based on a three-year average is absolute so football GMs must be highly focused on the way they spend money on players. Stock portfolios have the same capital challenge. What you spend on one stock you can’t spend on another. Both football teams and stock portfolios often maintain a cash reserve to deploy in the event future opportunities arise. Football injuries are frequent, with new injury reports daily, while the Injured Reserve list is open to abuse and thus has strict rules. Both market cap and injuries are factors in putting together the 53-man roster, but the largest factors are the annual draft, free agency, and trades. Roster composition is where detailed analytics come into play while market cap and injuries are more in the nature of a framework within which the team roster functions.
Football is a team sport with some resemblance to Navy Seal training. It has to be carried out by eleven players each of whom has to do his job with precision timing in coordination with others. It requires not only skilled players but repeated rehearsals of the action required to perform tasks like taking down a hostage situation. The stocks in your portfolio don’t have to take down terrorists, but it helps if they are interactive in such a way as to reduce risk. This is harder than one might think, and the mix can change when confronted with a new threat such as the pandemic lockdown and fallout from the Ukraine-Russia war.
What Exactly Are Analytics?
The basic function of analytics involves turning a stock or an individual athlete into numbers. Does this reduce the fascination and excitement of the activity? Not if your primary focus is on achieving your goal. That being said, analytics may have come to plague baseball. The Yankee owners at the time did not value Babe Ruth as a bundle of numbers (although his were astonishingly good) but because his enormous home runs put paying customers in the seats. His larger than life personality not only built Yankee Stadium but put baseball on the global map. Japanese soldiers made banzai charges in WWII shouting “To hell with Babe Ruth!” I doubt that in WWIII enemies will push buttons while screaming “To Hell with Mike Trout!”
With baseball now grounded in saber-metrics fans are less engaged when their home team is not a contender. Television statistics revealed that few viewers outside of Houston and Philadelphia gave a hoot about the recent World Series. Advertisers paying top dollar must have been less than delighted. So far football does not have that problem thanks in part to broad interest in fantasy football and the NFL’s skill at putting on a grand spectacle. The Super Bowl continues to draw fans from everywhere in part because the league is structured for close competition in which any team may rise from the bottom to the top in two or three years. The league has designed it that way by enforcing a strict market cap and taking advantage of the college draft which amounts to a competition within the overall competition. Much of football analytics amounts to an unending quest to get around the limitations imposed by these factors.
What it comes down to in the end is selection of individual players who will perform well in concert with others. While other systems look at results for teams and players, Pro Football Focus divides NFL players into facets which include passing, rushing, receiving, pass blocking, run blocking, pass rushing, run defense, and pass coverage. The basic elements of performance for a wide receiver, for example, break down into separation from the defender, catching the ball reliably, and yards after catch. Thomas Dimitroff, CEO of the Tudor Jones start-up who worked for the New England Patriots in the early Bill Belichick/Tom Brady years, says that Belichick’s main criterion for receivers was separation. Having receivers who are good not great but run disciplined routes and get separation from the defender works well enough if you have a superstar quarterback like Brady. That keeps the market cap under control and leads to sustainable excellence.
What makes player evaluation so difficult is the fact that the performance of a given individual is highly dependent on extrinsic factors which involve the level of their opponents and the quality of their support. Not every incomplete or dropped pass is the fault of the quarterback. The receiver may have dropped the ball or run the wrong route, or the offensive line may have collapsed and forced the quarterback to throw under extreme pressure. For that reason the most frequently reported statistical results may be unhelpful in evaluating the quarterback. The relative values for completions, interceptions, and touchdowns are often out of his control. For that reason the statistical measures which flash across the TV screen aren’t very useful in major personnel decisions.
The PFF grading system evaluates every player on every play. The focus is on performance not measured by size, speed, completion percentage. or anecdotal reputation. It is adjusted when a failure was clearly the fault of another player or a particular situation. Each player is given a grade from -2 to +2 in 0.5 increments on each play. The “expected” grade is 0. Many plays earn the 0 expected but the PFF site defines exceptional performances on opposite ends of the scale such as “a catastrophic game-ending interception or pick-six from a quarterback, and at the other a perfect deep bomb into a tight window in a critical game situation.” The PFF self description adds that an adjustment is made to the “raw” grades to encompass for what the player is “expected” to earn given the surrounding situation on the field.
“Situation on the field” translates very directly into company performance in the business world. “Situations on the field” may vary from the expected as a result of conditions such as recessions, cost inflation, commodity prices, supply chain problems, product recalls, reasonable or unreasonable lawsuits, and economic shutdowns of the sort which took place in the recent pandemic. An economic shutdown is harder for a railroad, which has to run its routes and pay its employees even with a drastic reduction in freight. It is less difficult for an electric utility which has only a modest reduction in electricity usage. It may actually help low-end retailers like Walmart (WMT) which stand to add customers for basic items.
For an actively managed portfolio there is notionally an ideal balance among companies which perform better or worse under particular conditions. One of my pet peeves about Wall Street analysis, however, is the persistence of the view that you buy and sell stocks constantly to prepare for recessions, recoveries, inflation, etc. We just don’t know the timing of these things. Even if we did, taxes on capital gains will eat you alive. A great portfolio is constructed to deal with whatever happens in such a way as to meet its long term goals with little adjustment.
Begin By Selecting The Right Goals
Winning the Super Bowl is a bad goal. So is beating the S&P 500 Index (VOO). The reason is that both goals are overly specific and likely to lead to strategic mistakes. In football the amazing overall record of Bill Belichick explains why. Belichick has won 6 Super Bowls with Tom Brady but the accomplishments most indicative of his success include his 31 career playoff wins and record three consecutive seasons in which his team scored over 500 points. The most important of all is perhaps the fact that he just passed George Halas and now is second only to Don Shula for the most career regular season wins. He will likely pass Shula before he retires.
Why are these more meaningful achievements? The answer is, once again, the Law of Large Numbers. Performance over a longer period with more discrete events and different situations is the more accurate measure of results. Anything can happen in a single game. Once your team is in the playoffs you have a chance to win the Super Bowl if the ball bounces your way. Success comes from giving yourself a chance to win the Super Bowl every year, although many naive new coaches name winning the Super Bowl as their only goal. As a long-suffering Chicagoan, that’s why I was pleased when the new GM of “da Bears” announced his goal of taking over the NFC Central Division and never letting go. He started by getting rid of burdensome contracts of-over-the hill stars. This assured a losing season but also assured high draft choices and huge available market cap space starting next year. It’s the one measure, by the way, in which the Bears are assured of leading the league: low payroll. This greatly increases the probability of winning over the long term. If you win your division every year, Super Bowl appearances will take care of themselves.
Does any of this call to mind the question of goals for a stock portfolio? My own largest holding by far is Berkshire Hathaway (BRK.A)(BRK.B) and my overall household goal is to make a solid and consistent return at low risk. What return exactly? Lose the word exactly. As it happens, Berkshire has done better than the S&P 500 over the past couple of years but who cares? Investing is not about bragging rights. That’s like the occasional appearance in a Super Bowl, nice but not the ultimate measure of a successful strategy.
Thinking about the goal question made me think further about the goals of several different household portfolios. Here are a few of my thoughts:
- My own taxable portfolio is where I take risks. I prune any stocks or tranches which are under water at the end of every year in order to share the loss with the IRS. A tax loss bank can reduce your taxable income by $3000 per year or enable you to sell a bit of a big long term winner without owing any net taxes. I tweak the portfolio occasionally but often go through a full year without a trade.
- I run my wife’s portfolio the same way but a little more conservatively. She’s more than ten years younger than I am.
- In my Rollover IRA I aim for a return that maintains a certain level for the one of my children who will eventually inherit it. I try to keep annual returns which exceed the RMD – Required Minimum Distribution. I take moderate risks and put safe income investments there. Taxes are a minor factor because the inheriting child is likely to face less of an IRS rake-off than I do.
- My Roth IRA remains a puzzle. I have occasionally used it to speculate, without notable success. Speculation just isn’t my game. Most of the time I have used it as an ultra-safe place to compound income. I know all the arguments on both sides.
- My I Bond portfolio is an inflation hedge although in reality it hasn’t impacted my life at all during the current inflation. It provides peace of mind with what is probably a delusion of being immune to the impact of inflation. What it has been for 22 years is a great place to compound money and recently to capitalize on a rate over 13% annualized on I Bonds bought in 2000.
The overall goal for family portfolios can best be described as sustained excellence over the long term.
The Difficulties In Achieving Sustained Excellence
There are two approaches to putting together an outstanding NFL team: win now or be very good year after year. An example of the former is the Rams, who went all in to win and succeeded. Their philosophy goes all the way back to 1970s Washington coach George Allen whose innovative goal was to win now at all costs and let the future take care of itself. The Rams have followed the George Allen philosophy successfully for the last few years but in the process loaded their roster with high priced talent including many older players who are now trending downward in value. This year the chickens appear to be coming home to roost.
The Patriots and the Packers are examples of teams put together to succeed in the long run, although the Packers may have recently slipped from the philosophy that made them a perennial contender. The underlying strategy for winning in the long run is to draft a great quarterback and surround him with good enough secondary players who come and go in a way that maintains the level of pretty darn good (but not necessarily great). For the Patriots that QB was Brady. For the Packers it’s a string of winning QBs going back to the 1960s – now Aaron Rodgers preceded by Bret Favre and Bart Starr. How can other GMs put together that kind of team?
In January of this year Tudor Jones and son Jack launched SumerSports, the name Sumer chosen because the Sumerians were the first culture to quantify things. Jones and son were not the first to think of the idea of using analytics in NFL football, but they may have been the first to wrap football almost entirely in math. PDT himself is Chairman of the Board and son Jack is COO. The CEO is well-respected football exec Thomas Dimitroff who served as GM of the Atlanta Falcons and was twice NFL Executive of the Year. The Vice President of R&D is Eric Eager, a former mathematics and statistics professor who served as a data scientist at Pro Football Focus PFF from 2015 until this year.
SumerSports first received notice in this September 13 Wall Street Journal article. Other mathy evaluators are protective of proprietary approaches and SumerSports has so far presented nothing that can be found on the internet as to the particulars of its approach. They do provide this highly informative show entitled SumerSport Show in which CEO Dimitroff and R&D VP Eager provide quite a bit of broad insight into analytics along with entertaining football anecdotes.
The Quarterback Problem (And A Possible Solution)
What interested me most is that despite coming up on the football side Dimitroff’s anecdotes show that he was already doing innovative thinking about strategies such as drafting young quarterbacks and making them starters immediately. The idea was to get maximum use out of them while they are still being paid on their cheap 4-year rookie contract. The strategy is to then dump them before they become so expensive that paying them would wreck your market cap. This is what ultimately appears to have happened to the Packers who had overpaid, coddled, and mollified Aaron Rodgers until it became necessary to get rid of the star receiver who was his favorite target. The Rams are suffering from the same general pattern this year, and the Vikings appear to be going all in with a skilled but aging lineup which will run into age and market cap problems as early as next year (see Dimitroff on the #7 SumerSports Show). Investors should always be thinking about the stock portfolio equivalent of this problem. For many investors it’s the number one problem.
One of Dimitroff’s creative suggestions is that if a QB fails to hit performance goals by year two, you should dump him immediately and go through the process again and again if necessary. Some GMs, in fact, have advocated drafting a quarterback every year hoping for a lucky hit. This is a variant of the Cathie Wood approach to buying young companies with little in the way of a track record. The Packers tried it by drafting QB Jordan Love in the first round of the 2020 draft. Rodgers didn’t take this very well, feeling that his GM could have used the draft pick better on a wide receiver or other supporting weapon. Love has yet to see meaningful action while Rodgers responded by demanding more money, helped by the fact that he was NFL MVP the next two years. From the GM perspective, however, this left an aging lineup with an aging QB and little space in market cap to do much about it.
In this article on a value investor’s assessment of hot growth stocks I decided that of Palantir (PLTR), Shopify (SHOP), and Snowflake (SNOW), I would choose Snowflake as the most likely to justify its high price. I bought a small position and actually wrote down the rate of growth in sales and levels of future free cash flow it had to reach in order for me to keep it. It failed to hit these targets almost immediately and I sold at a modest loss. I’m not discouraged. If the current bear market in growth stocks goes far enough I’m open to trying again. I check Snowflake with every quarterly report to see if they have gotten back on track to meet my criteria. Buying a stock like Snowflake is like crossing your fingers and drafting a quarterback every year. Much is incalculable, but you want all the calculable odds in your favor before taking the plunge.
The most interesting current controversy, especially for us Chicagoans, is the Bears’ second year QB Justin Fields. Dreadful coaching by the previous regime held him back last year. This year he has broken out with a decent passing performance, especially if you give him PFF credit for dropped passes and receivers who ran the wrong route. There’s also the porous offensive line which keeps him under constant pressure. What makes him remarkable, however, is his ability to run the ball. He has gained more yards than the two pretty good Bears running backs combined. The question is how to evaluate QBs who combine outstanding running with good enough passing.
In a discussion of QBs who could also run, Dimitroff mentioned that he first realized the value of a mobile QB while watching Doug Williams, the first black quarterback to become Super Bowl MVP. What Williams did was use his feet in “avoiding negative plays.” If you look at the results following quarterback sacks, analytics tell you how damaging a quarterback sack is to points scored. Many of the outstanding young NFL QBs who became starters in year one have this sack avoidance profile which works perfectly with Dimitroff’s “modest proposal” to start em, use em, and dump em before they ruin your market cap situation by becoming expensive.
Between the time I wrote the previous paragraph and returned from teaching a few tennis lessons the Justin Fields situation had taken a worrisome turn. The Bears had lost to the Falcons as Fields bravely but unsuccessfully played through a hamstring injury and what has turned out to be a dislocated left shoulder. It pointed out the downside of running quarterbacks whose ability to run declines after being tackled repeatedly for a few years. I can count on the fingers of both hands the great running backs who have lasted for as much as a decade. That’s since I was a kid in the 1950s. Many pocket passer QBs remain very good close to twice that long. This is reflected in the fact that running backs rarely get long and expensive contracts. For Fields the challenge is to develop his skills as a passer before his running skills decline. For GMs it’s probably best to stick with Dimitroff’s description of a quarterback with good enough feet to “avoid negative plays.” Avoiding negative plays is one of the major goals in a stock portfolio as well.
Using Analytics To Construct A Winning Portfolio
Readers of my articles on individual stocks know that I often use the ten year series of a number of stock metrics. The ten year period works well when calculating long term performance. My favorites include total revenues, total expenses, net income, long term debt, shares outstanding, earnings per share, dividends per share, payout ratio, and free cash flow per share. For the most part these metrics can be directly compared stock to stock, although a few businesses require a few variations.
As to Factor Grades on this site I generally make estimates of growth, valuation, and profitability myself and treat Momentum and Revisions as short term factors. The major use of the short term is to confirm or raise questions about a long term decision. It doesn’t hurt if a value stock you just bought starts to confirm the decision right away. My suspicion is that many investors use short term indicators this way.
The only thing I do which I have never mentioned or heard mentioned by other investors is play a game in my head pretending that I know nothing about the company except the numbers. I mean literally nothing. Nothing about the industry or sector, nothing about the products and brands, nothing about the general reputation. It’s amazingly hard to do but I use it more and more because it matches the task which involves seeing a company in competition of all other companies for your capital. That’s where analytics starts.
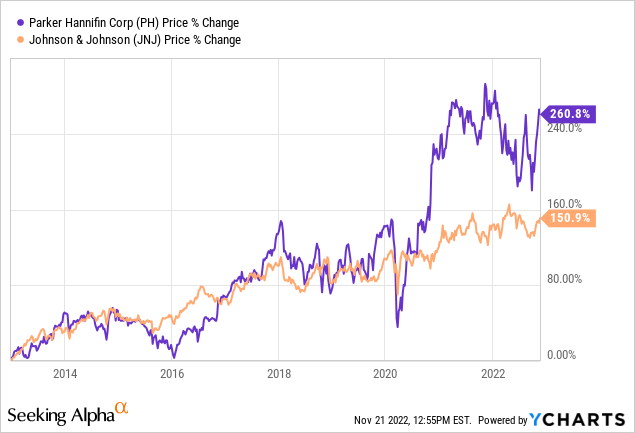
The first time I set forth this approach consciously was in this 2013 article, the 6th article I published on this site. It was an early attempt to formalize what I had previously done intuitively. SA did not provide the same array of financial numbers in those days, and I derived numbers from various sources including F.A.S.T Graphs and Annual Reports. I owned both stocks then and own both of them now. The title of my article was “Comparing Apples To Oranges: Johnson & Johnson And Parker Hannifin.”
JNJ had15 times the market cap of PH, a mid cap. Its P/E of 21 was higher than that of PH which sold at an 18.5 P/E. PH had twice the debt level of JNJ, although neither had a debt problem. Both received a substantial amount of their income from international divisions. Both had increased dividends every year for more than 50 years and were in the top 5 or so stocks which had done so, a performance which has continued into the present. Growth rates over longer periods were similar but PH seemed to grow at a somewhat higher rate if you smoothed the impact of recessions. I confirmed this by using three-year averages as the begin and end points. The market seemed to regard JNJ as more of a proven blue chip worthy of slightly higher valuation. I disagreed.
The market and P/E variations over the cycle reflected the fact that PH operated in a cyclical industry and the stock price generally went down with the lower earnings which resulted from a recession. Both income and stock price recovered quickly with the economy and PH always made new highs within three years. JNJ had steadier growth and rarely reported down earnings. They did, however, have frequent product recalls and legal settlements for products alleged to harm users. These were reported in footnotes as one time write-offs, although it was clear to me that they were a normal cost of doing business in the health products industry. If reported in a way equivalent to PH’s, their earnings stream would have been at least as lumpy as Parker Hannifin’s. In effect, JNJ created its own private recession every three or four years. In the end I kept both stocks but added more to PH. Here’s the chart comparing results since the year of that article:
Data by
YCharts
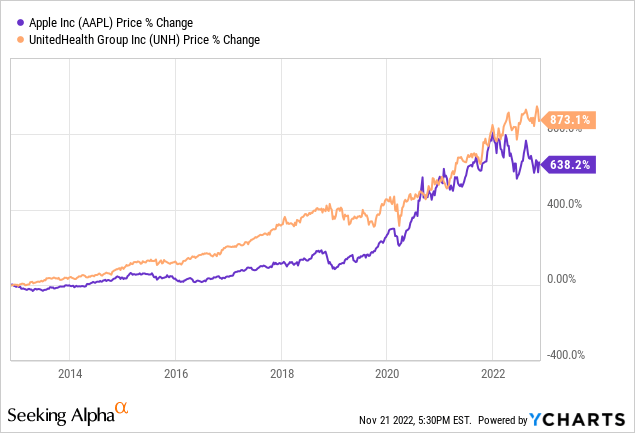
The Parker Hannifin/Johnson & Johnson comparison was my first foray into using pure data as the major focus when ranking companies and stocks. I recall at the time making a first effort to ignore size, name, business, and reputation and just look at the numbers. By the time I wrote this article on UnitedHealth (UNH) I had made it a principle to play the mental game of stripping away names, industries, and market cap along with products, brands, and general reputation. Based purely on the numbers I concluded that Apple (AAPL) and UNH were like twins separated at birth. I also called attention to the oddity that the CRSP-generated indexes classified Apple as the number one stock in the Growth Index (as well as the entirety of the 500) while United Health ranked second in the Value Index. Per the CRSP methodology both stocks were represented in both indexes. If you use basic numbers to calculate rates of change rather than size they are almost identical on almost all major metrics. It should come as no surprise that their relative price action changed places frequently as the time interval shifted. Here’s the chart:
Data by
YCharts
If you are able to fiddle with the chart you will see that UNH led for YTD and 1-year, Apple led for 3 and 5 years, and UNH led decisively for 10 years and all longer periods. This reflects changes in market attitudes toward the two but also the fact that in the long term Apple had more ups and downs. As a result the longer term outperformance of the presumably more consistent and defensive health stock reverses the result comparing JNJ and Parker Hannifin. I own neither directly but participate in Apple by ownership in Berkshire Hathaway. It’s worth noting that the algorithm which puts together Growth and Value indexes pushes Apple and UnitedHealth in opposite directions.
Market Cap Weighted Indexes Provide Portfolio Renewal But Have Their Version Of The “Quarterback Problem”
The algorithm by which the S&P 500 Index is constructed is simplicity itself. It is weighted by market cap and updated after every trading day. That assures that you won’t miss the rising stars which survive the startup phase and begin to grow. You won’t quite get in on the absolute ground floor, and they certainly won’t overweight winners until they have been winners for a while. They will enable you to share in their growth as their weight within the index increases. So much for the problem of finding and owning the Snowflakes which have a shot at becoming the next great thing. The index will do the work for you.
There is, however, one problem. As innovative companies rise to the top they gradually become a dominant influence within the index. It’s common, perhaps inevitable, that their valuations overshoot fair value. That’s what happened in the ten year bull market featuring the FANGS and a few similar high profile, high growth stocks. It’s the equivalent of the “quarterback problem.” At the top of the last bull market, in November 2021, the FANG stocks, plus, Tesla (TSLA) and Nvidia (NVDA) made up more than 30% of the index. That didn’t leave a lot of room for inexpensive pretty good players who were priced for value. Eventually the bubble broke and Value as a class took the lead.
To deal with this problems I have used Berkshire Hathaway as a diversified value stock with about 100 wholly or largely owned subsidiaries. Its best subsidiaries have behaved like the index stars and left the less successful acquisitions in the dust although they reprice in the market and can’t create the “quarterback problem” of a bubble like the FANG stocks. If there’s a weakness in holding Berkshire as a personal index, it’s that it doesn’t automatically contain diamonds in the rough that are just starting out.
Because of its automatic inclusion of tomorrow’s winners I would like to make the S&P 500 a major part of my portfolio. If the current valuation bear market in rapid growth stocks continues for a while it may remove the “quarterback problem” impediment and enable me to buy the index and take advantage of its cleverly simple algorithm.
Conclusion
Neither building an NFL winner nor building a great portfolio is easy. Numbers plus artificial intelligence to organize them may help, bur as Paul Tudor Jones said in the quote at the top, “no man can beat a machine but no machine can beat a man with a machine.” That’s for now anyway, but just ask this generation of chess masters. I wish Tudor Jones and son the best of luck.
Enjoyed this article? Sign up for our newsletter to receive regular insights and stay connected.