
Momentum is the simple idea that stocks which performed relatively strong over the recent past (winners) tend to outperform those that performed poorly (losers). The Invesco S&P 500 Momentum ETF invests in the 100 stocks with the highest “momentum score” (12-month return) from the S&P 500 Index. Since inception in 2015, SPMO delivered momentum exposure with respect to the academic benchmark of Kenneth French. Since 2017, it also outperformed most momentum-peers
Invesco S&P 500 Momentum ETF: Large Cap Momentum At Its Best (NYSEARCA:SPMO)
fter writing about several momentum ETFs (QMOM here and here, MTUM here), I will now cover one of the remaining two in my subjective peer-group: the Invesco S&P 500 Momentum ETF (NYSEARCA:SPMO). The ETF again follows a somewhat different methodology than the other two, so I think it is worth a follow-up.
Just to get everyone on the same page. Momentum is the simple idea that stocks which performed relatively good over the recent past (winners) tend to outperform those that performed poorly (losers). The most basic form of such a strategy is to simply rank stocks by their 12-month returns and go long (short) a portfolio of those with the highest (lowest) past performance. In the long-only world, which I cover in this article, you would accordingly over and underweight winners and losers with respect to a benchmark.
Although appearing rather simple, momentum historically “worked” over different sample periods in virtually all geographies and even within different asset classes. There are also plausible theories why momentum led to risk-adjusted profits in the past, so we can be reasonably sure that the factor will not disappear over time. For more information about the general idea behind momentum, I suggest to read my first article on QMOM and/or check this post.
Implementing Momentum Via SPMO
For nerdy-people like me, the short description on SPMO’s website that the fund “[…] tracks the performance of stocks in the S&P 500® Index that have a high “momentum score”.” is not sufficient. So I picked up the methodology of the underlying index from S&P Global, the index provider. In Appendix A, S&P explains how they determine their “momentum score”:
The momentum value is computed as the 12-month price change, excluding the most recent month of the security in local currency. If 12 months of price history is not available, momentum value is calculated from nine months of price history.
[…]
The momentum value is further adjusted by the security’s volatility. For a given positive price change over the evaluation period, lower volatility improves the adjusted momentum value. For a given negative price change over the evaluation period, higher volatility improves the adjusted momentum value.
Source: S&P Momentum Indices Methodology, Page 19-20
This is essentially the standard academic definition of momentum and I think this is a good and transparent choice for a smart-beta momentum index fund like SPMO. More active momentum managers obviously try to build processes beyond that basic definition, but the simple 12-month return subsumes a lot of momentum’s characteristics. The volatility adjustment is also reasonable as it further improves momentum scores of stocks with steady up-trends which are exactly the type of securities we would like to catch.
At each rebalancing date, stocks in the S&P 500 Index are ranked by this momentum score. The top 20% (i.e. the top 100 momentum stocks) are then selected for inclusion in the S&P 500 Momentum Index. Stocks are basically market-cap weighted but there are some adjustments for momentum scores, sector constraints, and maximum weights for each position. Overall, the methodology ensures that large companies with strong momentum receive the highest weights in the index.
The index rebalances twice a year, at the third Friday of March and September. As I mentioned in my previous article on MTUM, this “slow” rebalancing can be problematic. Momentum is empirically a quite “fast” factor that tends to produce high turnover and lives from quick adaption to new environments (despite just rebalancing twice a year, SPMO still had an annual turnover of >100%). Most academic studies therefore assume monthly rebalancing for momentum. If you slow down the strategy, you should expect problems in an environment with shorter trends. For example, most momentum strategies probably started 2022 with strong exposure to technology stocks. This was obviously not optimal and the faster you rebalanced, the faster you re-allocated in the newly outperforming energy and health-care names. Over the 2010s, in contrast, trends were more long-lived and slower rebalancing therefore didn’t hurt too much or was even helpful. Long-term evidence still suggests that momentum is a rather “fast” factor and therefore advocates faster rebalancing. Similar as for MTUM, I don’t really understand why index providers don’t move closer to the well-researched academic benchmark and rebalance their indices at least quarterly.
Anyway, let’s see how this methodology compares to the well-known momentum portfolio from Kenneth French’s Original Post>
SPMO Vs. Academic Benchmark
The following chart shows the cumulative performance of the SPMO ETF vs. the Large Cap Momentum portfolio from Kenneth French’s website since inception of the fund in October 2015.
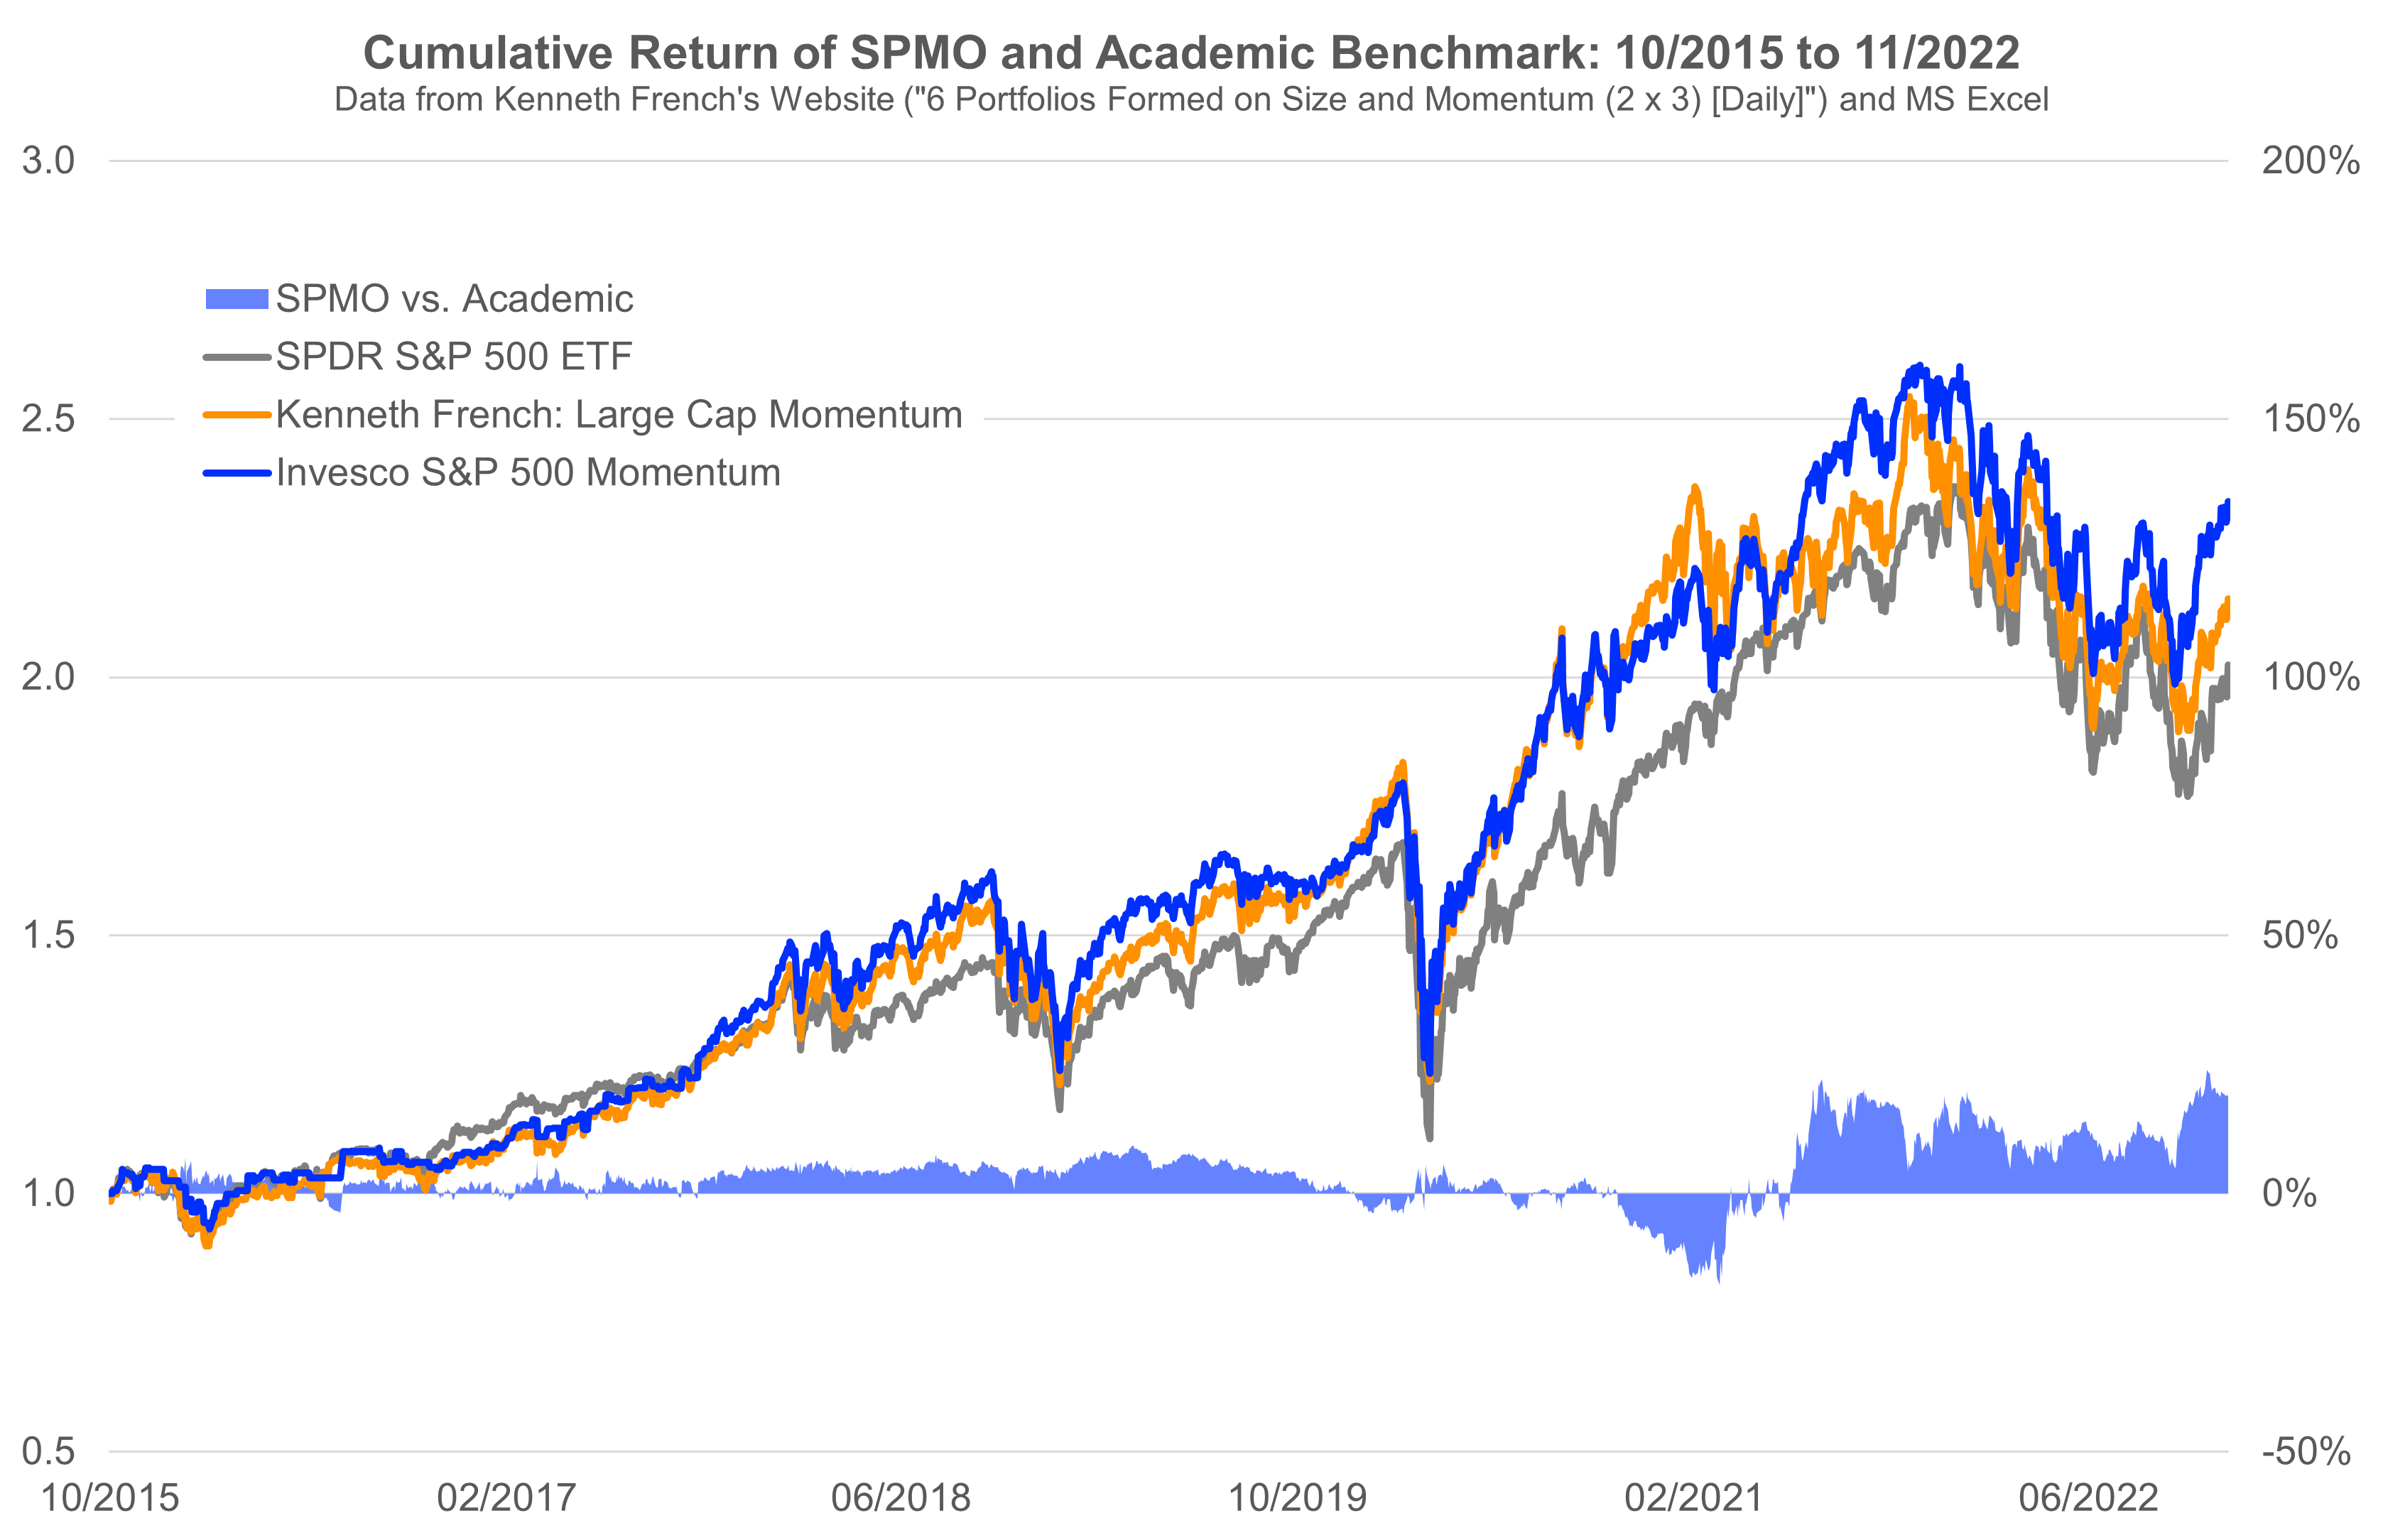
Until the beginning of 2021, SPMO performed mostly in line with the academic benchmark (which is a good sign for the momentum methodology!). Starting in 2021, the ETF even outperformed the benchmark portfolio. I guess the reason for this is that SPMO is more concentrated and therefore held larger positions in the mega-cap growth stocks which dominated the market in 2021. In 2022, relative performance was a bit whipsawed, but overall, the ETF managed to stay ahead of the academic benchmark (which is again a good sign!).
By and large, I think we can confidently conclude that SPMO actually delivered (large-cap) momentum exposure to its investors and behaves quite similar to a transparent academic benchmark.
SPMO Vs. Momentum Peers
The next chart is a bit more practical and compares SPMO to my (arguably somewhat subjective) peer-group of momentum funds over the longest common period since October 2017.
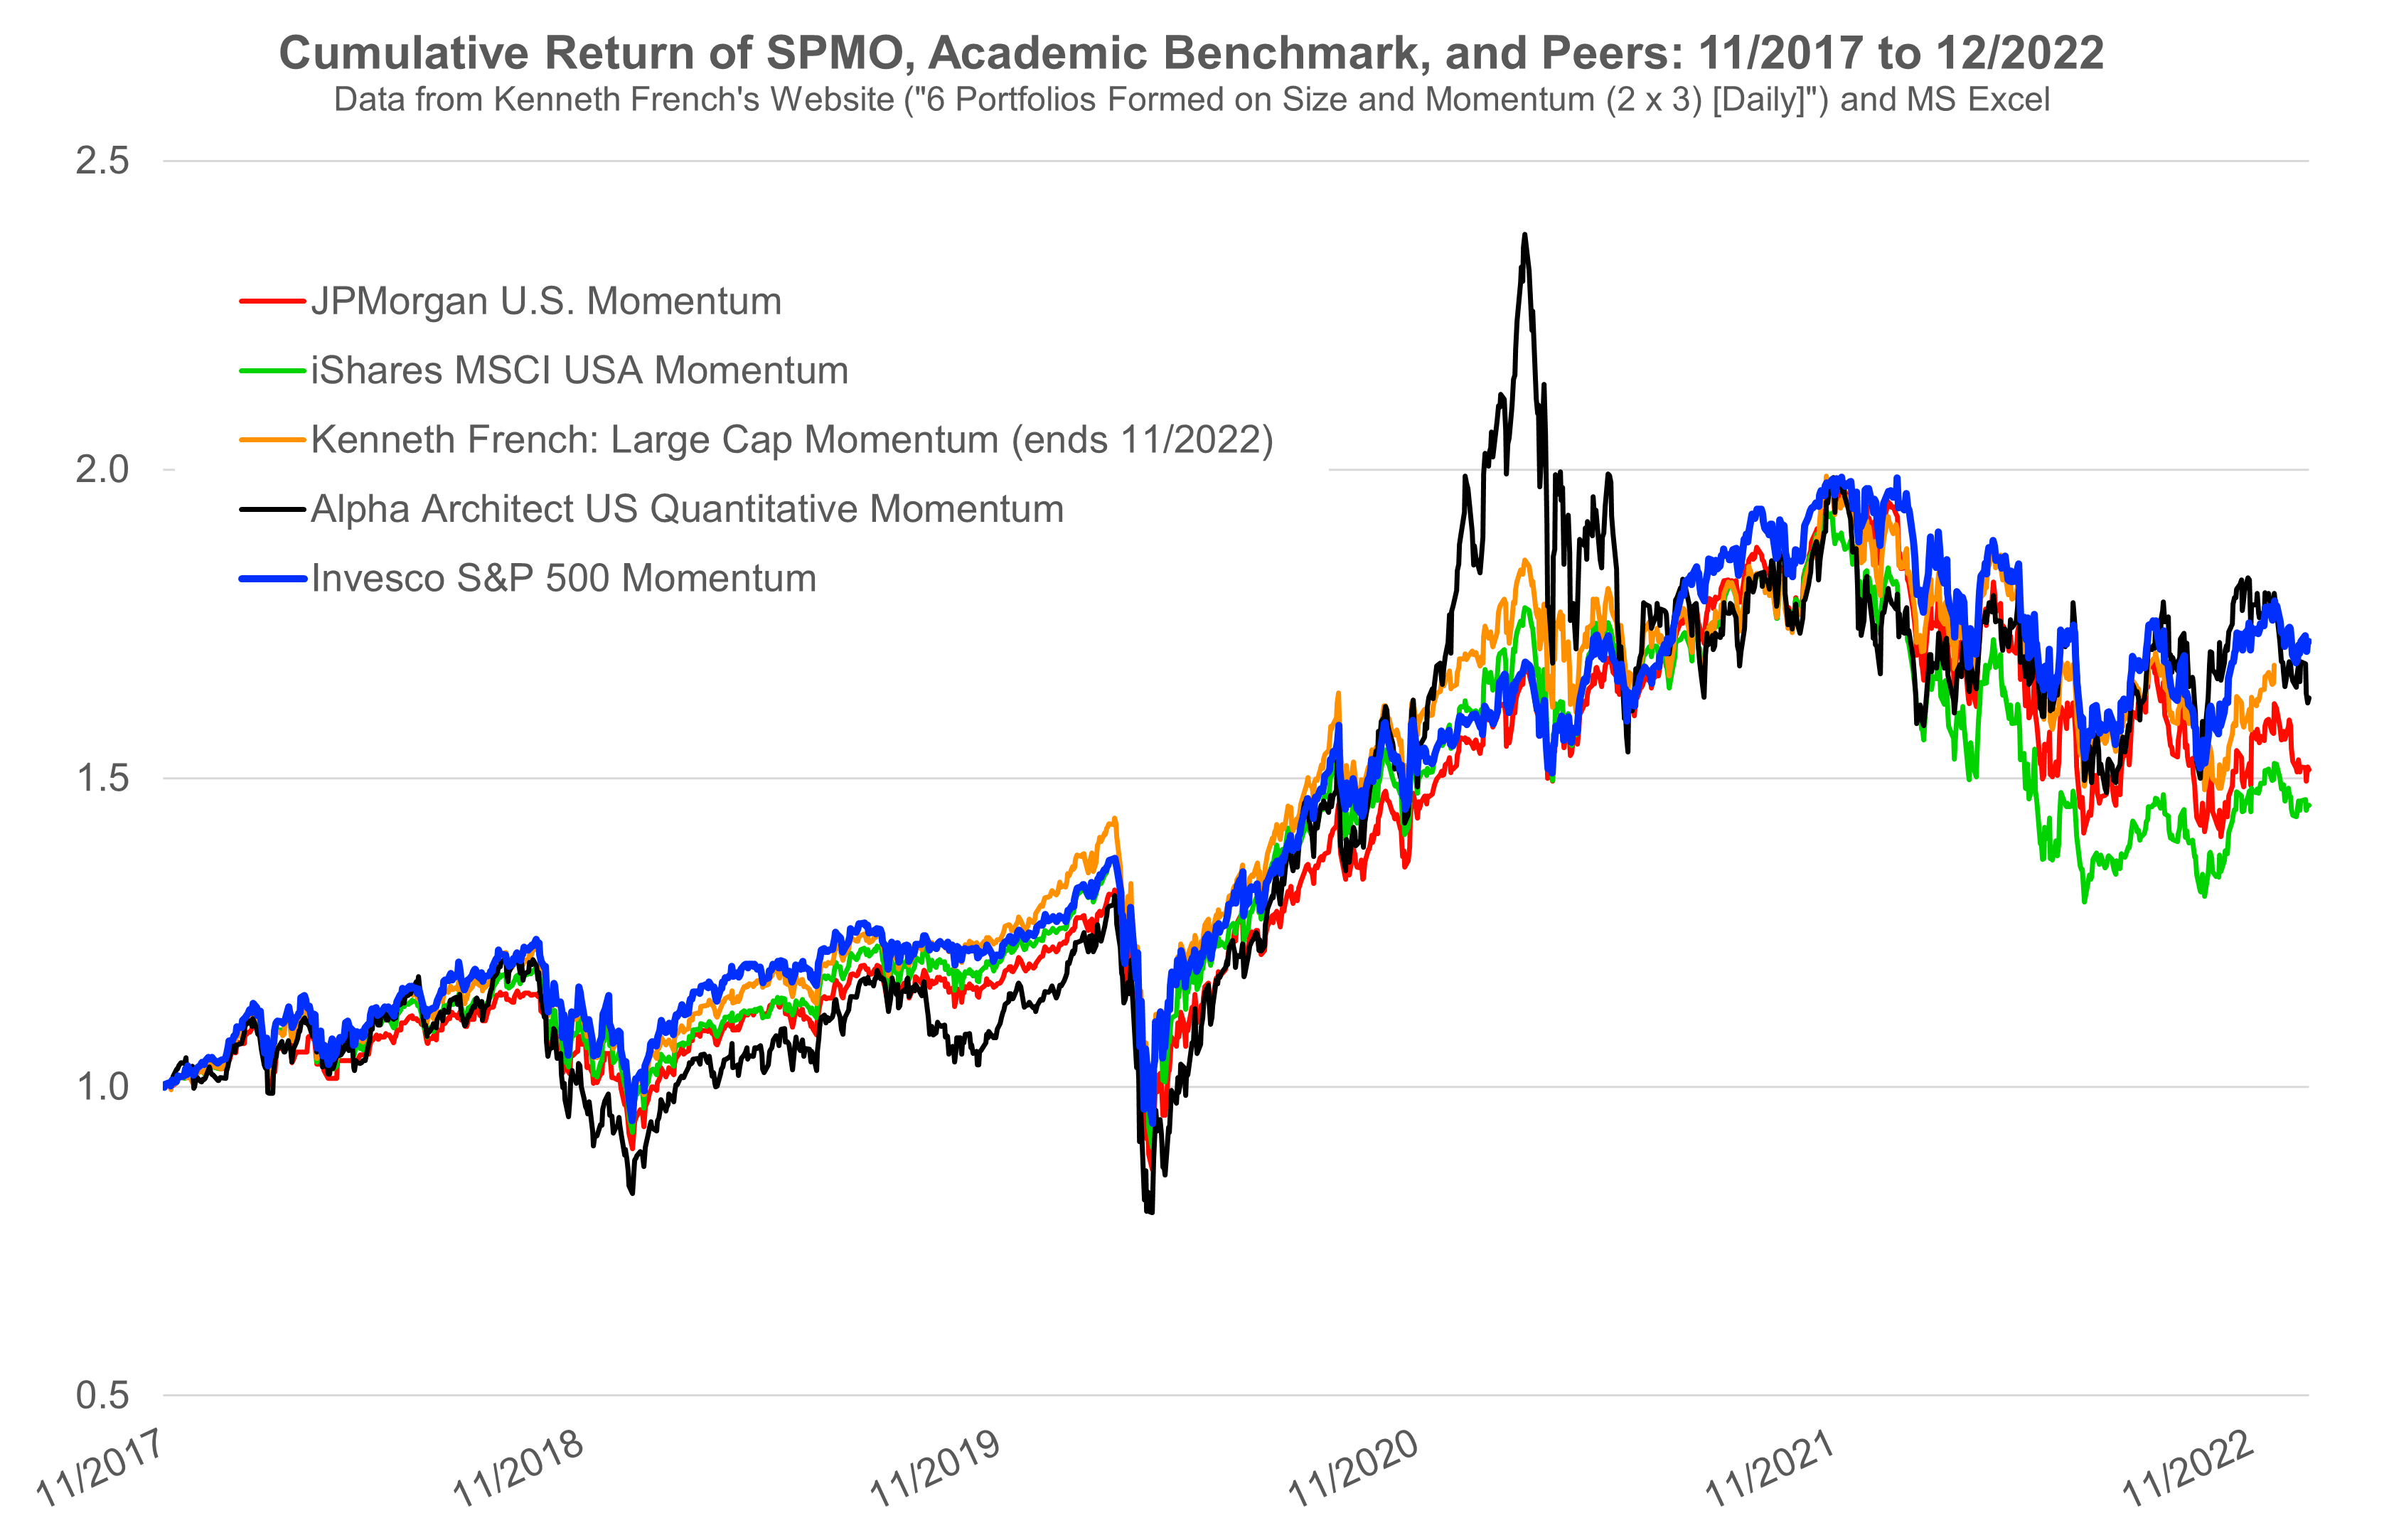
Over this period, SPMO was actually the best performing momentum fund, even ahead of the much more active and well-designed Alpha Architect ETF (QMOM). Again, I guess this was driven by the fact that SPMO took much larger positions in the outperforming growth-mega caps which were the dominating force over the last years. In addition to that, the S&P 500 Index (which is the universe for SPMO) generally outperformed the overall market over this period. All else equal, it is of course easier to construct an outperforming portfolio by picking from an outperforming universe. So this is a bit of an unfair comparison, as QMOM also selects from small and mid caps.
What is more interesting though, is that SPMO also outperformed the iShares MSCI USA Momentum (MTUM). This is quite surprising because conceptually, the two ETFs are very similar. They both use a volatility-adjusted momentum score to select stocks from a large cap US universe and rebalance only twice a year. SPMO is somewhat more concentrated (SPMO holds the top 100 momentum stocks from the S&P 500 Index, MTUM currently holds 125 momentum stocks from the MSCI USA Index), but I don’t think this explains all the difference.
My best guess for the reason behind the performance gap are the rebalancing dates. MTUM rebalances in May and November, SPMO in March and September. If you look at the chart, the performance of the two really started to diverge in 2022. I suspect that due to the earlier rebalancing date, SPMO shifted earlier to the new winners (Energy, Health Care). However, as I don’t have access to the required data, I unfortunately cannot analyze that more thoroughly. Also note that even if this explanation was true in 2022, I think it remains very difficult to reliably predict if it is better to rebalance momentum in May/November or March/September. That said, there are studies on seasonality patterns of momentum (for example Sias, 2007) which show that the strategy is stronger in quarter-ending months. Against this background, the rebalancing months of MTUM should be even better because you position yourself before the empirically strongest momentum-months. But that apparently did not help in 2022…
As in my previous post, the following table again summarizes the data. It also includes the AQR Large Cap Momentum Style Fund for which I unfortunately don’t have access to the time series data.
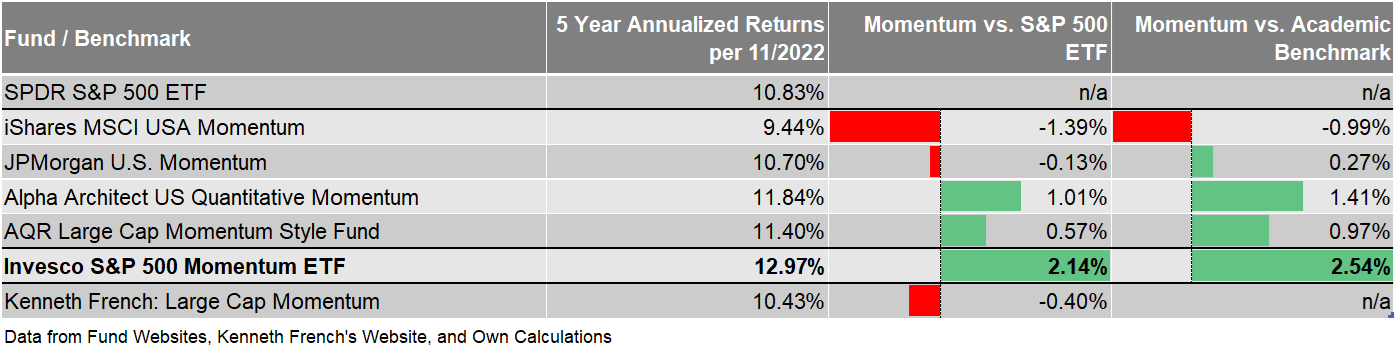
The general result remains unchanged. SPMO delivered momentum exposure and beat the S&P 500 ETF, the academic benchmark from Ken French, and all of my momentum-peers over the last 5 years.
Conclusion
Okay, so what do we now make from all these analyses? Let me start with a general note about systematic strategies like momentum. In general, quantitative strategies tend to “work” a little more often than not. If you have a model that correctly identifies outperforming stocks 55% of the time, this is already very good. Stock markets are pretty efficient and we should expect predictive patterns to be arbitraged away quickly. So we have to live with low signal-to-noise ratios. Factor strategies like momentum therefore rely on large universes and diversified portfolios to achieve the “work on average”. Against this background, you shouldn’t narrow your universe to the S&P 500 unless you really just want large cap momentum. The more bets you can place, the higher the chance that the momentum premium actually materializes for your portfolio. Empirical analyses further show that momentum worked similarly well, if not better, for small caps.
So this is my first point. Unless you don’t actively want large-cap momentum, there is no reason to restrict yourself to the S&P 500. QMOM (still my favorite momentum process/manager), for example, selects stocks from about 1500 stocks of the US market.
The second point, specifically about the methodology of SPMO, is once again rebalancing. In my opinion, it is quite unfortunate that index providers rebalance the relatively “fast” momentum factor only twice a year. I think it should be possible to also do this quarterly and this is a clear negative of many smart-beta momentum ETFs, including SPMO and MTUM.
Third and finally, if you really want just large cap momentum, I believe SPMO is slightly better than MTUM. The methodology allows for a somewhat more active and concentrated implementation of momentum which is what we would like to have. In addition to that, the methodology is also slightly more transparent. With SPMO, you know that you own the top 100 momentum stocks from the S&P 500. The final weights are of course a bit more difficult, but overall, I think this is more intuitive than the over and underweights of MTUM. And for the really thrifty ones, SPMO is also a little bit cheaper than MTUM (0.13% vs. 0.15% total expense ratio). So if you have two fairly similar investment processes but one is easier to understand and cheaper, I think the decision is not too difficult.
Enjoyed this article? Sign up for our newsletter to receive regular insights and stay connected.